

Many studies have shown that socio-economic status (SES), conventionally measured as education, occupation or income, contributes to inequalities in health( Reference Darmon and Drewnowski 1 , Reference James, Nelson and Ralph 2 ). Those in lower socio-economic groups have a higher incidence of premature death, and suffer more from heart diseases and some forms of cancer, than those in more socio-economically advantaged groups( Reference James, Nelson and Ralph 2 ). One important risk factor for these diseases may be the quality of the diet( Reference Darmon and Drewnowski 1 ).
Adequate consumption of micronutrients is one of the key elements of diet quality. Within the EURRECA Network of Excellence (www.eurreca.org), it was shown that the prevalence of micronutrient inadequacies in Europe ranged from 11 % to 30 % for Cu, folate, Se, iodine, vitamin B12 and vitamin C in adults( Reference Roman-Vinas, Ribas-Barba and Ngo 3 ). A recent study has shown that diet cost mediates the relationship between socio-economic position (education and income) and diet quality( Reference Aggarwal, Monsivais and Cook 4 ). Since energy-dense and nutrient-poor diets are cheap and more consumed by those with limited economic means and lower educational level( Reference Darmon and Drewnowski 1 , Reference James, Nelson and Ralph 2 ), it is likely that SES could be associated with variation in micronutrient intake and status. Currently, a knowledge gap exists due to lack of an overview on intake and status of public health-prioritized micronutrients by SES group. Available data that stem from methodologically comparable nutritional surveillances have studied intake and/or status of a few micronutrients within limited life stages, whereas literature reviews have predominantly focused on the relationship between SES and intakes of macronutrients or specific food groups and food patterns (e.g. fat, fruits and vegetables)( Reference Darmon and Drewnowski 1 , Reference Giskes, Avendano and Brug 5 – 12 ). Furthermore, the studies have been performed primarily in adults, while children and the elderly might be more vulnerable to insufficiencies. Therefore the aim of the present study was to provide the evidence base for targeted nutrition policies to reduce the risk of micronutrient/diet-related diseases among disadvantaged populations in Europe, by focusing on intake and status of folate, vitamin B12, Fe, Zn and iodine, and intake of vitamin C, vitamin D, Ca, Se and Cu. We carried out a systematic review on socio-economic differences in micronutrient intake and status in adults, the elderly and children in Europe using education, occupation and income as SES indicators. In addition, we report on availability of the data that addressed our research question.
Methods
Literature search and data extraction
Prioritization of the micronutrients under study was evidence based( Reference Cavelaars, Doets and Dhonukshe-Rutten 13 ) and accounted for: (i) the amount of new scientific evidence, particularly from randomized controlled trials; (ii) the public health relevance of micronutrients; and (iii) variations in current micronutrient recommendations for folate, vitamin B12, Fe, Zn and iodine for intake and status, and for vitamin C, vitamin D, Ca, Se and Cu for intake. Socio-economic indicators of interest were educational level, occupational status and income as these are the most conventionally used( Reference Kunst, Bos and Mackenbach 14 ).
A systematic literature search was carried out in MEDLINE and Embase databases to collect studies published from January 1990 up to November 2011 that were performed in apparently healthy populations of all life stages in Europe. Both databases were searched using database-specific indexing terms for dietary intake and/or nutritional status of at least one of the micronutrients under study, SES (education, occupation or income) and Europe: (micronutrients (listed) OR biomarkers of status (listed)) AND general intake/status terms (diet/or eating/nutritional support/or dietary supplements/or food, fortified/or deficiency diseases/nutritional requirements/or nutritional status/or nutritive value/or nutrition assessment/or diet records) AND socio-economic status terms (socio-economic factors/or poverty/or social class/or educational status/or employment/or unemployment/or income/or occupations/or social conditions) – in title and abstract – AND country (European countries listed). The search strategy can be obtained from the authors upon request.
Studies were considered eligible if they reported on micronutrient intake and/or status across different levels of education, occupation or income. For the final analysis, we used the data where dietary intake was assessed at the individual level and reported as mean intake. Nutritional status was reflected by the level of status markers defined as best practice biomarkers within the context of EURRECA( 15 , Reference Ristic-Medic, Piskackova and Hooper 16 ).
The search results were screened on the basis of title and abstract by two independent reviewers. For articles that seemed to comply with the study criteria, full texts were obtained and checked for relevance by two independent reviewers. When necessary, the discrepancies in abstract and study selection were discussed, and further processing on inclusion or exclusion was made based on consensus.
Study characteristics (country, life stage and number of subjects, sampling procedure, descriptors of SES) and levels of micronutrient intake/status (mean, standard deviation and/or standard error) and energy consumption were extracted into a database.
Data analysis
We calculated the relative difference (%) in intake and status between the lowest and highest SES groups as a percentage of the value of the highest SES group, for males and females separately unless the paper reported data only for both genders together.
In addition, if studies reported a standard deviation or standard error, the 95 % confidence interval of the mean intake/status for SES groups was calculated. The t test was performed to evaluate if the difference in intake/status between the lowest and highest SES groups was statistically significant (the level of statistical significance was set at P < 0·05).
Means and 95 % confidence intervals (when standard deviations/standard errors were available) of intake and status of the lowest and highest SES groups were plotted per micronutrient for males and females separately. Where the results of the t test showed a statistically significant difference in intake/status between the lowest and highest SES groups, study was marked with an asterisk (*; Figs 1–10).
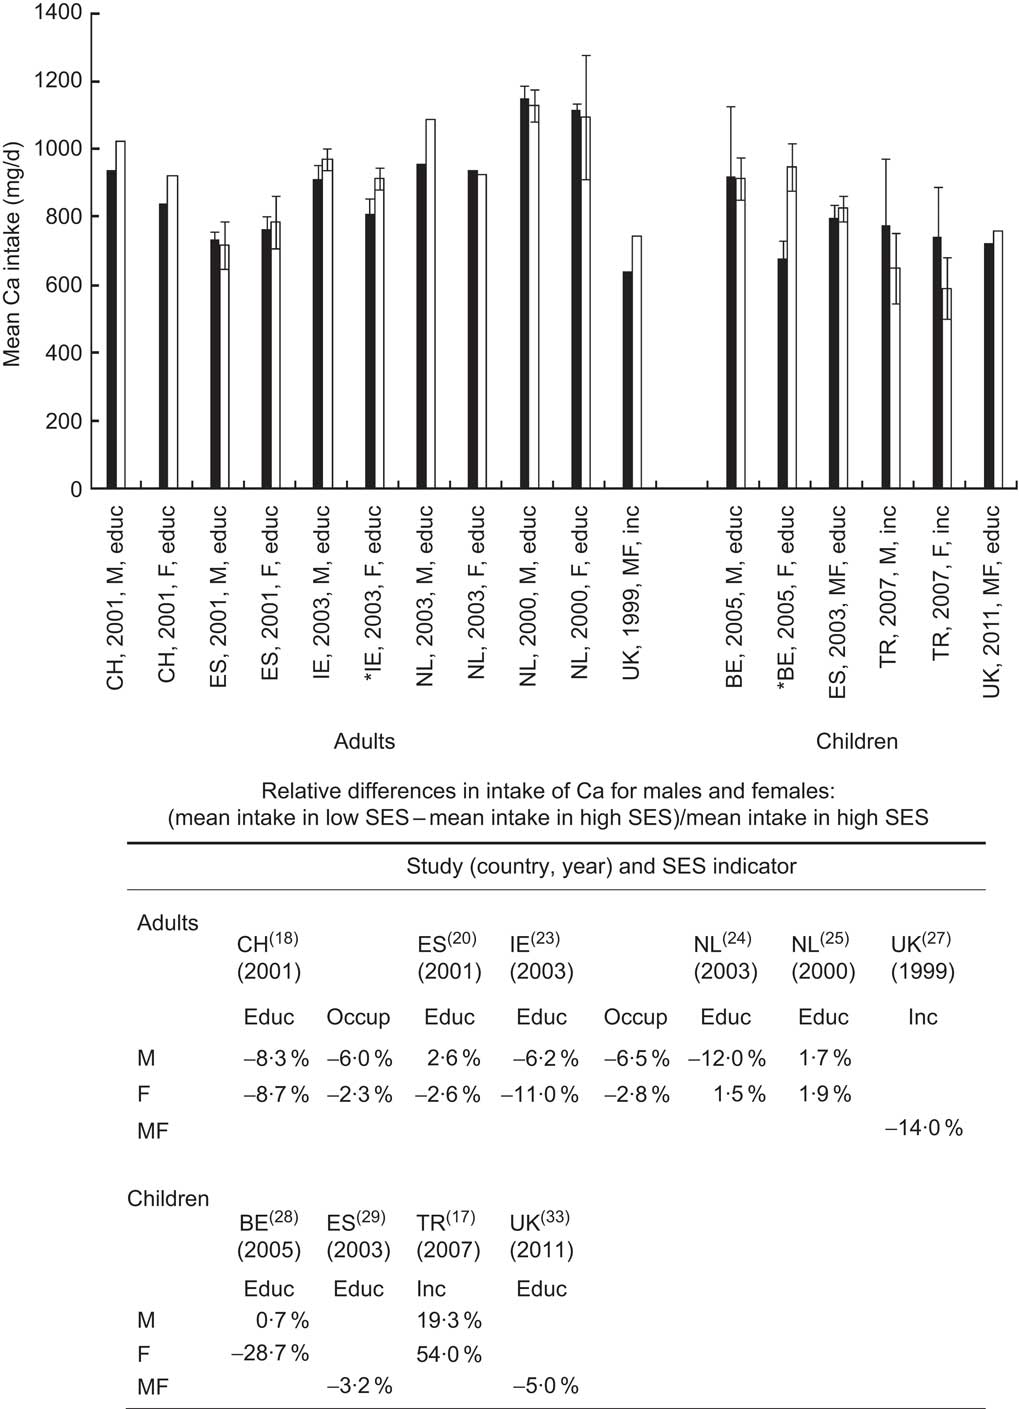
Mean calcium intake (with 95 % confidence interval, where available, represented by vertical bars) of European adults/elderly and children (M, males; F, females; MF, males and females) in groups of lowest (▪) and highest (□) socio-economic status (SES) by different SES indicators (educ, education; occup, occupation; inc, income). * denotes a statistically significant difference (P < 0·05) in mean intake between the lowest and highest SES group. Countries with studies available: BE, Belgium; CH, Switzerland; ES, Spain; IE, Ireland; NL, Netherlands; TR, Turkey; UK, United Kingdom
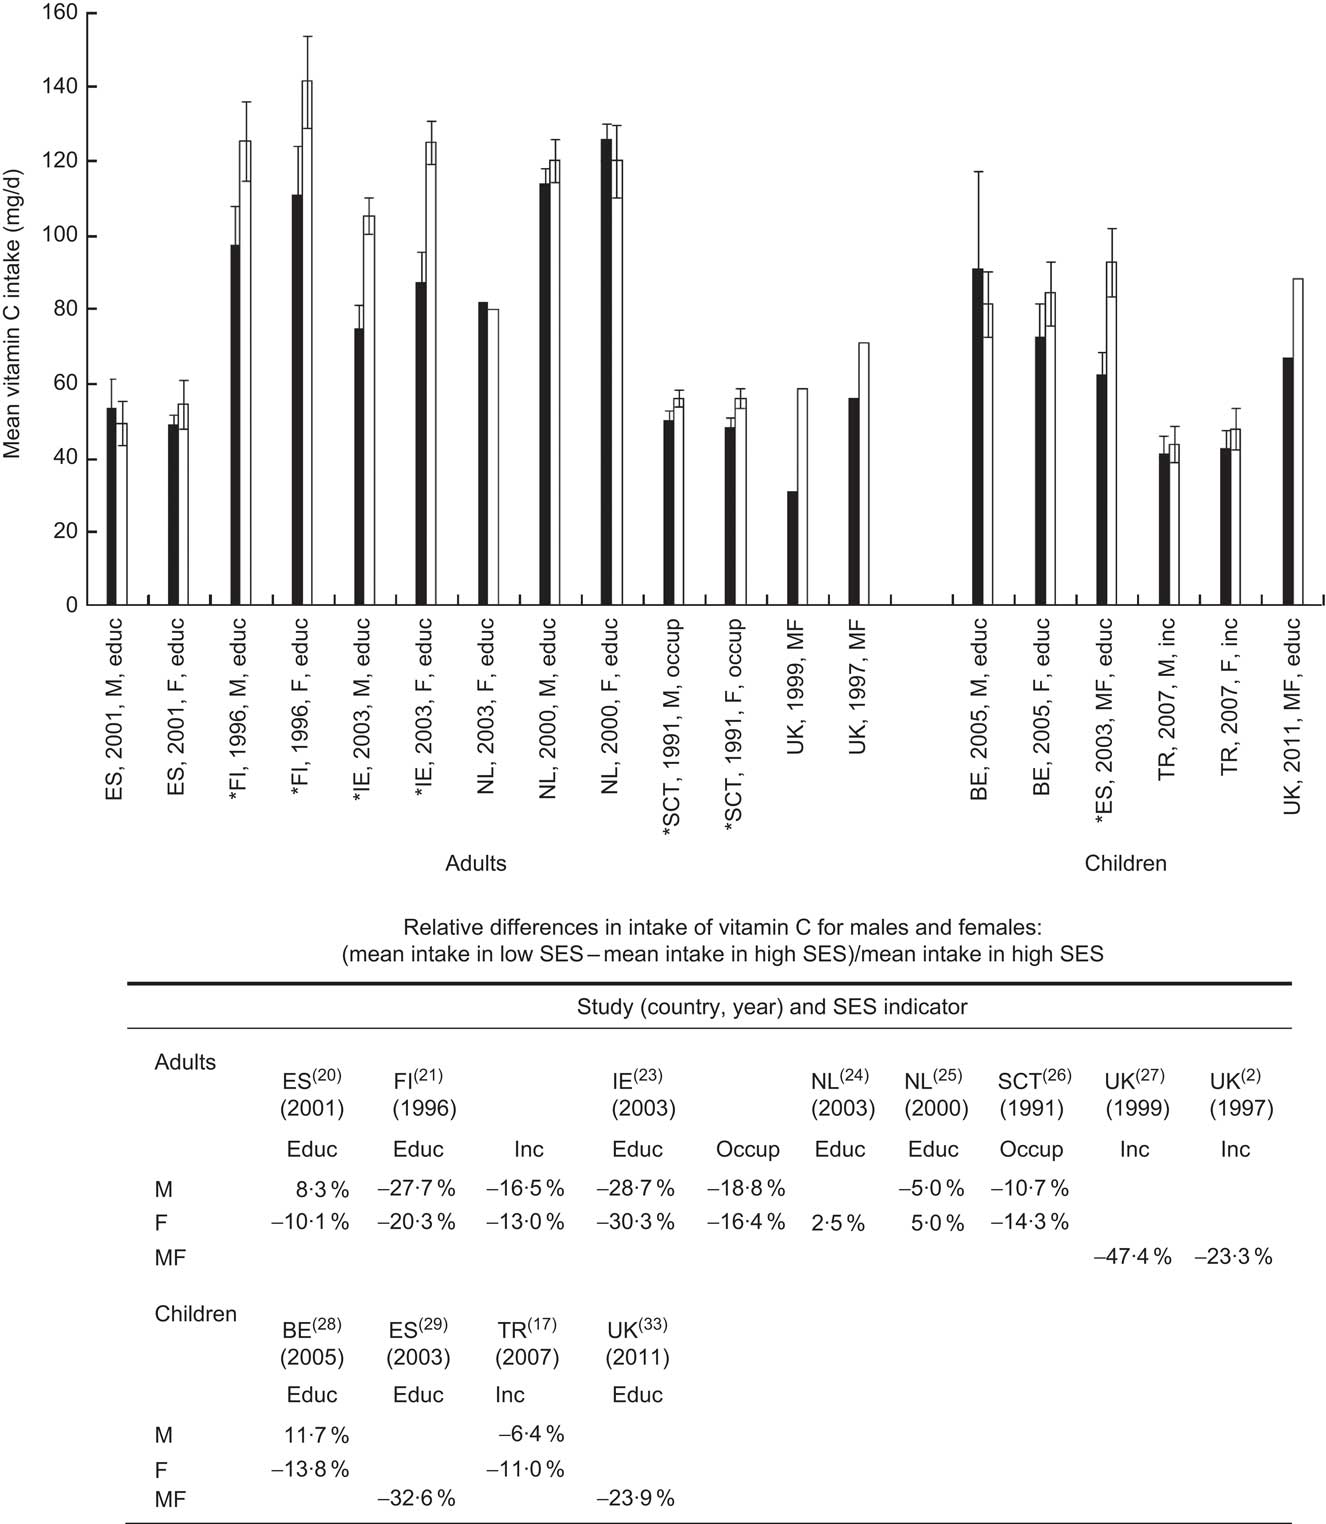
Mean vitamin C intake (with 95 % confidence interval, where available, represented by vertical bars) of European adults/elderly and children (M, males; F, females; MF, males and females) in groups of lowest (▪) and highest (□) socio-economic status (SES) by different SES indicators (educ, education; occup, occupation; inc, income). * denotes a statistically significant difference (P < 0·05) in mean intake between the lowest and highest SES group. Countries with studies available: BE, Belgium; ES, Spain; FI, Finland; IE, Ireland; NL, Netherlands; SCT, Scotland; TR, Turkey; UK, United Kingdom
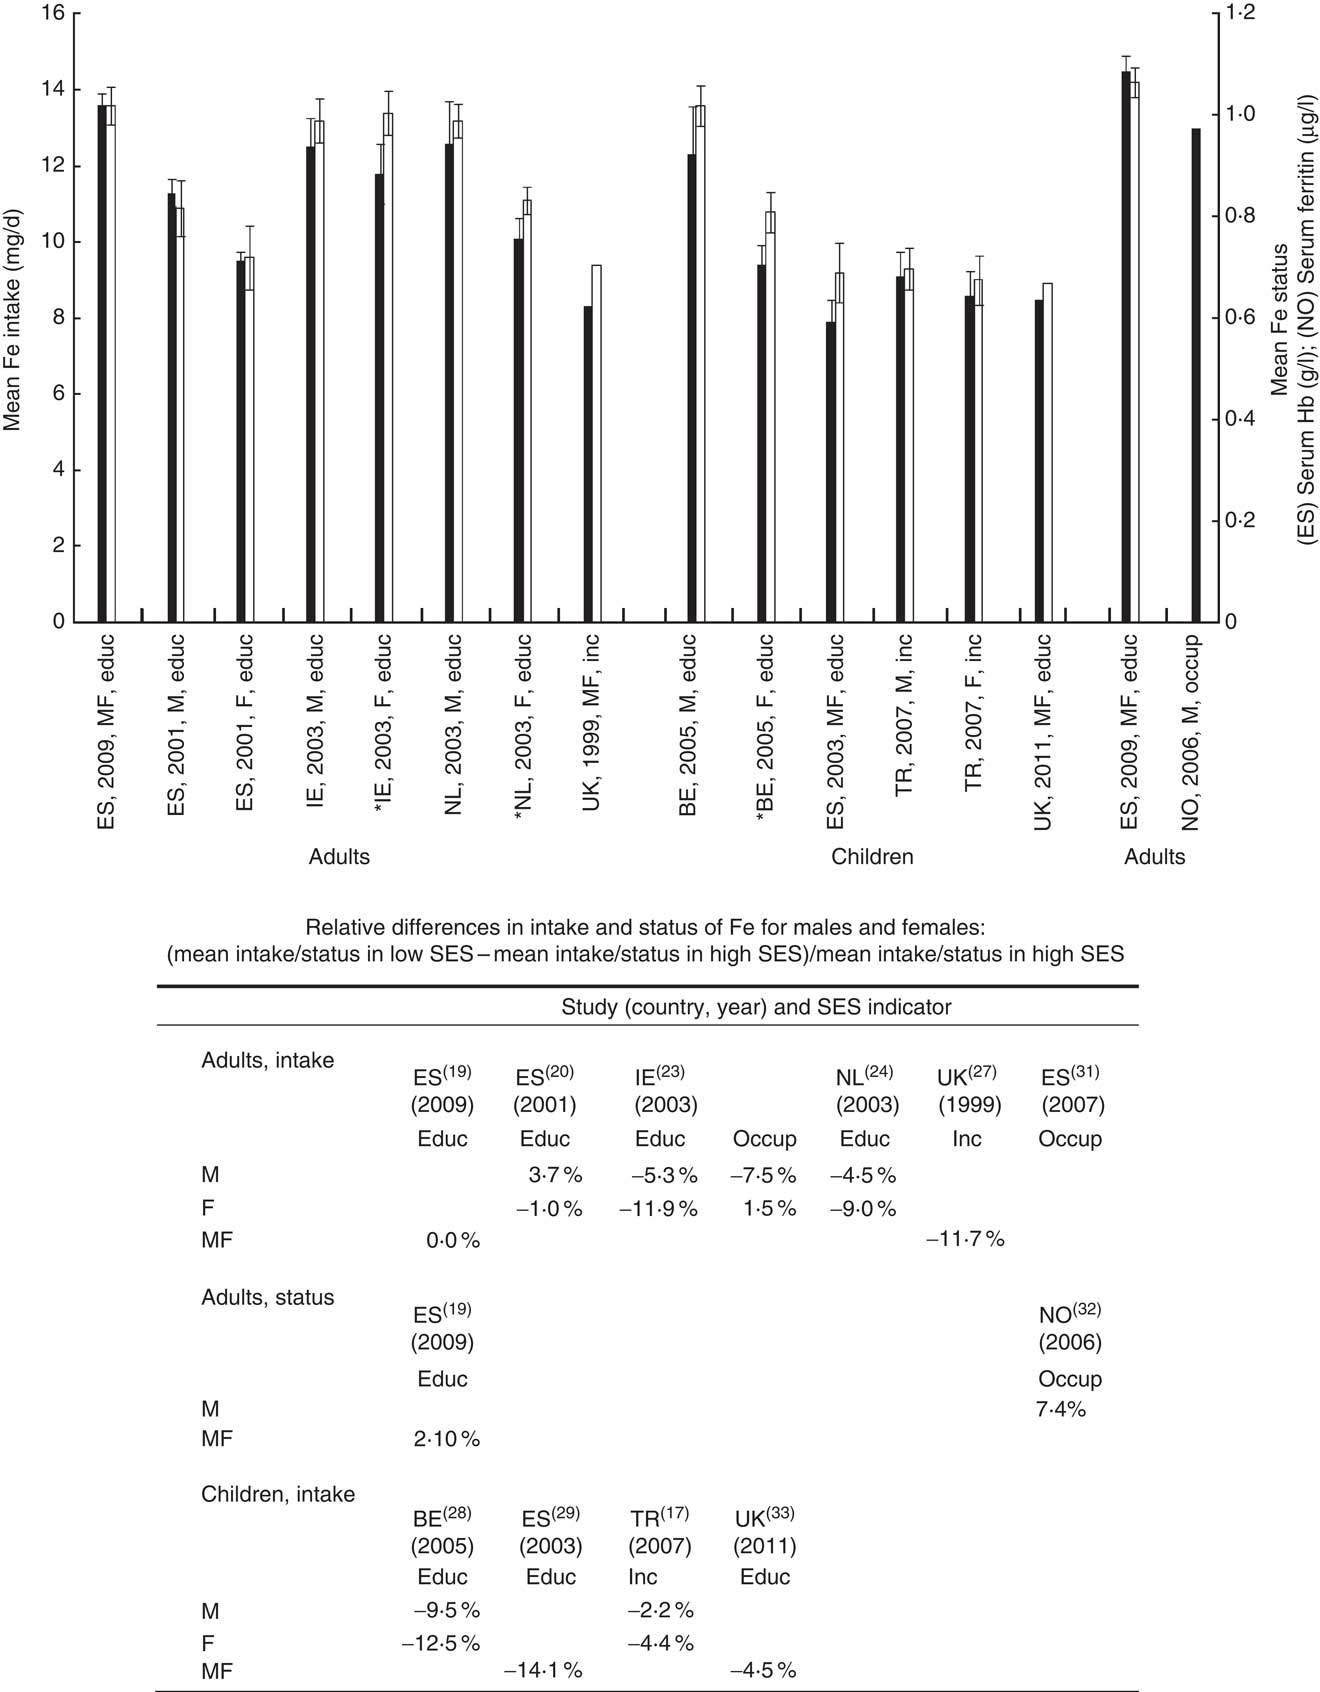
Mean iron intake and status (with 95 % confidence interval, where available, represented by vertical bars) of European adults/elderly and children (M, males; F, females; MF, males and females) in groups of lowest (▪) and highest (□) socio-economic status (SES) by different SES indicators (educ, education; occup, occupation; inc, income). * denotes a statistically significant difference (P < 0·05) in mean intake/status between the lowest and highest SES group. Countries with studies available: BE, Belgium; ES, Spain; IE, Ireland; NL, Netherlands; NO, Norway; TR, Turkey; UK, United Kingdom
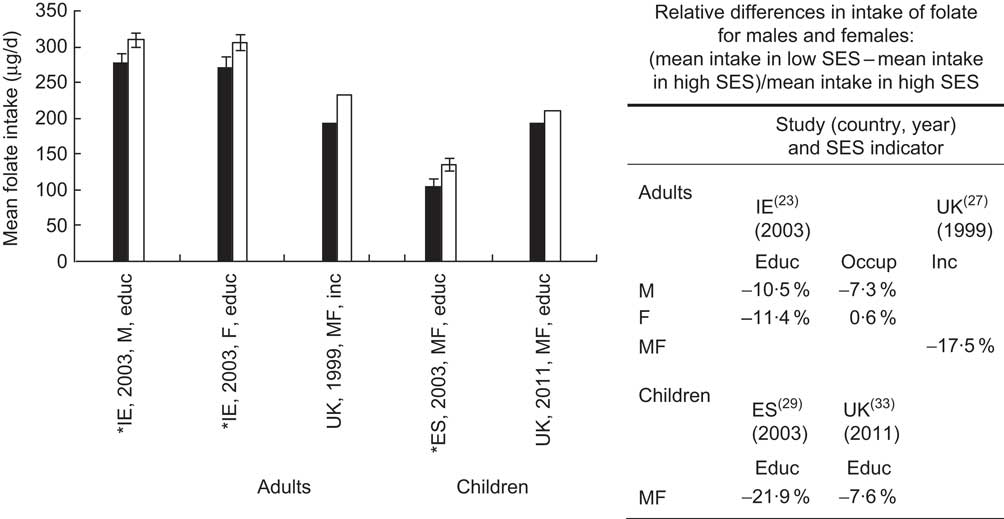
Mean folate intake (with 95 % confidence interval, where available, represented by vertical bars) of European adults/elderly and children (M, males; F, females; MF, males and females) in groups of lowest (▪) and highest (□) socio-economic status (SES) by different SES indicators (educ, education; occup, occupation; inc, income). * denotes a statistically significant difference (P < 0·05) in mean intake between the lowest and highest SES group. Countries with studies available: ES, Spain; IE, Ireland; UK, United Kingdom
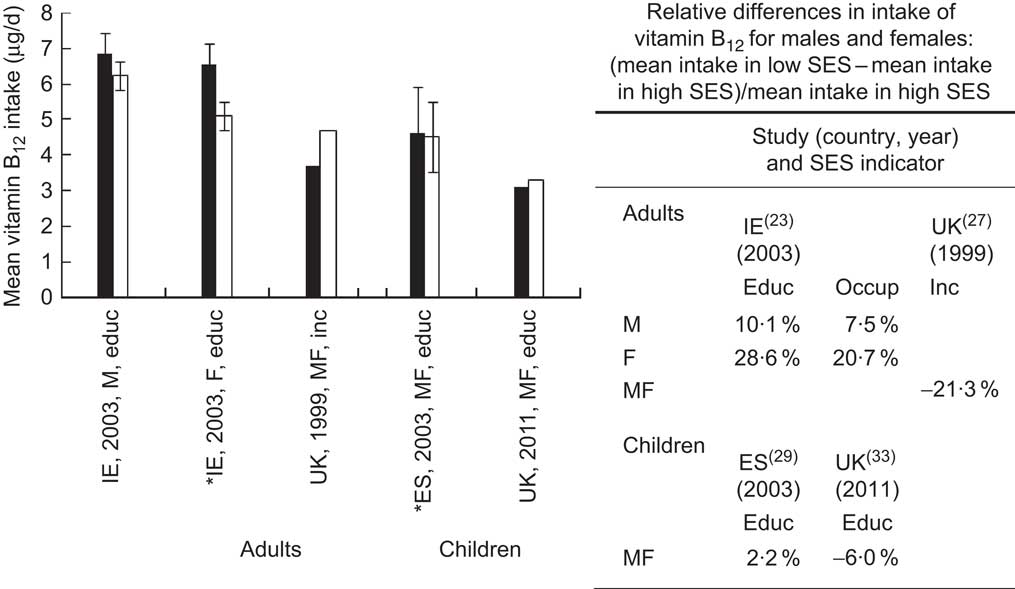
Mean vitamin B12 intake (with 95 % confidence interval, where available, represented by vertical bars) of European adults/elderly and children (M, males; F, females; MF, males and females) in groups of lowest (▪) and highest (□) socio-economic status (SES) by different SES indicators (educ, education; occup, occupation; inc, income). * denotes a statistically significant difference (P < 0·05) in mean intake between the lowest and highest SES group. Countries with studies available: ES, Spain; IE, Ireland; UK, United Kingdom
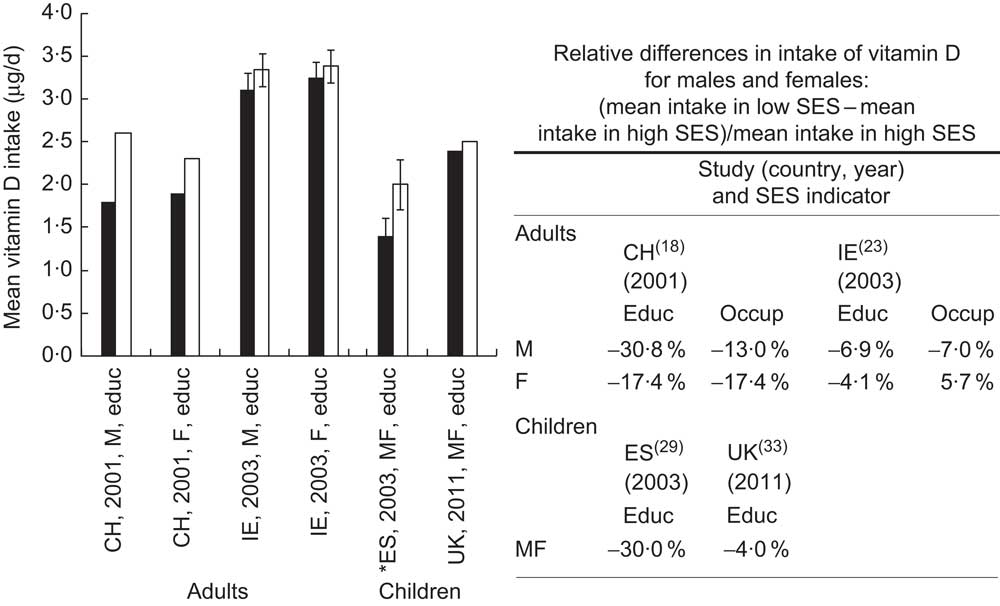
Mean vitamin D intake (with 95 % confidence interval, where available, represented by vertical bars) of European adults/elderly and children (M, males; F, females; MF, males and females) in groups of lowest (▪) and highest (□) socio-economic status (SES) by different SES indicators (educ, education; occup, occupation; inc, income). * denotes a statistically significant difference (P < 0·05) in mean intake between the lowest and highest SES group. Countries with studies available: CH, Switzerland; ES, Spain; IE, Ireland; UK, United Kingdom
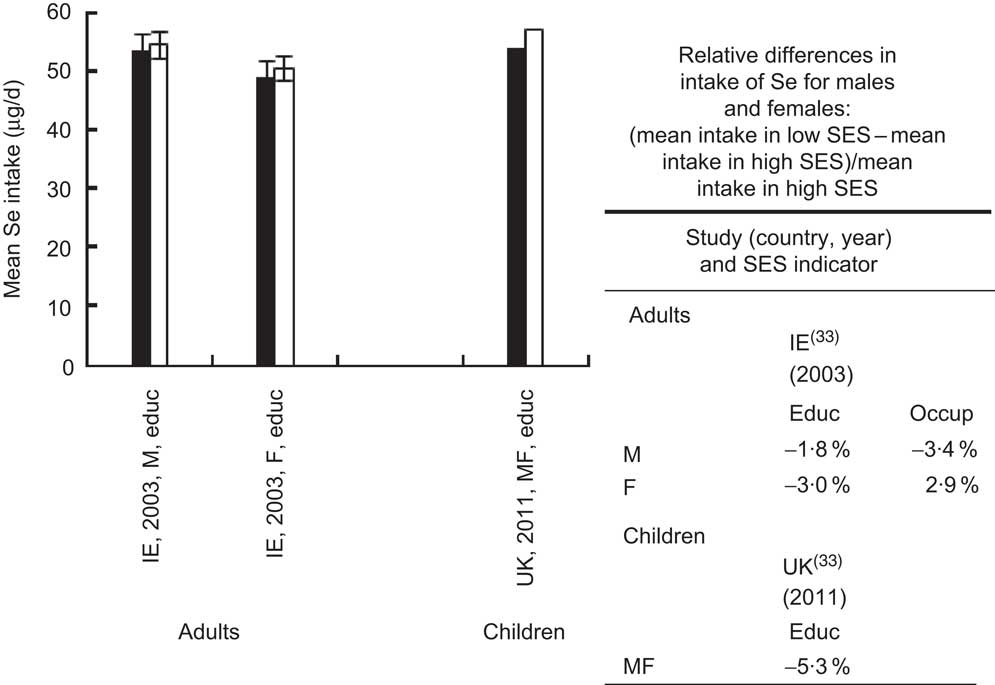
Mean selenium intake (with 95 % confidence interval, where available, represented by vertical bars) of European adults/elderly and children (M, males; F, females; MF, males and females) in groups of lowest (▪) and highest (□) socio-economic status (SES) by different SES indicators (educ, education; occup, occupation; inc, income). * denotes a statistically significant difference (P < 0·05) in mean intake between the lowest and highest SES group. Countries with studies available: IE, Ireland; UK, United Kingdom
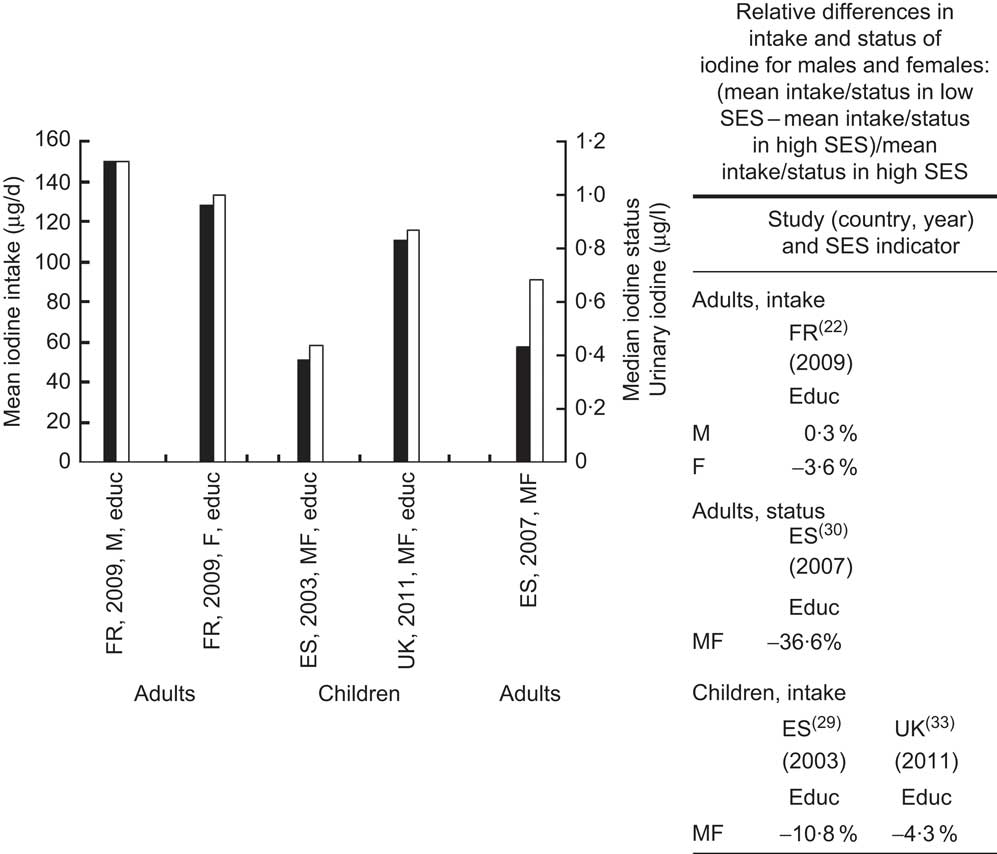
Mean iodine intake and status (with 95 % confidence interval, where available, represented by vertical bars) of European adults/elderly and children (M, males; F, females; MF, males and females) in groups of lowest (▪) and highest (□) socio-economic status (SES) by different SES indicators (educ, education; occup, occupation; inc, income). * denotes a statistically significant difference (P < 0·05) in mean intake between the lowest and highest SES group. Countries with studies available: ES, Spain; FR, France; UK, United Kingdom
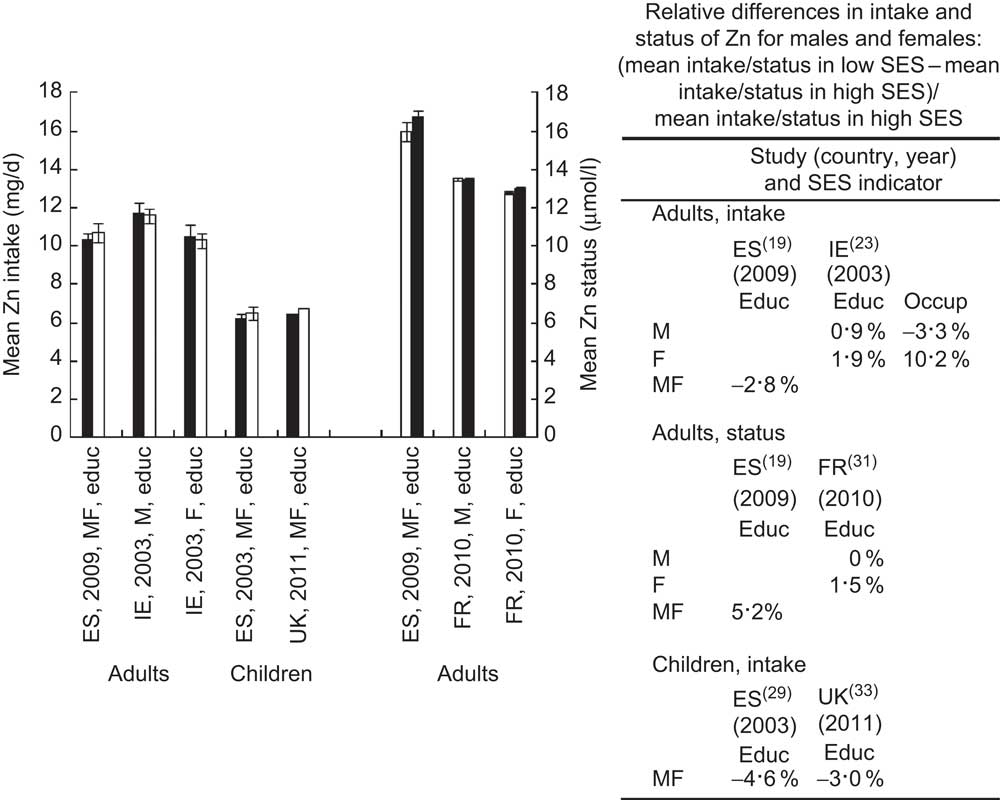
Mean zinc intake and status (with 95 % confidence interval, where available, represented by vertical bars) of European adults/elderly and children (M, males; F, females; MF, males and females) in groups of lowest (▪) and highest (□) socio-economic status (SES) by different SES indicators (educ, education; occup, occupation; inc, income). * denotes a statistically significant difference (P < 0·05) in mean intake between the lowest and highest SES group. Countries with studies available: ES, Spain; FR, France; IE, Ireland; UK, United Kingdom
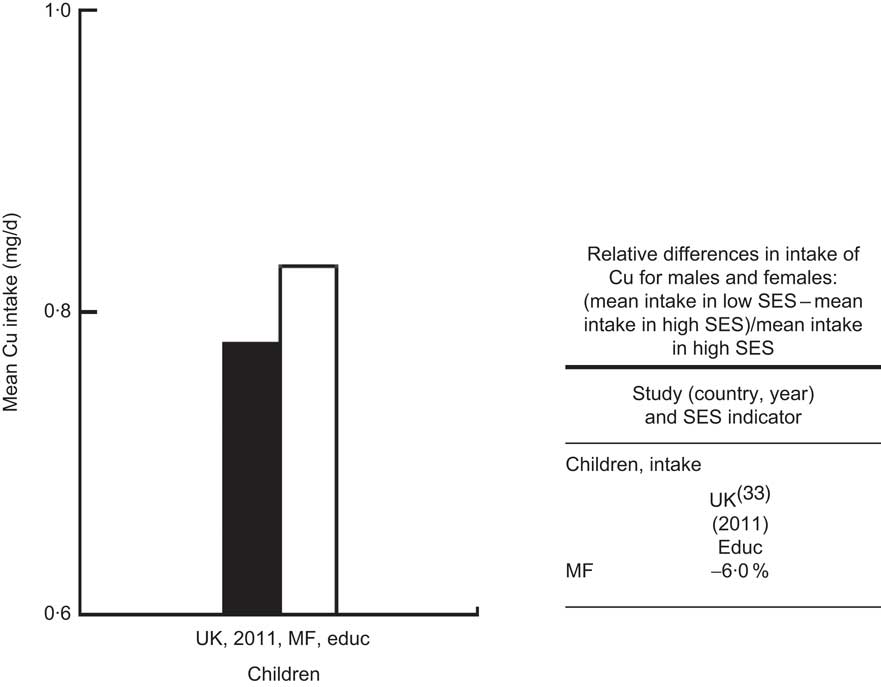
Mean copper intake (with 95 % confidence interval, where available, represented by vertical bars) of European adults/elderly and children (M, males; F, females; MF, males and females) in groups of lowest (▪) and highest (□) socio-economic status (SES) by different SES indicators (educ, education; occup, occupation; inc, income). * denotes a statistically significant difference (P < 0·05) in mean intake between the lowest and highest SES group. Countries with studies available: UK, United Kingdom
If more than one SES indicator was available in one study, we showed the level of intake/status for one indicator only, i.e. education was given the preference over occupation, and the latter was prioritized over income.
Results
The systematic search in MEDLINE and Embase resulted in 8460 abstracts in total. After screening on the basis of title and abstract, 230 potentially relevant references were identified: 132 on intake and ninety-eight on status. Retrieval of the full papers and their examination disqualified 212 articles mainly because they did not include an internal comparison of intake and/or status between different SES groups, e.g. manual workers v. non-manual in the same population group. The remaining eighteen studies included ten studies on intake, three studies on status and one on intake and status in adults, plus four studies on intake in children. Not a single study on status in children was found.
Table 1 gives an overview of data availability per country and study characteristics( Reference James, Nelson and Ralph 2 , Reference Manios, Moschonis and Kolotourou 17 – Reference Cribb, Jones and Rogers 33 ).
Characteristics of the study populations, methodology and description of the socio-economic determinants
CH, Switzerland; ES, Spain; FI, Finland; FR, France; IE, Ireland; NL, Netherlands; SCT, Scotland; UK, United Kingdom; BE, Belgium; TR, Turkey; NO, Norway; SU.VI.MAX, SUpplementation en VItamines et Minéraux AntioXydants; SES, socio-economic status; DNFCS, Dutch National Food Consumption Survey; SHHS, Scottish Heart Health Study; ALSPAC, Avon Longitudinal Study of Parents and Children; M, males; F, females; MF, males and females; FR, food record; DR, dietary record.
Most data available were for adults, studying the relationship between vitamin C or Ca intake and education, occupation or income. No single study was found on intake of Cu in adults. Data on biochemical indices of status were very limited and available for adults only: for Fe and Zn only two studies were found per micronutrient, and for iodine status one study was found. The studies included for analysis were performed either in Western Europe or Scandinavia with the exception of one study from Eastern Europe( Reference Manios, Moschonis and Kolotourou 17 ). Figures 1–10 show the mean/median intake and status level (with 95 % confidence interval of the mean where available) in lowest and highest SES groups in adults/elderly and children. Following each figure, the relative differences between SES groups for intake/status per micronutrient are presented.
Calcium
Number of studies identified: ten studies on intake (Fig. 1).
From six studies on Ca intake in adults, the mean Ca intake in the lowest SES groups was lower than in high-SES groups except for males from Spain( Reference Lasheras, Patterson and Casado 20 ) and males( Reference van Rossum, van de and Witteman 25 ) and females( Reference Hulshof, Brussaard and Kruizinga 24 , Reference van Rossum, van de and Witteman 25 ) from the Netherlands. The relative difference ranged from 2 % in Swiss females( Reference Galobardes, Morabia and Bernstein 18 ) to 14 % in UK elderly( Reference Bates, Prentice and Cole 27 ). Results on children were more heterogeneous. Higher Ca intake in low SES as compared with high SES was found in Belgian boys( Reference Matthys, De and Maes 28 ) and in Turkey( Reference Manios, Moschonis and Kolotourou 17 ): relative differences were 1 % and 19–54 %, respectively. Belgian girls and the children from Spain( Reference Navia, Ortega and Requejo 29 ) and the UK( Reference Cribb, Jones and Rogers 33 ) had higher intake in the high-SES groups: the relative difference ranged from 3 % to 29 %. Statistically significant differences in Ca intake between SES groups were observed in Irish females( Reference Friel, Kelleher and Nolan 23 ) and Belgian girls( Reference Matthys, De and Maes 28 ) (P < 0·01).
Vitamin C
Number of studies identified: twelve studies on intake (Fig. 2).
Eight studies on vitamin C intake in adults reported lower mean intake in low-SES groups in comparison to high SES, except in studies in Dutch females( Reference Hulshof, Brussaard and Kruizinga 24 , Reference van Rossum, van de and Witteman 25 ) and Spanish males( Reference Lasheras, Patterson and Casado 20 ) where relative differences ranged from 3 % to 8 %. In other studies where higher intake was found in high SES in comparison to low SES, the relative difference was lowest in the Dutch males( Reference van Rossum, van de and Witteman 25 ) (5 %), whereas in the other six studies( Reference James, Nelson and Ralph 2 , Reference Lasheras, Patterson and Casado 20 , Reference Roos, Prattala and Lahelma 21 , Reference van Rossum, van de and Witteman 25 – Reference Bates, Prentice and Cole 27 ) it ranged from 10 % to 48 %, the largest difference being found in the UK( Reference Bates, Prentice and Cole 27 ) for intake by income.
Four studies on vitamin C intake in children showed lower mean intake in low-SES groups in comparison to high SES, except in Belgian boys( Reference Matthys, De and Maes 28 ) where the relative difference between SES groups was 12 %. In other studies where lower mean intake in low-SES groups in comparison to high SES was reported, relative differences ranged from 6 % in Turkish boys( Reference Galobardes, Morabia and Bernstein 18 ) up to 33 % for Spanish children( Reference Navia, Ortega and Requejo 29 ).
Statistically significant differences between SES groups were found in studies from Finland( Reference Roos, Prattala and Lahelma 21 ), Ireland( Reference Friel, Kelleher and Nolan 23 ) and Scotland( Reference Bolton-Smith, Smith and Woodward 26 ) for adults and in the study from Spain( Reference Navia, Ortega and Requejo 29 ) for children (P < 0·01).
Iron
Number of studies identified: nine studies on intake, two studies on status (Fig. 3).
Four( Reference Lasheras, Patterson and Casado 20 , Reference Friel, Kelleher and Nolan 23 , Reference Hulshof, Brussaard and Kruizinga 24 , Reference Bates, Prentice and Cole 27 ) out of five studies on Fe intake in adults reported lower intake in low-SES than in high-SES groups (relative differences ranged from 1 % to 12 %), whereas one study from Spain( Reference Roos, Prattala and Lahelma 21 ) reported no difference between SES groups. In children, reported intake was consistently lower in low SES than in high SES (relative differences in the range 2–14 %).
Data on Fe status were available only for adults and showed higher values in low SES than in high SES: relative differences were 2 % and 7 % for Spain( Reference Roos, Prattala and Lahelma 21 ) and Norway( Reference Broderstad, Smith-Sivertsen and Dahl 32 ), respectively.
Significant differences in intake/status between SES groups were found in Dutch( Reference Hulshof, Brussaard and Kruizinga 24 ) and Irish( Reference Friel, Kelleher and Nolan 23 ) females and Belgian girls( Reference Matthys, De and Maes 28 ) (P < 0·01).
Folate, vitamin B12, vitamin D, selenium, iodine, zinc, copper
Number of studies identified: folate, vitamin B12 and vitamin D = four studies on intake per each micronutrient (Figs 4–6, respectively); Se = two studies on intake (Fig. 7); iodine = three studies on intake, one study on status (Fig. 8); Zn = four studies on intake, two studies on status (Fig. 9); Cu = one study on intake (Fig. 10).
The two studies available on folate intake in adults( Reference Friel, Kelleher and Nolan 23 , Reference Bates, Prentice and Cole 27 ) and two for children( Reference Navia, Ortega and Requejo 29 , Reference Cribb, Jones and Rogers 33 ) reported lower intake in low SES compared with the high-SES group (relative differences ranged from 7 % to 22 %). The Irish study in adults and the Spanish study in children, both studying folate intake by educational level, reported significant differences between SES groups (P < 0·01).
For vitamin B12 four studies were found. The two studies from the UK for the elderly( Reference Bates, Prentice and Cole 27 ) and children( Reference Cribb, Jones and Rogers 33 ) showed higher intake in high-SES than in low-SES groups with the relative difference in intake of 6–21 %. In contrast, the study in Irish adults( Reference Friel, Kelleher and Nolan 23 ) and the study in Spanish children( Reference Navia, Ortega and Requejo 29 ) found higher mean intakes in low-SES groups than in high SES: relative differences were 8–29 % and 2 %, respectively. The difference in intake by education between SES groups in the Irish study was statistically significantly different (P < 0·01).
Results for vitamin D that come from four studies showed consistently lower intakes for the low-SES group. In adults, relative differences were more apparent in Switzerland( Reference Galobardes, Morabia and Bernstein 18 ) (13–31 %) than in Ireland( Reference Friel, Kelleher and Nolan 23 ) (4–7 %). In children, relative differences in intake between high- and low-SES groups were 4 % in the UK( Reference Cribb, Jones and Rogers 33 ) and 30 % in Spain( Reference Navia, Ortega and Requejo 29 ), with a statistically significant difference observed in the latter study (P < 0·05).
Data on Se, which were reported in one study among Irish adults( Reference Friel, Kelleher and Nolan 23 ) and one study in UK children( Reference Cribb, Jones and Rogers 33 ), showed a slightly lower mean intake in the low-SES group (relative differences 2–5 %).
The only study on iodine intake in adults showed no difference in intake in males and a slightly lower intake (relative difference 4 %) in the low-SES group in females in France( Reference Valeix, Faure and Peneau 22 ). For children, two studies were found and they reported lower intake in the low-SES groups than in high SES: relative differences were 4 % and 11 % for the UK( Reference Cribb, Jones and Rogers 33 ) and Spain( Reference Navia, Ortega and Requejo 29 ), respectively. Data on iodine status were identified only for Spanish adults( Reference Rego-Iraeta, Perez-Fdez and Cadarso-Suarez 30 ): the median urinary iodine level in the low-SES group was lower than in the high-SES group; the relative difference between the two SES groups was 37 %.
Three( Reference Sanchez, Lopez-Jurado and Planells 19 , Reference Navia, Ortega and Requejo 29 , Reference Cribb, Jones and Rogers 33 ) out of four studies on intake of Zn for adults, the elderly and children showed somewhat lower intake in low SES than in the high-SES groups (relative difference ∼3 %). The Irish study( Reference Friel, Kelleher and Nolan 23 ) showed inconsistent results on variation in intake between SES groups, depending on gender and SES indicator. Zn status data were available only for adults: the two studies( Reference Sanchez, Lopez-Jurado and Planells 19 , Reference Arnaud, Touvier and Galan 31 ) that were found showed 2–5 % higher serum Zn level in the low-SES group in comparison to high SES.
The only study on intake of Cu was in children in the UK( Reference Cribb, Jones and Rogers 33 ); the intake was higher in the low-SES group than in the high-SES group (relative difference was 6 %).
Of the eighteen studies, ten studies used education as an indicator of SES, three applied income and two occupational criteria; three studies used more than one indicator.
Reviewing the results of the different indicators showed that education (especially in females) and income were associated with the largest variations in intake.
Discussion
The present study is the first systematic review addressing differences in levels of micronutrient intake and status between low and high socio-economic groups in European children, adults and elderly using education, occupation and income as indicators of SES. The results support our hypothesis that social variations are associated with differences in intake and status of certain micronutrients.
The review included all age groups and differences in intake/status were studied separately for each gender where applicable. The subjects were recruited either by stratified random sampling procedures or were representative of the national population, and as such can be considered as exemplary for their countries (Table 1). As one of the outcomes of the systematic review process is observed diversity in study characteristics, there are several aspects to consider in the interpretation of the results. First, the studies differed in the exact categorization and number of groups used for the three SES indicators: for education studies defined two to four groups, for occupation two or three, and for income two to four groups were specified. The size of the absolute and relative differences may be affected by the exact definition of the low- and high-SES groups. Being aware of the inherent differences among studies and after their careful investigation, we made the decision to integrate the results by taking into account both those differences and the same methodological backbone across studies; i.e. a variation between SES groups. The comparisons are made between only two groups, by choosing extreme groups or broad groups( Reference Kunst, Bos and Mackenbach 14 ). Thus, comparing broad SES groups rather than the outer groups in society may result in an underestimation of existing differences. Another aspect to consider is the impact of the dietary intake method on observed differences in intake. The dietary intake methods used in the identified studies were heterogeneous: FFQ, 24 h recall, food record; also, the intake from supplements was included only in three studies( Reference Bates, Prentice and Cole 27 , Reference Rego-Iraeta, Perez-Fdez and Cadarso-Suarez 30 , Reference Cribb, Jones and Rogers 33 ), all of which could contribute to variation in reported mean nutrient intakes. These diverse methods may vary in the extent to which they reflect true usual intake of micronutrients as some of these methods, e.g. non-validated FFQ and diet recorded for less than 3 d, are generally considered inappropriate to estimate a population's usual dietary intake. This is of importance when estimating the prevalence of inadequacy (comparison of absolute mean intake/status levels with reference values). On the other hand, this is less significant for the aim of the present study, i.e. for observing the variation between SES groups per study as we focused on differences within studies. However, as mentioned in certain publications on socio-economic differences in food consumption, we acknowledge the potential for misreporting of micronutrient intake for subjects with higher educational levels as they may be more conscious of nutrition and health issues and possibly exaggerate the consumption of healthy foods, e.g. fruit and vegetables, thus giving rise to elevated mean vitamin and mineral intake levels( Reference Trichopoulou, Naska and Costacou 7 , Reference Macdiarmid and Blundell 34 ). The issue of reporting errors does not affect the results on micronutrient status; therefore, the information on Fe, Zn and iodine status strengthens the evidence from the observed differences between intake for low and high SES.
Results of the systematic literature search showed that studies on micronutrient intake and/or status associated with SES indicators for children from all European countries and for children, adults and elderly from Central and Eastern Europe (CEE) are very limited. For example, our review included data for Western European populations with the exception of one study on children from Turkey( Reference Manios, Moschonis and Kolotourou 17 ). Inclusion of studies from other parts of Europe such as CEE is needed to draw a pan-European conclusion on variations in micronutrient intake/status between groups of different education, occupation and income levels. It is disputable whether similar results would be found for CEE because of the widely divergent socio-economic position within these countries: larger social inequalities, diversity in food costs and availability, etc. A recent publication that compared micronutrient intake/status in CEE with other European regions showed no striking differences, with the exception of Ca( Reference Novakovic, Cavelaars and Bekkering 35 ). More research is needed, however, to fill this gap in available evidence. An explanation for the limited studies we identified throughout Europe is that we focused on the electronic databases MEDLINE and Embase only. This is of particular importance for CEE, as it has been shown that reliable nutritional data from these countries can be found as grey literature: country reports of governmental or academic institutions, theses and dissertations( Reference Novakovic, Cavelaars and Bekkering 35 ). Their inclusion was not feasible however, due to the large number of languages to cover. Nevertheless, it is apparent that even though the relationship between socio-economic position and diet has been notably studied in the last few decades, current evidence from key databases is still lacking data on SES-related micronutrient intake and/or status for many European countries and particularly for children and the elderly.
Existing reviews in Europe have not addressed the association between multiple socio-economic indicators and intake and/or status of more than one micronutrient. The largest study( Reference Olsen, Halkjaer and van Gils 36 ) to date which described intake of five water-soluble vitamins across several European countries reported the association between education and intake: it was positive for the intake of riboflavin, vitamin C, vitamin B6 (in women) and no clear conclusion emerged for vitamin B12. These results are in accordance with the findings for vitamins B12 and C from the present study.
Still, there is a body of evidence on disparities in food habits in association with SES indicators. A review on consumption of fruit and vegetables in fifteen European countries reported lower consumption in low-SES in comparison to high-SES groups( Reference Irala-Estevez, Groth and Johansson 9 ); the same was observed in nine European countries for the consumption of cheese, but not for milk( Reference Sanchez-Villegas, Martinez and Prattala 10 ). These findings support the results on vitamin C and Ca from our study. To estimate if similar results could be found for other vitamins and minerals under study, we examined studies evaluating the variation in intake of nutrient-rich healthy foods in groups with different socio-economic backgrounds. Likewise, whole grains, lean meats, fish, low-fat dairy products and fresh vegetables and fruit were found to be preferably consumed by high-SES groups( Reference Darmon and Drewnowski 1 ). The most recent study on the relationship between SES and frequency of consumption of seven predefined healthy foods (consumption of fruit, vegetables, wholegrain bread, vegetable-fat spread, vegetable cooking fat, low-fat milk and low-fat cheese) in CEE and Western Europe reported healthier food choices among those with higher education, occupational position and fewer economic difficulties, as well as heterogeneity in the association between SES and healthy food habits across countries( Reference Boylan, Lallukka and Lahelma 6 ). The present study suggests that the differences are the most apparent in SES groups of different educational background, especially in females. On the other hand, Table 1 shows that for both intake and status for all age groups, it is education that is the most studied indicator: ten studies on education, two studies on education and occupation, one study on education and income, two studies on occupation and three on income. Where studies reported on intake by two indicators( Reference Galobardes, Morabia and Bernstein 18 , Reference Roos, Prattala and Lahelma 21 , Reference Friel, Kelleher and Nolan 23 ), the relative differences between SES groups observed for education were confirmed for occupation( Reference Galobardes, Morabia and Bernstein 18 , Reference Friel, Kelleher and Nolan 23 ) and income( Reference Roos, Prattala and Lahelma 21 ), but the variation for the latter two indicators was lower than for intake by education.
The more pronounced effect of education on variation in intake/status in comparison to occupation and income may be due to the fact that the level of education is considered to remain rather stable through the life course( Reference Salonen, Kajantie and Osmond 37 ). Furthermore, the education attained in early life is not only a determinant of occupation and income, but also affects the ability to understand and implement dietary guidance messages and risk-reducing dietary behaviours( Reference Kant and Graubard 38 ). Despite the studies in the present review using different procedures in assessing SES, most methods have the same underlying principle: difference in micronutrient intake/status between SES groups. To the extent that similar principles are indeed addressed, the heterogeneity of results between different studies might be a reflection of these methodological shortcomings; but as long as no clear gold standard is available, the pooling of results in the way we have done is the best possible option. On the other hand, the presence of dissimilarities in SES categorization among studies can have advantages by increasing the generalization of the conclusion( Reference Walker, Hernandez and Kattan 39 ) that there is, in most cases, a positive association observed between all SES indicators under study and micronutrient intake and/or status.
To support policy makers to develop targeted nutritional policies to reduce the risk of diet-related diseases among disadvantaged populations in Europe, a comprehensive overview of nutritional intake and status across different socio-economic strata is needed. However, the current review showed that, contrary to the large body of evidence on socio-economic inequalities in health, very few data on socio-economic differences in micronutrient intake and status are available in the scientific literature. This applies to the whole of Europe and for all age groups, but especially to CEE countries and to children, adolescents and the elderly.
Conclusion
When intake and/or status of priority micronutrients (folate, vitamin B12, Fe, Zn and iodine for intake and status; vitamin C, vitamin D, Ca, Se and Cu for intake) is compared between low- and high-SES groups, lower values for all micronutrients (except vitamin B12) are found in the low SES category. The largest relative differences between SES groups are observed for intake of Ca, vitamin C, folate and vitamin D (2–29 %, 5–47 %, 7–22 % and 4–31 %, respectively), although the data for the latter two were fewer than for the former two nutrients. The results presented in the current review stem from analysis of the original studies as from 1990 up to November 2011. Current evidence suggests that there are inadequate micronutrient intakes in Europe( Reference Roman-Vinas, Ribas-Barba and Ngo 3 ). Since the relationship between SES and health is dynamic and evolves throughout the life course( Reference Ovrum, Gustavsen and Rickertsen 40 ), it should be regarded that the observed changes in SES inequalities in micronutrient intake and status should be monitored over time. This can be realized via analyses of high-quality nutritional data with EU coverage that apply comparable measures of SES (e.g. from the HELENA (Healthy Lifestyle in Europe by Nutrition in Adolescence) Study and/or EPIC (European Prospective Investigation into Cancer and Nutrition)) or via the inclusion of comparable socio-economic determinants and measures in currently running and forecasted nutritional surveillance programmes.
Acknowledgements
Sources of funding: The work reported herein has been carried out within the EURRECA Network of Excellence (http://www.eurreca.org), which is financially supported by the Commission of the European Communities, specific Research, Technology and Development (RTD) Programme Quality of Life and Management of Living Resources, within the Sixth Framework Programme, project no. FP6 036196-2. This report does not necessarily reflect the Commission's views or its future policy in this area. This work was in part funded by the Ministry of Education and Science of the Republic of Serbia, project III 41030. Conflicts of interest: The authors have no conflicts of interest. Ethics: No ethical approval was required for this study. Authorship responsibilities: R.N. conceptualised the paper, collected the data and drafted the manuscript. A.C. and A.G. supervised the overall work and assisted with analysis and editing of the manuscript. M.N., I.I.A., B.R.V., J.N., M. Golsorhki, M.W.M., A.B., A.S., D.d.C., G.V. and M.R. were involved in data collection, reviewing the literature and analysis. L.S.M., L.A.M., M. Glibetić, M. Gurinović, P.v.V. and L.C.P.G.M.d.G. were involved in development of the study hypothesis, editing the working versions of the manuscript and provided advice regarding interpretation of the results.


