


Introduction
Crops are threatened globally by pests, most prominently by weeds, which are responsible for 34% of the crop damage (Oerke Reference Oerke2006). Soybean is most threatened by the widespread occurrence of broadleaf weeds resistant to acetolactate synthase (ALS) inhibitors, protoporphyrinogen oxidase inhibitors, and glyphosate. The development of soybean transgenes that confer resistance to alternative herbicide sites of action (SOAs) has been one strategy used to overcome the threat of herbicide resistant weeds. The development of aryloxyalkanaoate dioxygenases (AADs) transgenes in soybean confers resistance to 2,4-D in soybean (Wright et al. Reference Wright, Shan, Walsh, Lira, Cui, Song, Zhuang, Arnold, Lin, Yau, Russel, Cicchilo, Peterson, Simpson, Zhou, Ponsamuel and Zhang2010). Soybean varieties containing the AADs transgene are commercially marketed as Enlist E3® (Corteva Agrisciences, Indianapolis, IN), which also contains transgenes that confer resistance to glyphosate and glufosinate. The development of Enlist E3® soybean allows for 2,4-D, glyphosate, and glufosinate to be safely sprayed on soybean to selectively control grass and broadleaf weeds within the crop.
The commercial release of Enlist E3® soybean has provided soybean producers with the ability to control glyphosate-resistant weeds with either 2,4-D or glufosinate. Synthetic auxins such as 2,4-D have been used for more than 75 yr to control broadleaf weeds in fallow areas and grass crops such as rice, small grains, and corn (Blackman Reference Blackman1945). The synthetic auxin SOA is classified by the Weed Science Society of America (WSSA) as a group 4 herbicide (Shaner Reference Shaner2014). Another crop trait technology commercialized in the last 5 yr that contains resistance to group 4 herbicides is the Xtend® (Bayer Cropsciences, Creve Coeur, MO) technology that confers soybean resistance to dicamba. Both the Enlist E3® and Xtend® technology platforms have been widely adopted across soybean growing regions to control problematic weeds since their commercial release.
The introduction and adoption of both the Enlist E3® and Xtend® soybean platforms has brought a change in weed management practices within soybean. Changes in crop management practices such as herbicide application, tillage, and crop rotation often result in shifts in weed species composition (Blackshaw et al. Reference Blackshaw, Larney, Lindwall, Watson and Derksen2001; Buhler Reference Buhler1995; Davis et al. Reference Davis, Gibson, Bauman, Weller and Johnson2009; Thomas et al. Reference Thomas, Derksen, Blackshaw, Van, Légère, Watson and Turnbull2004), especially when new methods of weed control are implemented. Heard et al. (Reference Heard, Hawes, Champion, Clark, Firbank, Haughton, Parish, Perry, Rothery, Roy, Scott, Skellern, Squire and Hill2003) showed that emergence, survival, reproductive rate, and the seedbank of weed populations were affected by the implementation of herbicide-resistant beet (subspecies of Beta vulgaris L.) and oilseed rape (Brassica napus L.) and use of herbicide applications enabled by these herbicide-tolerant crops. The introduction of new weed management techniques to any production system will alter the weed community based on the life stage transition that is impacted by the new control method. Hume et al. (Reference Hume, Tessier and Dyck1991) observed that when tillage was reduced, foxtail barley (Hordeum jubatum L.) became the dominant species within a wheat cropping system.
A shift of weed species requires both selection pressure and inherent variation within a population (Stebbins Reference Stebbins1999). A major shift in weed communities was noted when glyphosate-resistant crops were introduced (Johnson et al. Reference Johnson, Davis, Kruger and Weller2009). Widespread glyphosate use throughout the United States acting as the selection pressure combined with several weed species with high levels of genetic variation resulted in a shift in the weed community toward glyphosate-resistant weed biotypes, of which 17 unique weeds are resistant to glyphosate in the United States alone (Benbrook Reference Benbrook2012; Gasquez Reference Gasquez1997; Heap Reference Heap2020; Johnson et al. Reference Johnson, Davis, Kruger and Weller2009). More recently, Hodgskiss et al. (Reference Hodgskiss, Legleiter, Young and Johnson2020) reported that in a long-term field study after several years, the dicamba-reliant strategy had a 43% higher total weed density than all other treatments, primarily from a monocot density that was at least 71% greater than the other treatments.
With 2,4-D as a new postemergence (POST) herbicide to be used in soybean, it is likely that 2,4-D, in combination with glyphosate or glufosinate, will be an important component to most POST herbicide applications in Enlist E3®soybean. Currently, 25 weeds have developed resistance to 2,4-D (Heap Reference Heap2020). The number of 2,4-D-resistant weed species and areas infested are likely to increase due to an increase in acreage planted with 2,4-D-resistant soybean and associated POST use of 2,4-D. If other SOAs are not used in herbicide programs a shift toward species becoming tolerant to 2,4-D is likely, as was predicted when glyphosate-resistant crops were increasing in acreage (Young Reference Young2006).
Diversified weed management strategies such as the use of multiple herbicide SOAs are necessary to prevent shifts to more problematic weed species. A challenge in promoting the use of more than two SOAs is that 2,4-D and glyphosate can provide control of several key weed species without any additional SOAs at a relatively low cost. Miller and Norsworthy (Reference Miller and Norsworthy2016) reported that applications of 2,4-D in combination with glyphosate was sufficient for controlling both glyphosate-resistant and -susceptible Palmer amaranth (Amaranthus palmeri S. Watson). Robinson et al. (Reference Robinson, Simpson and Johnson2012) showed that applications of 2,4-D in combination with glyphosate provided 97% control of velvetleaf (Abutilon theophrasti Medik), waterhemp [Amaranthus tuberculatus (Moq.) J. D. Sauer], and common lambsquarters (Chenopodium album L.). Therefore, the addition of 2,4-D as an SOA in soybean cropping systems can be a valuable tool in weed management due to enhanced control of these problematic weed species.
Information on the potential effects that 2,4-D-resistant soybean will have on weed communities is not currently available. As interest in using 2,4-D-resistant soybean increases, it will be vital that this information is obtained to aid farm operators in making effective and sustainable weed management decisions. The objectives of this research were to determine whether the use of Enlist E3® soybean and the progressive reliance on 2,4-D for weed management in a corn and soybean rotation would 1) influence shifts in the weed community both for weed density and species richness parameters, 2) alter the composition of monocot and dicot species in the weed community, and 3) alter the extent of weed management as measured by crop yield.
Materials and Methods
Field Site
A long-term experiment was conducted at the Throckmorton Purdue Agriculture Center (TPAC; 40.30°N, 86.90°W) for seven consecutive years (2013 to 2019). The TPAC location soils consist predominantly of a Toronto-Millbrook silty clay loam complex, pH 6.1, 2.6% soil organic matter (SOM), and a cation exchange capacity (CEC) of 10.6 meq 100 g−1. The site received fall or spring primary tillage with a chisel plow. Secondary tillage was conducted with a field cultivator immediately prior to spring planting. Soil fertility programs were adjusted for each year and used recommendations for optimal crop yield in the region. Initiated in 2013, corn (Zea mays L.) with resistance to both glyphosate and glufosinate was planted in alternating years (2013, 2015, 2017, and 2019), and 2,4-D-resistant (Enlist E3®) soybean was planted in rotation (2014, 2016, and 2018). Corn was planted at 80,000 seeds per hectare, whereas the soybean seeding rate was 350,000 seeds per hectare. Prior to experiment establishment, the predominant weed species were giant foxtail (Setaria faberi Herrm.), fall panicum (Panicum dichotomiflorum Michx.), giant ragweed (Ambrosia trifida L.), redroot pigweed (Amaranthus retroflexus L.), and ivyleaf morningglory (Ipomoea hederacea Jacq.). Herbicide strategies were designed to target these species.
The experimental design was a randomized complete block with six replications. Plots were 6 m wide and 15 m in length and consisted of eight crop rows spaced 76 cm apart. Field trial corners were marked using global positioning systems to ensure that treatment locations were consistent from year to year. Within a corn-soybean rotation, four herbicide strategies were developed as 2,4-D reliant, diversified glyphosate, diversified 2,4-D, and fully diversified, each of which had three, six, seven, and eight SOAs, respectively (Tables 1 and 2). Herbicides were applied with a CO2-propelled 3-m backpack sprayer traveling at 4.8 km h−1 and AIXR110015 nozzles (Teejet Technologies, Springfield, IL). Herbicide strategies were specifically designed to be effective on the major weed species infesting the field site. Preemergence (PRE) herbicides were applied near planting. POST herbicides were applied in early summer when weeds were 10 to 15 cm tall in both corn and soybean, or when corn reached 75 cm in height, whichever occurred first.
Herbicide strategies used in both corn and soybean years. a
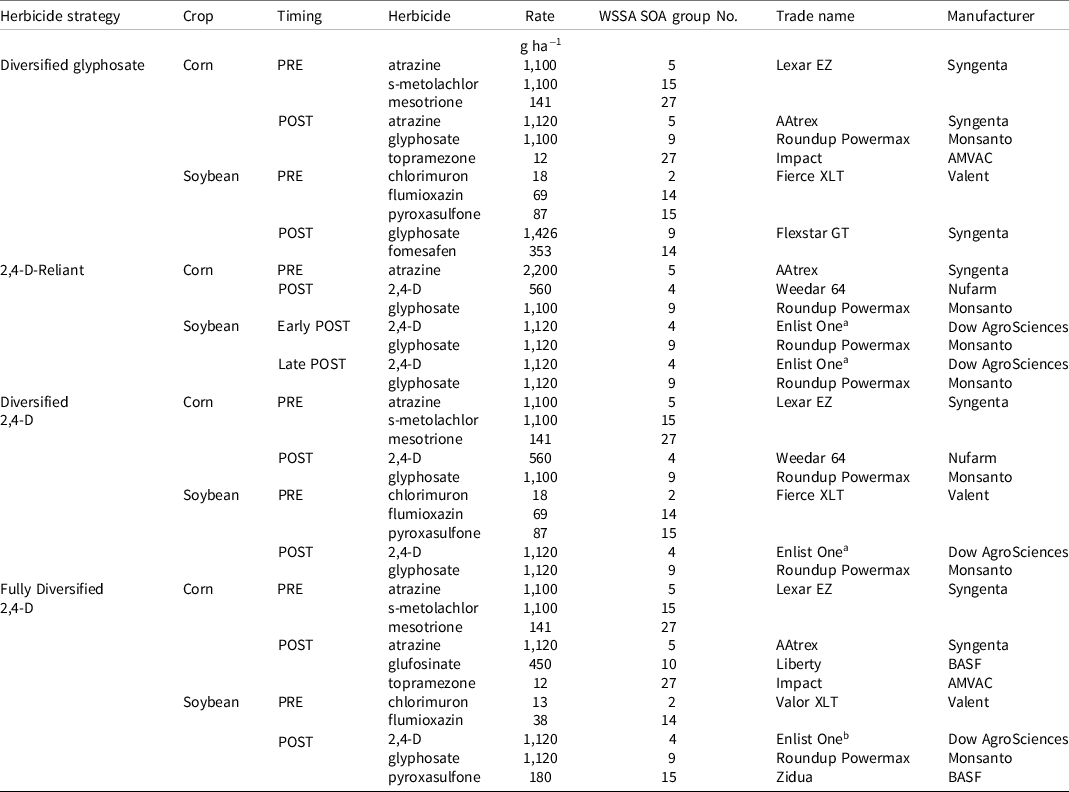
a Abbreviations: POST, postemergence; PRE, preemergence; SOA, site of action; WSSA, Weed Science Society of America.
b Prior to 2018 2,4-D amine was used in place of 2,4-D choline.
Herbicide application dates from 2013 to 2019. a
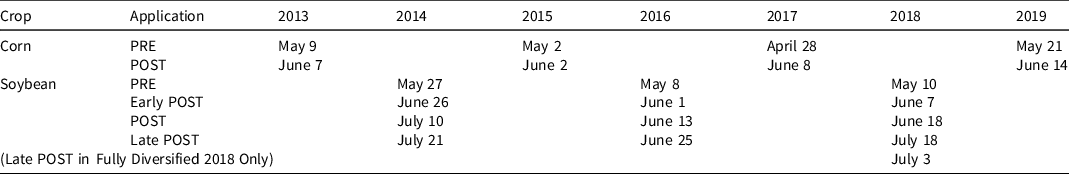
a Abbreviations: PRE, preemergence; POST, postemergence.
To characterize weed communities at each location prior to experiment initiation, 16 soil cores were collected randomly from each plot (minimum of 1 m distance from the edge of the plot) prior to spring tillage (Davis et al. Reference Davis, Gibson, Bauman, Weller and Johnson2009; Hodgskiss et al. Reference Hodgskiss, Legleiter, Young and Johnson2020). Each core measured 5.7 cm in diameter and 7.6 cm in depth. Weed densities are presented in units of 3,000 cm−3 due to volume being the most accurate unit of measurement for our collection methods. Seed density on a volume basis (cm3) has also previously been used to compare spatial analysis methods within soil seedbanks (Bigwood and Inouye Reference Bigwood and Inouye1988). Ten soil cores were collected in April of each year, homogenized by hand, and placed in 25- by 50-cm flats with soil spread evenly to an approximate depth of 2.5 cm. Flats were placed in a greenhouse in Lafayette, IN, where a 16-hr photoperiod was maintained using 600 W high-pressure sodium lights, and temperatures were set to approximately 26 C. Flats were watered twice a day for 8 wk. Weed species were recorded biweekly, and emerged weeds were removed from flats at each evaluation. After 4 wk, soil was manually mixed to promote germination of weeds that had not yet emerged. Weed species data were compiled and divided into monocot and dicot species.
Field Data Collection and Analysis
Two 1-m2 quadrats were established 4.5 m inward from the front and back of each plot and 1 m inward from the edge of the plot. Due to the long-term nature of this project quadrats were placed in the same location every year. Weed density counts were recorded prior to POST herbicide application and averaged for the two quadrats before analysis. Weed counts taken prior to POST applications occurred in mid June and are hereafter referred to as “early summer” evaluations. Total weed densities were compiled and analyzed, and separated into monocot and dicot species. Weed densities were analyzed using the GLIMMIX procedure in SAS analytics software (version 9.4; SAS Institute, Cary, NC) with herbicide strategy being considered a fixed effect, replication as a random effect, and year being a repeated measure. Means were separated using Tukey’s honestly significant difference test (α = 0.05). Yield data were collected by harvesting the middle four rows from each plot at physiological maturity for each crop. Data were subjected to analysis of variance using the GLIMMIX procedure in SAS with herbicide strategy being considered a fixed effect, replication as a random effect, and year being a repeated measure. Yield data were collected from the center two rows of each plot. Soybean and corn grain were weighed and sampled for moisture using a digital field monitor and a bench-top grain moisture tester (Dickey John GAC 2100 Grain Moisture Tester; DICKEY-john, Auburn, IL). Yield data were adjusted to 15% moisture.
Results and Discussion
Early Summer Weed Density and Species Richness
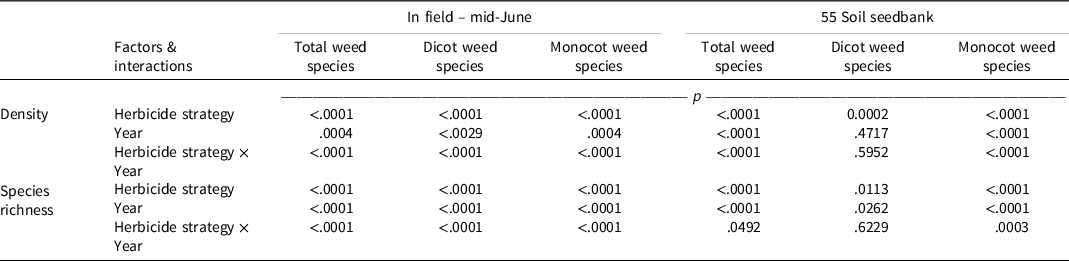
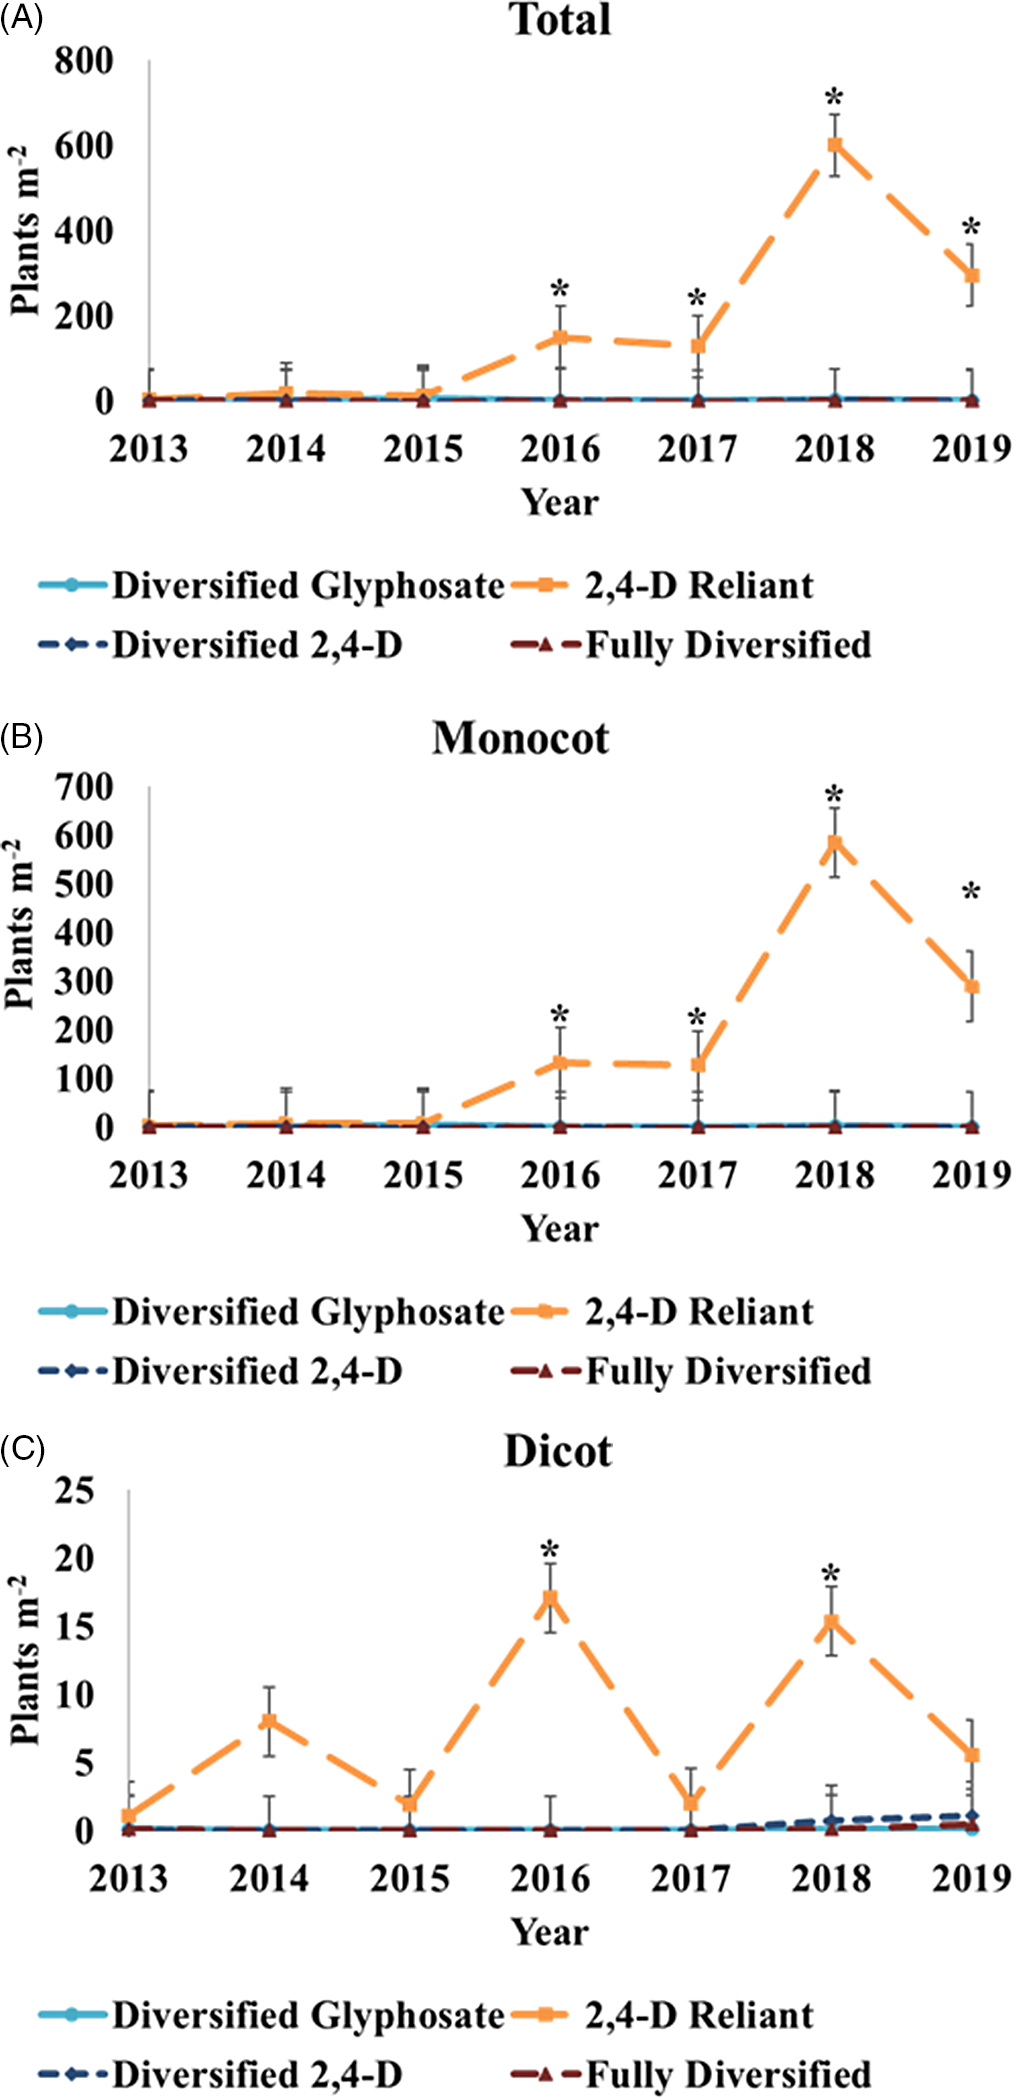
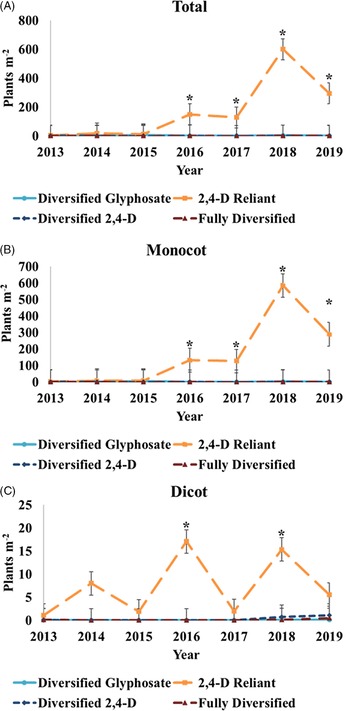
Total, dicot, and monocot weed densities were influenced by an interaction between herbicide strategy and year [P < 0.0001, P < 0.0001, and P < 0.0001, respectively (Table 3)]. The 2,4-D-reliant treatment had a higher density of total weed species and monocot species compared with all other treatments in 2016, 2017, 2018, and 2019 (Figure 1). Additionally, the 2,4-D-reliant strategy had a greater density of dicot species compared with all other treatments in 2016 and 2018. The highest total weed species and monocot weed densities occurred in 2018. In 2019, monocots comprised more than 95% of the total weeds present in early summer evaluations and more than 97% of the weed population in the 2,4-D-reliant strategy. Increases in the density of weeds tolerant to 2,4-D herbicides, such as monocots, occurred after 3 yr of selection pressure, and more than doubled after 5 yr of selection pressure. The increase in weed densities did not occur when six SOAs were used with the fully diversified strategy.
ANOVA table for the influence of herbicide strategy, year, and the interaction of the two on in-field, mid-June and soil seedbank total, dicot, and monocot density and species richness from 2013 to 2019.
In-field, early summer A) Total, B) Monocot, and C) Dicot weed densities in mid June. Standard error bars are shown. Asterisk represents differences in mean separation according to Tukey’s honestly significant difference test (P ≤ 0.05) within year influenced by an interaction between year and herbicide strategy in early-summer. Corn was grown in 2013, 2015, 2017, and 2019; soybean was grown in 2014, 2016, and 2018.
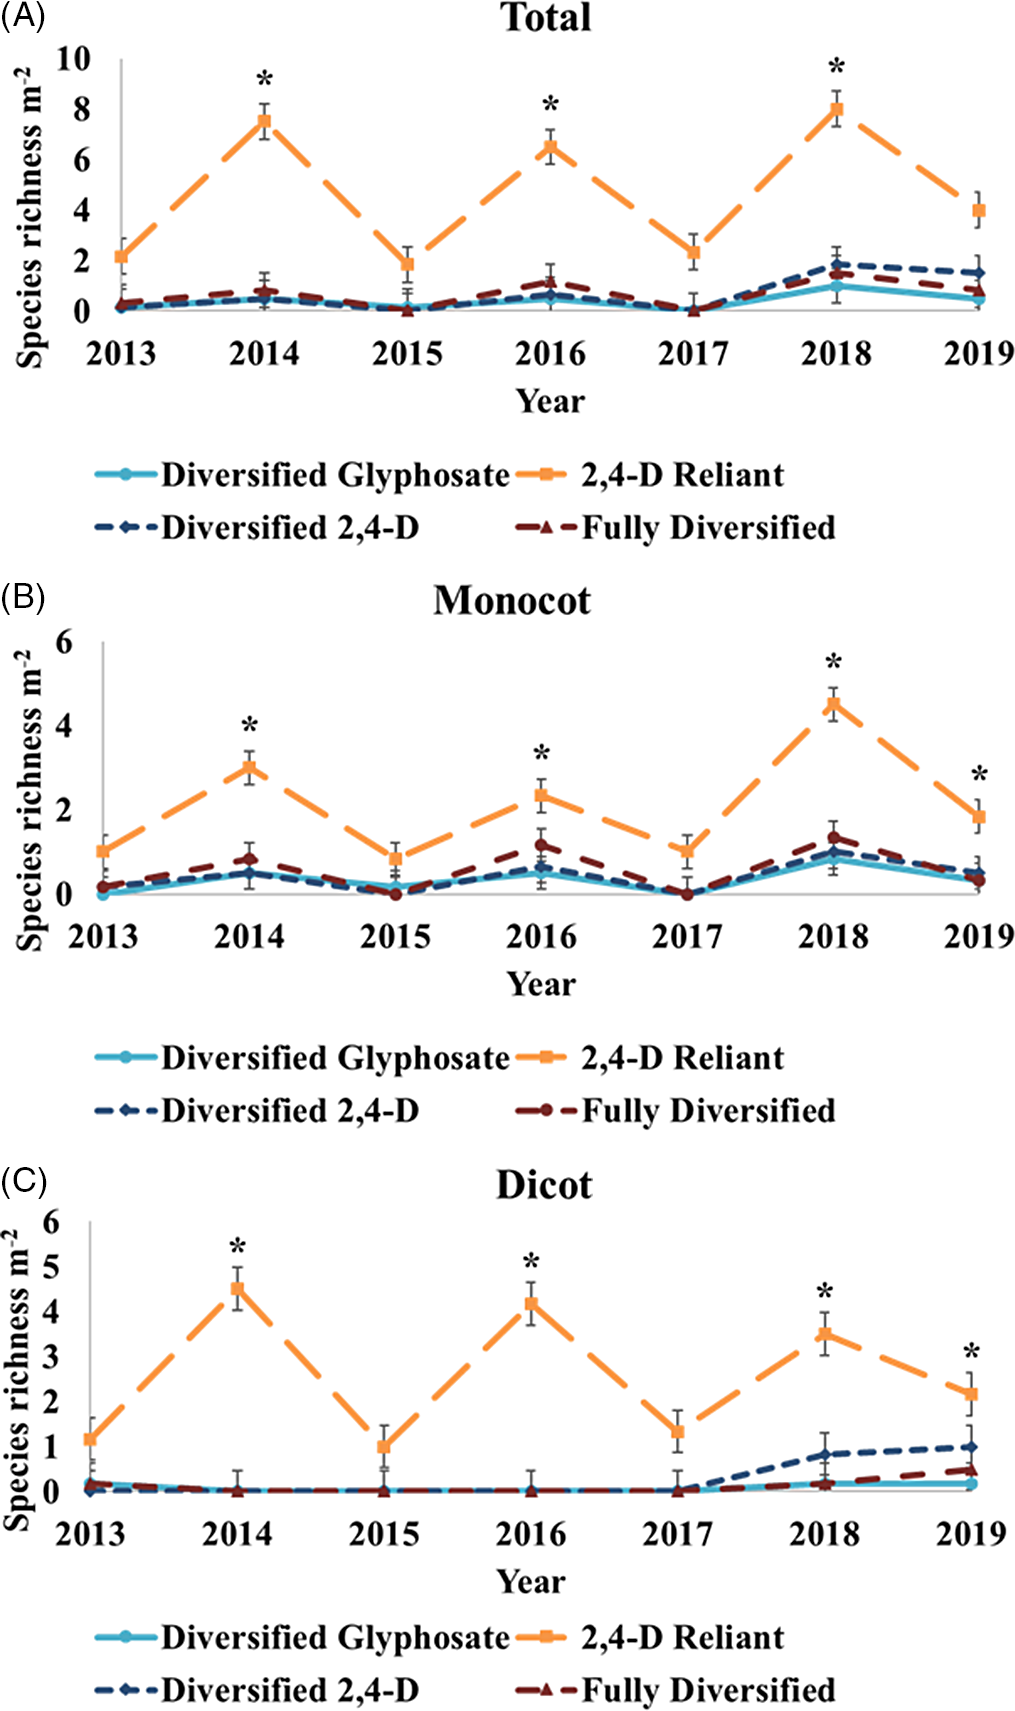
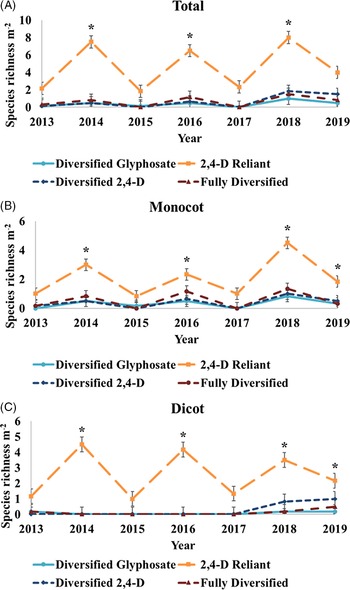
Similar to density, total, dicot, and monocot weed species richness were influenced by interactions between herbicide strategy and year (Table 3). Total species richness was highest in the 2,4-D-reliant strategy in every year soybean were grown (Figure 2). The high species richness in the 2,4-D-reliant strategy is due to only three SOAs being implemented to control a broad spectrum of weed species. Similarly, monocot species richness within the 2,4-D-reliant treatment was higher in soybean years. The next highest treatment in species richness contained 74% fewer species than the 2,4-D-reliant treatment. This demonstrates the importance of using multiple SOAs to reduce species richness in corn and soybean rotational systems to prevent shifts to monocot-dominated weed populations, and reduce the selection pressure for herbicide resistance to develop (Norsworthy et al. Reference Norsworthy, Ward, Shaw, Llewellyn, Nichols, Webster, Bradley, Frisvold, Powles, Burgos, Witt and Barrett2012). Implementing an herbicide strategy with six or more SOAs decreased both weed densities and species richness compared with a strategy that used only three SOAs. Weed densities for total, dicots, and monocots had at least 171, 7, and 165 more weeds per square meter within the 2,4-D-reliant strategy compared with all other strategies when years were pooled. Similarly, Gibson et al. (Reference Gibson, Young, Owen, Gage, Matthews, Jordan, Shaw, Weller and Wilson2016) estimated more diverse herbicide strategies would result in 40% lower weed densities in 10 yr compared with herbicide programs that focused mostly on POST herbicides, a common approach by farmers. Weed species richness for the diversified glyphosate, diversified 2,4-D, and fully diversified programs was 30% or less of the 2,4-D reliant richness in this study.
In-field, early summer A) Total, B) Monocot, and C) Dicot weed species richness in mid June. Standard error bars are shown. Asterisk represents differences in mean separation according to Tukey’s honestly significant difference test (P ≤ 0.05) within year as influenced by an interaction between year and herbicide strategy in early summer. Corn was grown in 2013, 2015, 2017, and 2019; soybean was grown in 2014, 2016, and 2018.
Soil Seedbank Weed Densities and Species Richness
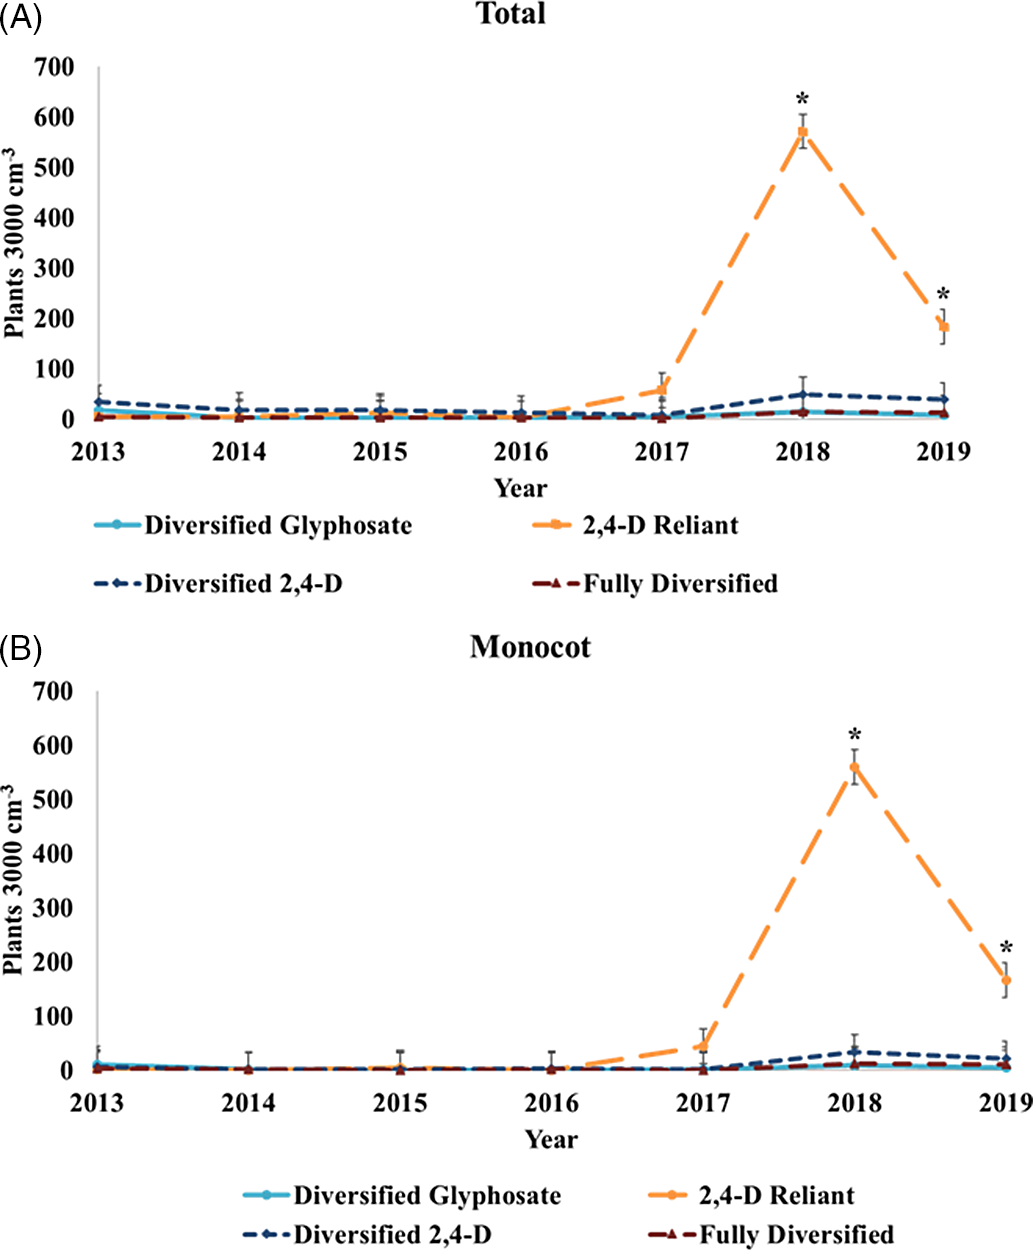
The total and monocot weed densities and species richness were both influenced by an interaction between herbicide strategy and year (Table 3). However, the dicot weed density was influenced only by herbicide strategy (P = 0.0002), whereas the dicot species richness was influenced both by herbicide strategy and year (P = 0.0113 and P = 0.0262). Total weed density showed no treatment effects in 2013, 2014, 2015, and 2016. In 2017, an increase in weed species density in the 2,4-D-reliant treatment compared with the other three treatments was observed (Figure 3). In 2018 and 2019, the 2,4-D-reliant treatment had greater densities of mostly monocot species than the other three treatments. Monocot density followed the same trend as the total weed density, with higher densities in 2018 and 2019. Dicot density was affected only by the treatment strategy, and density was highest in the diversified 2,4-D and 2,4-D-reliant strategies (Table 4). However, the diversified glyphosate, and fully diversified strategies had the lowest dicot densities with four and two dicot plants per 3,000 cm−3, respectively.
A) Total and B) Monocot weed species density in the soil seedbank. Standard error bars are shown. Asterisk represents differences in mean separation according to Tukey’s honestly significant difference test (P ≤ 0.05) within year as influenced by an interaction between year and herbicide strategy on soil seedbank. Corn was grown in 2013, 2015, 2017, and 2019; soybean was grown in 2014, 2016, and 2018.
Influence of 2,4-D herbicide strategy on dicot weed densities from 2013 to 2019 in the soil seedbank. a
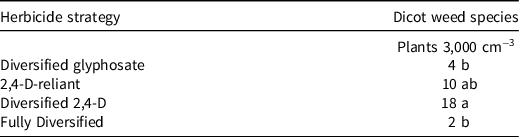
a Means followed by the same letter are not different according to Tukey’s honestly significant difference test (P ≤ 0.05).
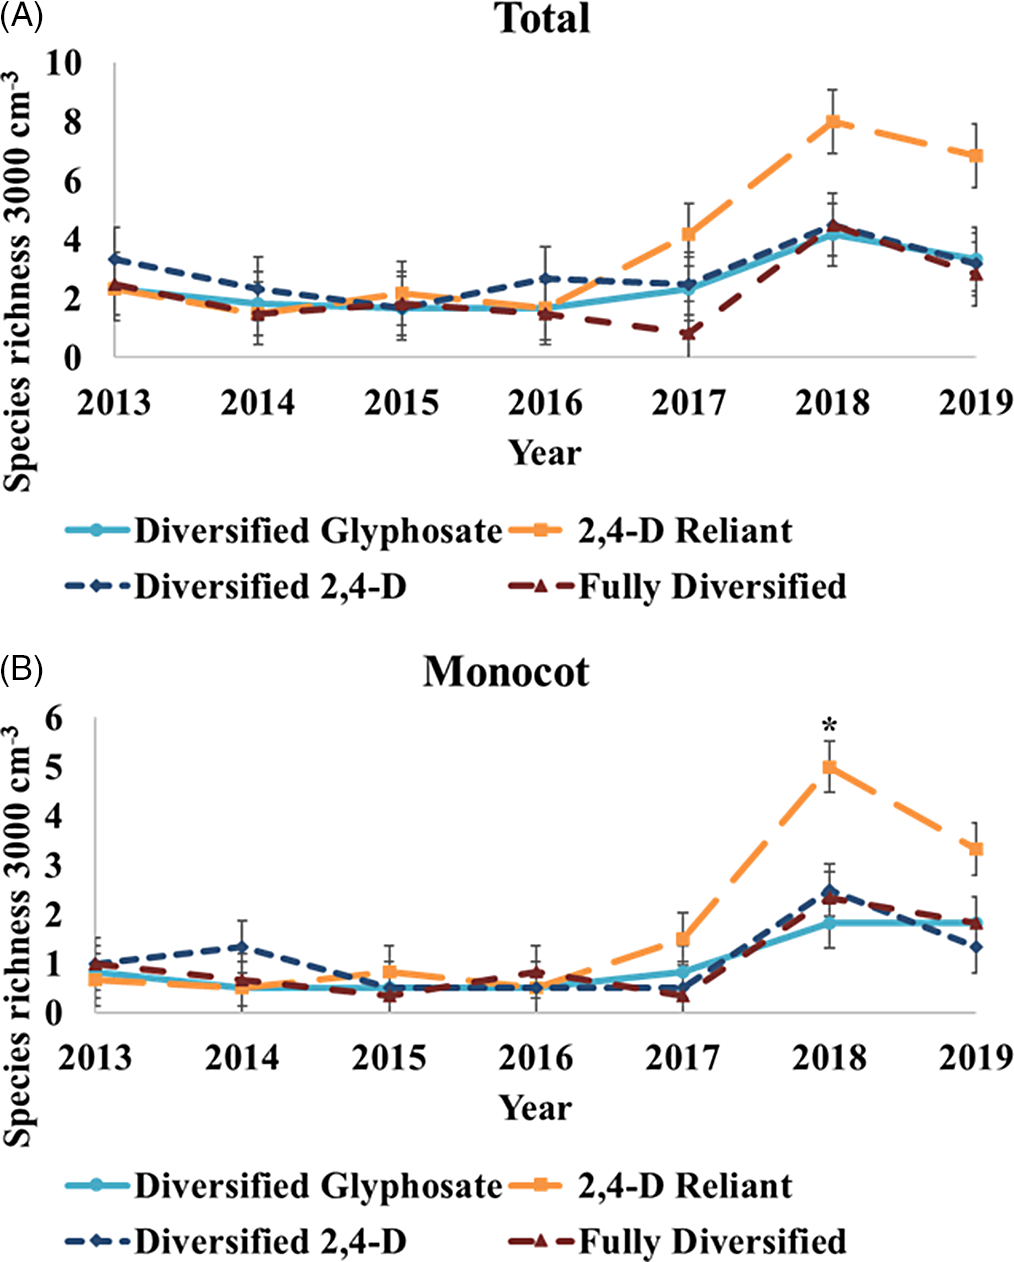
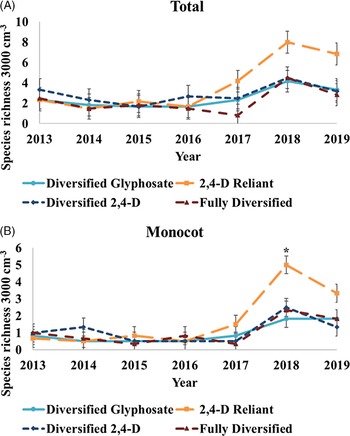
Total and monocot species richness was similar between treatments for the first 4 yr of the study. By year 5 (2017) the 2,4-D-reliant treatment had higher total species richness and this trend continued in 2018 and 2019 (Figure 4). Dicot species richness was similar across all years, with differences only occurring between 2014 and 2018 (Table 5). After 7 yr, the total species richness was highest in the 2,4-D-reliant strategy, having twice as many species as any other strategy. Davis et al. (Reference Davis, Renner and Gross2005) has previously reported differences in weed species composition due to different management practices of tillage and reduced input systems, and showed that reduced herbicide diversity results in greater weed species richness. This work shows that both early summer and seedbank assessments support the use of six or more SOAs across the 2-yr rotation to decrease weed densities and species richness compared with an herbicide strategy that relies exclusively on 2,4-D and glyphosate POST with the addition of atrazine PRE in the corn years.
A) Total and B) Monocot weed species richness in the soil seedbank. Standard error bars shown. Asterisk represents differences in mean separation according to Tukey’s honest significantly difference test (P ≤ 0.05) within year as influenced by an interaction between year and herbicide strategy on soil seedbank. Corn was grown in 2013, 2015, 2017, and 2019; soybean was grown in 2014, 2016, and 2018.
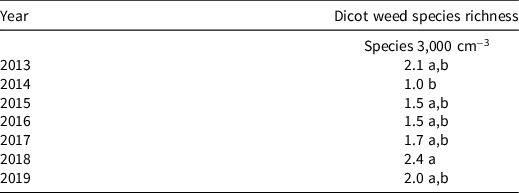
a Means followed by the same letter are not different according to Tukey’s honestly significant difference test (P ≤ 0.05).
b Corn was grown in 2013, 2015, 2017, and 2019; soybean was grown in 2014, 2016, and 2018.
Crop Yield
No differences in grain yield were observed within soybean years. However, corn grain yield was at least 7% less for the 2,4-D-reliant and diversified 2,4-D treatments, compared to the fully diversified herbicide strategy. In 2019, corn yield was reduced only in the diversified 2,4-D treatment, resulting in an 11.5% yield reduction (data not shown) due to weed competition.
Weed shifts have been previously reported due to changes in herbicide use. Sprague et al. (Reference Sprague, Stoller, Wax and Horak1997) reported that Palmer amaranth from Kansas and waterhemp from Illinois had become difficult to control with ALS herbicides due to resistance to them. Johnson et al. (Reference Johnson, Davis, Kruger and Weller2009) discussed weed shifts after the introduction of glyphosate-resistant cropping systems changing the composition from perennial grass and broadleaf species to a community of annual weed species with resistance to glyphosate. The continuous use of glyphosate-resistant crops has increased species richness for biennials, prostrate species, and winter annuals (Schwartz et al. Reference Schwartz, Gibson, Gage, Matthews, Jordan, Owen, Shaw, Weller, Wilson and Young2015). Wilson et al. (Reference Wilson, Miller, Westra, Kniss, Stahlman, Wicks and Kachman2007) evaluated weed shifts over 6 yr with a low and high rate of glyphosate and reported an increase in common lambsquarters when low rates of glyphosate were used compared to high rates. However, common lambsquarters densities remained similar when standard use rates were implemented. Wilson et al. (Reference Wilson, Young, Matthews, Weller, Johnson, Jordan, Owen, Dixon and Shaw2011) compared academic recommended practices to general farm operator practices and concluded that academic recommendations on average included more unique herbicide modes of action in seven different cropping systems. Heavy reliance on glyphosate shifted a Conyza canadensis population to primarily resistant biotypes after only 3 yr of continuous use (Davis et al. Reference Davis, Gibson, Bauman, Weller and Johnson2009).
Our research provides new evidence of weed community responses under varying 2,4-D selection pressures in soybean production systems. The effectiveness of treatments with additional SOAs demonstrate the benefit of overlapping residual herbicides to obtain an extended period of weed control. The value of using sequential residual herbicide application has been shown to be effective in providing 97% control of Palmer amaranth compared with 86% control when no residual was applied during a POST application (Sarangi and Jhala Reference Sarangi and Jhala2019). The 2,4-D-reliant herbicide strategy did not have a residual herbicide within the PRE or POST application in soybean years, which certainly resulted in more weed species in early summer evaluations compared to the other strategies.
Soil residual herbicides and using multiple SOAs provide a consistent method to reduce weed densities and species richness. Shergill et al. (Reference Shergill, Bish, Biggs and Bradley2018) similarly reported that residual herbicides applied prior to POST glyphosate applications resulted in greater than 50% reduction in weed densities and a 250% increase in yield compared to glyphosate alone. However, reductions in weed densities and an increase in crop grain yield were not observed until the fourth year. Although we did not observe a consistent increase in crop yield, overall weed management was improved with the more diverse herbicide strategies, as evidenced by the 52% increase in weed density for the 2,4-D-reliant in the early summer evaluations.
This research documents that used 2,4-D with only two other SOAs over the course of 7 yr in a corn-soybean rotation will result in both increased weed densities and species richness. Using 2,4-D with three other herbicide SOA groups, including soil residual herbicides applied only in corn, also resulted in up to 30% higher species richness within the soil seedbank as compared to herbicide strategies with six or more SOAs and residual herbicides applied every year.
Acknowledgments
This research received no specific grant from any funding agency, commercial or not-for-profit sectors. No conflicts of interest have been declared.


 Open access