

In Western countries, it is increasingly popular to consciously reduce the consumption of meat, mainly due to environmental, ethical and health concerns(Reference Forestell1,Reference Ruby2) . However, the proportion of the population following vegetarian or flexitarian diets remains unknown as estimates vary widely depending on the source(Reference Ruby2). When estimates are driven by online or telephone surveys sponsored by vegetarian associations, the prevalence of self-reported vegetarians can be up to 10–14 %(Reference Ruby2–Reference Leitzmann5). However, in population-based studies, national surveys, or independent analysis, only 1–4 % of the population reports following a vegetarian diet(6–Reference Newby, Tucker and Wolk14).
An accurate estimation of the prevalence of individuals following a vegetarian diet is also complicated by the fact that a large number of different types of dietary regimens fall under the definition of ‘vegetarian’. Individuals may define themselves as vegetarians depending on the questions that are being asked or on the definition adopted in the specific survey. Indeed, different types of vegetarian diets can be identified. The strictest regimen is the vegan diet, where all animal products are avoided. Lacto-ovo vegetarians, simplified as vegetarians, include in their diet animal-derived products such as eggs and dairy products, but exclude meat or fish. Pescatarians are defined as vegetarians who also consume fish and seafood products(Reference Forestell1,Reference Melina, Craig and Levin15) . More recently, the flexitarian diet (or semi-vegetarian) has been gaining popularity and identifies individuals eating meat occasionally, with no clear consensus on quantities of meat consumed per week or month required for falling under this category(Reference Derbyshire16). Omnivores are defined as eating indifferently animal and plant products.
In the current literature, it is difficult to find reliable data on the prevalence of vegetarians in the general population, and there is even less data on trends in the prevalence of these diets. Furthermore, few studies have attempted to characterise individuals following a vegetarian diet. Most of these reported that individuals following a vegetarian diet tend to be women, younger, smoke less and have a higher education(Reference Allès, Baudry and Méjean9,Reference Knox, Allen and Spencer17) . Nonetheless, there seems to be contradictory evidence about the link between income and following a vegetarian diet(Reference Allès, Baudry and Méjean9,Reference Bedford and Barr18) .
The medical community is showing growing interest in the potentially beneficial effects of a vegetarian diet, as shown by the increasing number of studies on the subject(Reference Tonstad, Butler and Yan19–Reference Valachovičová, Príbojová and Urbánek23). Cardiovascular risk factors such as elevated BMI, hypertension, hypercholesterolaemia and diabetes seem to be less prevalent in the population following different vegetarian diets(Reference Nakamoto, Watanabe and Kudo22,Reference Chiu, Hsu and Chiu24–Reference Derbyshire26) . Furthermore, some meta-analyses have shown a link between vegetarian diet and a protective effect on IHD and certain cancers(Reference Dinu, Abbate and Gensini21). Finally, some but not all evidence suggests a link between following a vegetarian diet and reduced all-cause mortality(Reference Kim, Caulfield and Garcia-Larsen27,Reference Mihrshahi, Ding and Gale28) .
The main purpose of the present study is to reliably assess the prevalence and temporal trends of different types of vegetarian diets in a yearly Swiss cross-sectional study. The secondary objectives are to analyse the sociodemographic characteristics of the cohort and to assess the possible correlation between the different types of vegetarian diets and cardiovascular risk factors. With the presumed health benefits of different vegetarian diets, it is essential to better identify and characterise who in the general population is following such diets.
Materials and methods
Data were collected using the Bus Santé study, a cross-sectional population-based study in the State of Geneva, Switzerland conducted annually since 1993(Reference Guessous, Luthi and Bowling29,Reference Guessous, Joost and Jeannot30) . The aim is to collect sociodemographic data and information about cardiovascular risk factors from a representative sample of the Swiss adult population. Each year, about 1000 participants aged from 18 to 74 years are selected to participate in the study and individuals cannot be included more than once in the study. Eligible participants are identified from an annual residential list made by the Government of Geneva. Potential participants are contacted first by mail. If no answer is given, eligible participants can receive up to seven phone calls and up to two more mails. People who do not answer are replaced by another eligible participant. People who refuse to participate are not replaced. Participants are met either at the Geneva University Hospital or at a mobile medical unit (a bus), facilitating access to all suburban areas. Participation rate varied between 45 and 55 % with yearly variations.
First, participants receive a questionnaire at home about lifestyle habits (smoking, physical activity and nutrition), sociodemographic information and health, including questions regarding cardiovascular risks factors. The dietary habits are assessed using an FFQ with a recall period of 4 weeks. Secondly, participants undergo a face-to-face interview with trained nurses who verify the completeness of the questionnaires and take anthropometric measures including height and weight, according to standard procedures. For weight measurement, the participant is weighed on a medical scale and has to take off his shoes and be lightly dressed. Height is measured using a medical gauge. Blood pressure is measured three times after 10 min of rest in a sitting position with a cuff size adjusted to the arm circumference. The average of the three blood pressure measures is used for the analyses. A blood test is performed including the measurement of fasting plasma glucose, total cholesterol and TAG.
The Bus Santé study complied with the declaration of Helsinki and is approved by the institutional ethical committee of the University of Geneva. Furthermore, patients gave their written consent. No financial compensation was given to participants.
Food frequency questionnaire
The FFQ used in the present study has been validated in the Geneva population(Reference Bernstein, Morabia and Costanza31) and has been used in the previous studies(Reference De Abreu, Guessous and Gaspoz32,Reference Morabia, Bernstein and Héritier33) . It is based on ninety-seven different food items.
For each item, the participant must indicate the size of the portion consumed (smaller, equal or larger than a reference size) and the frequency at which it was consumed over the last 4 weeks (<1× over the last 4 weeks up to twice a day)(Reference Morabia, Bernstein and Kumanyika34).
Type of diet
Participants were classified according to the type of diet based on the FFQ results. Participants were classified as omnivores when they ate meat >1/week; as vegetarians when they excluded red meat, poultry and fish from their diet but ate dairy products and eggs; as pescatarians when they consumed fish, in addition to dairy products and eggs but did not eat red meat or poultry(Reference Melina, Craig and Levin15) and as flexitarians when they included eggs and dairy products in their daily diet and red meat or poultry at a frequency of ≥1/month but ≤1/week(Reference Tonstad, Butler and Yan19,Reference Mihrshahi, Ding and Gale28,Reference Clarys, Deliens and Huybrechts35) .
Cardiovascular risk factors
We chose to focus on five cardiovascular risk factors: overweight, hypertension hypercholesterolaemia, diabetes and smoking.
BMI was calculated as weight/height2. Participants were classified as having normal BMI (BMI < 25 kg/m2), as being overweight (BMI ≥ 25 and <30 kg/m2) or as being obese (BMI ≥ 30 kg/m2). Hypertension was defined as either one measurement of the systolic blood pressure ≥140 mmHg or mean blood pressure ≥90 mmHg or if medications against high blood pressure were taken or as having a previous diagnosis of hypertension. Hypercholesterolaemia was defined as having total blood cholesterol > 6·5 mmol/l and HDL < 1 mmol/l or if medications against hypercholesterolaemia were taken or as having a previous diagnosis. Diabetes was defined as a fasting glucose > 7 mmol/l or if medications against diabetes were taken or as having a previous diagnosis. Smoking was defined as being a current smoker.
Total cholesterol, systolic and diastolic blood pressure, fasting plasma glucose and BMI were also assessed as continuous biomarkers in relation to the different types of diet.
Statistical analysis
The analytical sample comprised all the participants included in the Bus Santé study from 2005 to 2017. Although the Bus Santé study started in 1993, biomarkers of interest for our study became available from 2005 onwards, which is why earlier data were not included in the analysis. We used χ 2 test for differences in dietary pattern between men and women in binary/categorical variables and student t test in continuous outcomes. All assumptions were met for normality and homoscedasticity. Given the sex differences in diet patterns, we conducted analyses separately for men and women, as well as in the overall sample. To calculate the prevalence and 95 % CI, we applied margins after logistic regression, adjusting for age in sex-specific models and for age and sex in the overall model. To assess the change in prevalence between the first (%start) and last (%last) survey periods, we used the following formula: ((%last–%start)/(%start)) × 100. To test for linear trend in the prevalence of diet patterns, we included the survey period variable as continuous predictor in the model. To assess for trends in food groups (i.e. meat type consumption) and for the association between diet patterns and biomarkers, we applied multivariable linear regression. To investigate the association between diet patterns and sociodemographic and cardiovascular risk factors, we used multinomial logistic regression, adjusting the estimates for age, sex and survey period. We further adjusted the estimates for BMI in sensitivity analyses to assess its role in the link between diet type and cardiovascular risk factors. All statistical analyses were conducted using STATA version 15 (Stata Corp.). The level of significance was set to P < 0·05. Results for daily dietary intake are expressed as β-coefficients and 95 % CI, for biomarkers as means and standard deviations and for the association between diet patterns and sociodemographic and cardiovascular risk factors as OR and 95 % CI.
Results
Baseline characteristics and prevalence
A total of 10 797 participants were included in the analyses, which spanned over a period of 13 years, from 2005 until 2017 (Table 1). Of the total number of participants, 51 % were women and the mean age was 48·9 (sd 13·4) years. The mean BMI was 25·1 (sd 4·4) kg/m2, with 33·3 % of participants being overweight and 13·3 % being obese. Current smokers were 22 % of the sample. In the sample, 46·7 % had been through higher education or had a university degree.
Description of sample, Bus Santé study 2005–2017 (n 10 797)*
(Numbers and percentages; mean values and standard deviations)
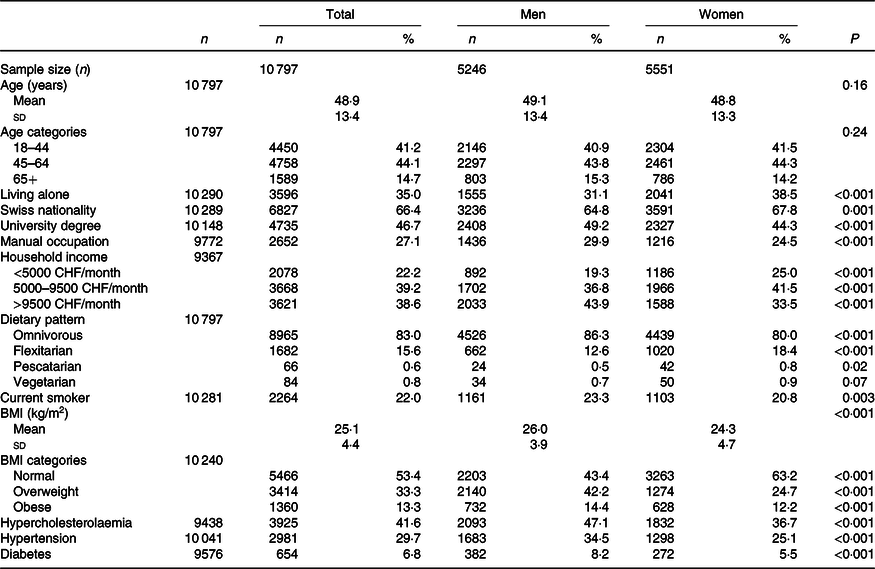
CHF, Swiss Francs (1 CHF = 1·01 USD as of 14 November 2019).
* P value for difference between men and women from t test for continuous variables and from χ 2 test for binary/categorical variables. Hypertension was defined as having a previous diagnosis or blood pressure ≥140/90 mmHg. Hypercholesterolaemia was defined as having a previous diagnosis or having total blood cholesterol >6·5 mmol/l and HDL <1 mmol/l. Diabetes was defined as self-reported diabetes or a fasting plasma glucose level of ≥7 mmol/l.
Within the studied population, there were eighty-four vegetarians (0·8 %), sixty-six pescatarians (0·6 %) and 1682 flexitarians (15·6 %). Due to the extremely low prevalence of vegans (<10 people over the 13 years of data collection), no sub-group analysis was conducted for this category.
Trends for diets and meat consumption
Over the 13 year study period, the prevalence of a vegetarian diet increased from 0·5 to 1·2 % (P = 0·03; Table 2). In analysis stratified by sex, an increase in the prevalence of vegetarians was significant for women but not for men. The proportion of participants following a pescatarian diet also increased significantly from 0·3 to 1·1 % (P < 0·01) with a significant increase for men but not for women. The prevalence of flexitarians remained stable during the survey period (15·6 %). Over the 13 years, beef intake significantly decreased by 15 % for women and by 9 % for men, which was barely non-significant (P = 0·06), while poultry intake significantly increased by 8 and 10 %, respectively. Despite those variations, the overall total meat intake remained stable (Table 3). When adjusted for education, occupation and income, there was no longer a significant decrease in poultry intake (online Supplementary Table S1).
Trends in the prevalence of diet patterns by sex, Bus Santé study 2005–2017 (n 10 797)
(Numbers; percentage values and 95 % confidence intervals)*
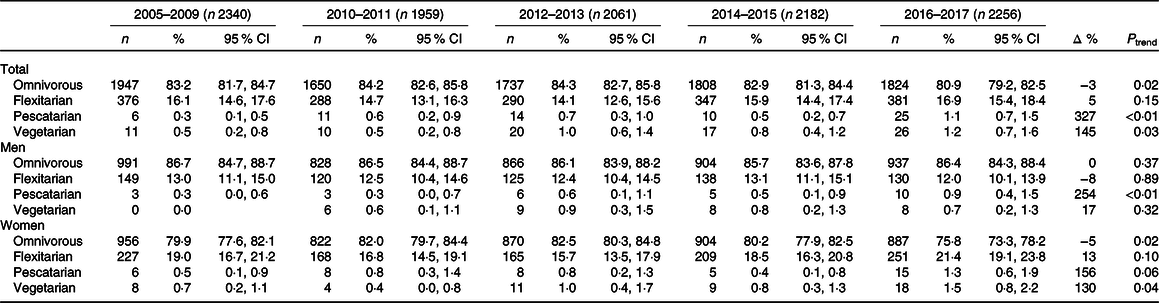
* Prevalence in percentage and 95 % CI from margins after logistic regression, adjusted for age in sex-specific models and for sex in age-specific models. P for linear trend across survey years. N represents the raw number of participants reporting each dietary type. Δ represents the percentage change in the prevalence of dietary pattern between 2005–2009 and 2016–2017, except for vegetarian diet pattern among men, for which the starting period is 2010–2011.
Trends in the mean consumption of meat type by sex, Bus Santé study 2005–2017*
(Mean values and 95 % confidence intervals)
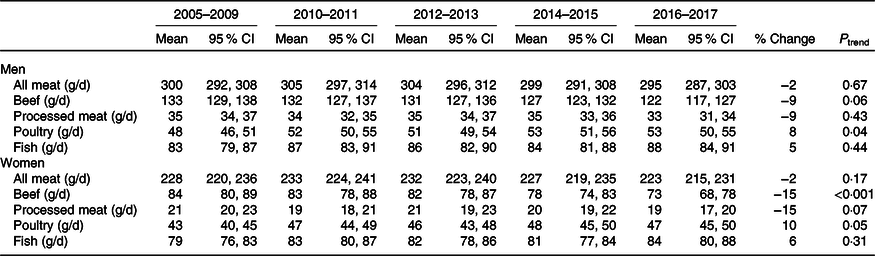
* Mean and 95 % CI are from margins after linear regression with survey period as predictor, adjusted for age and sex. P for linear trend across survey years.
Sociodemographic characteristics of different diet groups
Sociodemographic determinants of dietary choices are presented in Table 4. Compared with omnivores, vegetarians were younger (OR 2·38; 95 % CI 1·01, 5·6) and more likely to be women (OR 1·52; 95 % CI 0·98, 2·35), although this result was non-significant. They were also more likely to have a university degree than omnivores (OR 1·59; 95 % CI 1·01, 2·49). Compared with omnivores, pescatarians were more likely to be women (OR 1·81; 95 % CI 1·10, 3·00) and less likely to be Swiss (OR 0·59; 95 % CI 0·36, 0·98). Flexitarians were more likely to be female (OR 1·57; 95 % CI 1·41, 1·75), more likely to live alone than omnivores (OR 1·49; 95 % CI 1·33, 1·66) and more likely to be Swiss (OR 1·57; 95 % CI 1·38, 1·77). Conversely, individuals with a low income were more likely to follow a vegetarian (OR 1·83; 95 % CI 1·04, 3·21) or flexitarian (OR 1·31; 95 % CI 1·13, 1·53) diet. Smoking status was not associated with dietary regimen.
Association of diet patterns with sociodemographic and cardiovascular risk factors, Bus Santé study 2005–2017* (n 10 797)
(Numbers and percentages; odds ratios and 95 % confidence intervals)
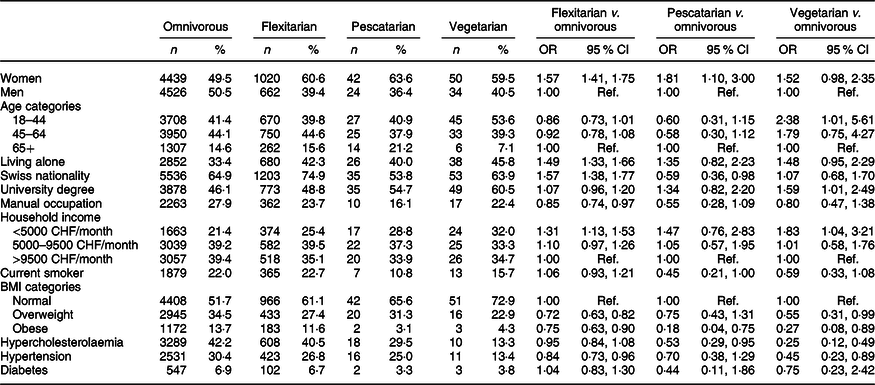
CHF, Swiss Francs (1 CHF = 1·01 USD as of 14 November 2019).
* OR and 95 % CI from logistic or multinomial logistic regression models with the diet type as predictor, adjusted for age, sex and survey year. Hypertension was defined as having a previous diagnosis or blood pressure ≥140/90 mmHg. Hypercholesterolaemia was defined as having a previous diagnosis or having total blood cholesterol >6·5 mmol/l and HDL <1 mmol/l. Diabetes was defined as self-reported diabetes or a fasting plasma glucose level of ≥7 mmol/l.
Cardiovascular risk factors
The distribution of cardiovascular risk factor for each dietary regimen is presented in Table 4. Vegetarians were less likely to be overweight (OR 0·55; 95 % CI 0·31, 0·99), obese (OR 0·27; 95 % CI 0·08, 0·89), hypercholesterolaemic (OR 0·25; 95 % CI 0·12, 0·49) and hypertensive (OR 0·45; 95 % CI 0·23, 0·89) when compared with omnivores. Pescatarians were less likely to be obese (OR 0·18; 95 % CI 0·04, 0·75) and less hypercholesterolaemic (OR 0·53; 95 % CI 0·29, 0·95) when compared with omnivores. Finally, flexitarians were generally less likely to be overweight (OR 0·72; 95 % CI 0·63, 0·82), obese (OR 0·75; 95 % CI 0·63, 0·90) and hypertensive (OR 0·84; 95 % CI 0·73, 0·96) than omnivores. Dietary regimen did not influence diabetes status. BMI explained part of the association between flexitarians, vegetarians diets and hypertension as well as between pescatarians and hypercholesterolaemia, so that these associations were no longer significant after accounting for BMI (online Supplementary Table S2). Adjustment for education, occupation and income did not change the significance or the magnitude of our results (online Supplementary Table S3).
Association between cardiovascular risk factors on a continuous scale and dietary choices is presented in Table 5. Vegetarians had a lower BMI −2·22 (95 % CI −3·13, −1·31) kg/m2, total cholesterol −0·44 (95 % CI −0·67, −0·21) mmol/l and LDL −0·33 (95 % CI −0·52, −0·13) mmol/l. Pescatarians had a lower BMI at −1·7 (95 % CI −2·72, −0·68) kg/m2, a lower total cholesterol at −0·34 (95 % CI −0·60, −0·08) mmol/l and LDL −0·36 (95 % CI −0·58, −0·14) mmol/l. They also had a lower blood pressure with systolic at −4·90 (95 % CI −8·54, −1·27) mmHg and diastolic at −3·31 (95 % CI −5·81, −0·81) mmHg. Flexitarians also had a significant lower BMI at −0·66 (95 % CI −0·88, −0·44) kg/m2 and a lower blood pressure with systolic at −0·97 (95 % CI −1·76, −0·17) mmHg and diastolic at −0·66 (95 % CI −1·21, −0·11) mmHg. Adjustment for education, occupation and income did not change the significance or the magnitude of our results (online Supplementary Table S4).
Association between dietary pattern and biomarkers, Bus Santé study 2005–2017 (n 10 797)*
(Mean values and standard deviations; coefficients and 95 % confidence intervals)

* Means and standard deviations are adjusted for age, sex and survey year. Coefficients and 95 % CI are from linear regression and adjusted for age, sex, BMI and survey year.
Discussion
In this 13 year cross-sectional population-based study, we showed that the prevalence of vegetarians in the Geneva adult population was low and slightly increased from 0·5 to 1·2 % from 2005–2009 to 2016–2017. An additional 1·1 % of the population was pescatarian in 2016–2017, and flexitarians represented 15·6 % of the studied population and remained stable during the study period. Vegans represented less than 0·1 % of the studied population. Compared with omnivores, vegetarians were more likely to be young, have a higher education and a low income; pescatarians were more likely to be women and flexitarians were more likely to be women and had a lower income. Total meat intake remained stable, but both sex reduced their red meat consumption during the studied period with results barely non-significant for men. All dietary regimens excluding/reducing meat intake showed a more favourable cardiovascular profile compared with omnivorous (i.e. lower BMI, lower total cholesterol and hypertension).
The prevalence of vegetarians observed in previous studies varies greatly. Our study found a mean prevalence in vegetarian diet of 0·8 %, which is relatively similar to that reported in a Finnish study(Reference Vinnari, Montonen and Härkänen8). The present study was also a cross-sectional examination and used an FFQ to determine the type of diet. The prevalence was slightly lower than that in our study with 0·43 % vegetarians. Others studies have found higher prevalence rates, ranging from 1·7 to 3·9 % in Europe(6,Reference Dagevos12,Reference Newby, Tucker and Wolk14) and in the USA(Reference Kim, Rotundo and Song13,Reference Cramer, Kessler and Sundberg36) . Between-study differences in the prevalence of vegetarians could be due to different methods used to identify the type of diet. Indeed, evidence suggests that when people self-report themselves as vegetarians, higher rates are found than when the study design uses a specific questionnaire like the FFQ(Reference Vinnari, Montonen and Härkänen8). This could be due to a misunderstanding of the definition of vegetarian, which can have a different meaning for each participant and being influenced by cultural norms or health literacy. In addition, it is likely that the population associates vegetarianism with a positive behaviour and wishes to be associated to it, thus producing an overestimation of its true prevalence(Reference Vinnari, Montonen and Härkänen8). For instance, the Swiss Vegetarian association estimates the prevalence of vegetarianism in Switzerland in 2017 to be as high as 14 % (3 % vegans, 11 % vegetarians)(37), but these latter estimates are based on a poll that included self-defined vegetarians rather than on a report on actual food intake as in our study. We also observed a positive trend with the prevalence of the vegetarians having increased from 0·5 % at the beginning of the study to 1·2 % at the end. Several studies mention an increase in vegetarianism, but they only cite surveys conducted by vegetarian associations that may tend to overestimate the prevalence of vegetarians(Reference Ruby2,Reference Bieri, von Siebenthal and Köhler4,Reference Leitzmann5) . Two independent population-based studies have assessed trends on the prevalence of vegetarian diets, but they presented limitations in their definition of vegetarians(6,Reference Cramer, Kessler and Sundberg36) . One of these focused on self-reported vegetarians for health reasons and showed an increase from 1·6 to 1·9 % between 2002 and 2012 in the USA(Reference Cramer, Kessler and Sundberg36). Our study provides new insight based on an independent data source.
In the present study, vegetarians were younger, had a higher level of education and were more likely to be women compared with omnivores, confirming the findings of previous studies(Reference Vinnari, Montonen and Härkänen8,Reference Allès, Baudry and Méjean9) . The association between being vegetarian and higher level of education could be explained by the fact that individuals having a higher education level may be more health(Reference Li and Powdthavee38) and/or environment(Reference Duroy39) conscious. Alternatively, this association may be due to secular trends in education that imply that young individuals have higher educational levels(Reference Knox, Allen and Spencer17). The latter seems less likely since the analyses were age adjusted. Income was inversely associated with the following vegetarian diet, with participants with a higher income being more likely to be omnivores in our study. The link between income and meat consumption seems to vary considerably depending on the country. For instance, a German study found no association between following a vegetarian diet and income(Reference Pfeiler and Egloff11), whereas a Canadian and French study found an association between low income and the use of a vegetarian diet(Reference Allès, Baudry and Méjean9,Reference Bedford and Barr18) . In Switzerland, the price of meat ranks among the most expensive in the world(40). For low-income individuals, meat prices could be a reason to reduce meat consumption(Reference Allès, Baudry and Méjean9). Meat consumption is highly dependent on cultural habits and social background, which may explain a variation between countries(Reference Pfeiler and Egloff11).
Our study found that 15·6 % of the population could be defined as flexitarians. To the best of our knowledge, this is the first population-based study to precisely measure with an FFQ the prevalence of this type of diet. Our prevalence of flexitarians seems relatively similar to another study from the Netherlands(Reference Dagevos12), which reported a prevalence rate of 11–15 % flexitarians between 2009 and 2011, even though in the present study being flexitarian was self-reported(Reference Dagevos12). Sociodemographic data on flexitarians are lacking in the literature. Flexitarians were more likely to be female and had a lower income than omnivores. However, unlike vegetarians, they did not have higher education and were not younger than omnivores. Interestingly, flexitarians seem to be a distinct population from vegetarians.
Over the 13 years, the overall total meat intake and processed meat remained stable. However, beef intake decreased by 15 % for women and by 9 % for men, and an increase in poultry consumption was observed. This result is interesting as it suggests that the population may be receptive to public health messages encouraging the reduction of red and processed meat intake. Indeed, red and processed meat intake has been positively associated with higher incidence of CVD, type 2 diabetes, certain cancers(Reference McEvoy, Temple and Woodside3,Reference Zheng, Li and Satija41,Reference Micha, Wallace and Mozaffarian42) and a higher mortality risk(Reference Zheng, Li and Satija41).
Compared with omnivores, individuals with reduced meat intake generally showed a more favourable profile in terms of cardiovascular risk factors. All dietary profiles had a lower BMI compared with the omnivores (vegetarians of −2·2 kg/m2, pescatarians of −1·7 kg/m2 and flexitarian of −0·7 kg/m2). Both vegetarians and pescatarians had lower rates of hypercholesterolaemia, and flexitarians had lower values of total cholesterol and LDL. Flexitarians and vegetarians had lower rates of hypertension, and all three diets had lower values of blood pressure compared with omnivores with results barely non-significant for vegetarians, probably due to our small sample size. Adjustment for education, occupation and income did not alter the significance or magnitude of our results. However, as expected, several of the observed associations between diet and cardiovascular risk factors other than BMI seemed to be mediated by BMI, supporting the hypothesis that vegetarian diets may lead to a lower BMI, which could then result in a decrease in cardiovascular risk factors. Overall, our findings confirm the previous results from cross-sectional studies and prospective cohorts(Reference Yokoyama, Levin and Barnard43–Reference Picasso, Lo-Tayraco and Ramos-Villanueva45) on the positive link between different vegetarian diets and a positive cardiometabolic profile(Reference Knox, Allen and Spencer17,Reference Tonstad, Stewart and Oda20,Reference Spencer, Appleby and Davey46–Reference Tonstad, Butler and Yan50) .
It has been proposed that the positive impact on health of vegetarian diets is due to a lower energy density, a lower exposure to harmful components contained in animal food (such as saturated fats, cholesterol, haeme Fe and N-glycolylneuraminic acid) and an increased consumption of protective elements such as fibres and antioxidants(Reference Kahleova, Levin and Barnard51), along with the positive impact on weight discussed earlier. Although the cross-sectional nature of our study does not allow us to conclude on the causal link between vegetarian diets and cardiovascular risk factors, our results are in line with those from important longitudinal studies and several randomised controlled trials reporting the beneficial effects of a vegetarian diet, with less evidence for flexitarians(Reference Chiu, Hsu and Chiu24,Reference Yokoyama, Levin and Barnard43,Reference Yokoyama, Nishimura and Barnard44,Reference Spencer, Appleby and Davey46,Reference Papier, Appleby and Fensom48,Reference Wang and Li52,Reference Margetts, Armstrong and Beilin53) . Finally, we cannot exclude that these described positive effects may be due to unmeasured confounding factors. For example, these beneficial effects may be related to the generally advantaged socio-behavioural profile of vegetarians. In our study, this bias seems to be limited by the fact that our population of vegetarians had a lower income than omnivores, with low income generally being a cardiovascular risk factor(Reference Kreatsoulas and Anand54).
Some limitations to our study need to be acknowledged. The sample of vegetarians was low, which potentially leads to power issues. Moreover, the study design did not allow to account for how long participants had been following a specific diet. Since an individual’s meat consumption can fluctuate from month to month, it is possible that an FFQ conducted over a period of only 4 weeks could lead to a misclassification bias and thus mitigate the overall results. In addition to this, although the Bus Santé study aims to be representative of the Geneva population, recruitment bias cannot be excluded. This could lead to an over- or under-selection of participants with different profiles from the population. However, the prevalence of cardiovascular risk factors found in our study appears to be similar to that found in the general population of Geneva(55).
Our study has several strengths. Unlike other studies where the data came from self-reported online(Reference Allès, Baudry and Méjean9) or mailed(Reference Tonstad, Butler and Yan19) questionnaires, in our study, the questionnaires, anthropometric measurements and biological data came from standardised measurements performed by trained personnel. Unlike many previous studies(Reference Vinnari, Montonen and Härkänen8,Reference Ponzio, Mazzarini and Gasperi10,Reference Pfeiler and Egloff11) , vegetarians were identified through an FFQ rather than a subjective question on the type of diet that participants were following. Evidence has shown that up to 80 % of self-reported vegetarians were in fact omnivores(Reference Vinnari, Montonen and Härkänen8). Finally, our results are obtained from a cross-sectional study that was government funded with a recruitment in the general population, independent from parties with a potential conflict of interests such as the industry or vegetarian associations. All these strengths should result in more reliable and objective data.
Conclusion
In our cross-sectional population study spanning over 13 years, the proportion of vegetarians and pescatarians in the population increased, whereas that of flexitarians remained stable at a remarkably high rate. Vegetarians were younger, had a lower income, higher education and were more likely to be women. Like vegetarians, flexitarians were more prone to be female and had a lower income but contrary to vegetarians they did not have higher education and were not younger than omnivores, suggesting that this population represents a distinct pattern among the different vegetarians diet. Vegetarians, pescatarians and flexitarians had a lower prevalence of cardiovascular risks factors such as high BMI, hypertension or hypercholesterolaemia. Our results confirm previous reports from longitudinal and randomised controlled trials and reiterate that fact that promoting a reduction of meat consumption would not only benefit the planet but also population health.
Acknowledgements
This work was funded with grant from a donor of the Private Foundation of the Geneva University Hospitals. The Private Foundation of the Geneva University Hospitals had no role in the design, analysis or writing of this article.
S. S., H. W. and C. L. designed research; S. S. and C. d. M. performed statistical analysis; S. S., H. W., C. L., J.-L. R. and I. G. wrote the paper; S. S. had primary responsibility for final content. All authors read and approved the final manuscript.
The authors declare that they have no conflicts of interest.
Supplementary material
For supplementary material referred to in this article, please visit https://doi.org/10.1017/S0007114520001762


 Open access