

Introduction
Atmospheric particles and the chemical composition of glaciers are of mutual interest to atmospheric chemists and glaciologists. On the one hand, the deposition of particles in glaciers is roughly proportional to their concentration in the atmosphere, a fact that enables glacier cores to be dated on the evidence of known variations in atmospheric particulate loading. On the other hand, and perhaps this is more important, observed depth profiles of glacial composition can be used to identify unknown historical changes in atmospheric particulate loading (Reference Hammer and GoldbergHammer 1982, Reference HerronHerron 1982, Reference Koerner and FisherKoerner and Fisher 1982, Reference Stothers and RampinoStothers and Rampino 1983, Reference BarrieBarrie and others 1985).
Atmospheric particles, often referred to as aerosols, originate from a variety of natural and man-made sources around the globe. A global inventory of the annual emission rate of particulate mass is shown in Table I. Man’s contribution to the total emission (from 5 to 48%) is substantial but nevertheless smaller than natural sources. Gas-to-particle conversion, producing sulphates, nitrates and organics, comprises the larger fraction of man-made particles and 50% of total natural particles. Volcanic emissions constitute a small (from 1 to 26%), yet significant, fraction of natural emissions especially since volcanic pollutant injections are high-intensity, short-term ones.
Table I Estimates of Global Particle Production from Man-Made and Natural Sources Representative of the 1970s*

The distribution of particle sources, both spatially and temporally, plays an important role in the atmosphere. This is because of several factors, as follows.
-
(1) The residence time of particles increases with altitude, from a few days to some weeks in the lower troposphere (up to 3 km), up to a month in the upper troposphere (from 3 to 10 km), and up to a year in the stratosphere (Reference JungeJunge 1977).
-
(2) There is a strong seasonal variation of particle residence time in the lower Arctic troposphere. Lifetimes are much longer in winter than in summer (Reference Rahn and McCaffreyRahn and McCaffrey 1980, Reference Barrie, Hoff and DaggupatyBarrie and others 1981).
-
(3) Owing to differences in the configuration of the glacial receptor and aerosot sources (Fig.1), the meteorological transport and pollutant removal regimes of Greenland, the Arctic and the Antarctic differ greatly.

Fig. 1 A comparison of the geographical configuration of northern and southern polar regions.
An important implication of factor (1) is that the influence of a volcanic eruption depends on the altitudinal level of pollutant injection into the atmosphere. If it remains in the troposphere, it will have a more intense, smaller-scale and shorter-term influence than if it were in the stratosphere. Factor (2) means that pollutants introduced to the Arctic troposphere in winter are more widely dispersed and longer-lived than in summer. The phenomenon of Arctic haze is a manifestation of longer atmospheric residence times in winter than in summer. In the Arctic atmosphere, concentrations of anthropogenic sulphate and trace elements from fossil fuel combustion and smelting are from 20 to 40 times higher in winter than in summer (Fig.2). This is described in more detail elsewhere (Reference Rahn and McCaffreyRahn and McCaffrey 1980, Reference Barrie, Hoff and DaggupatyBarrie and others 1981).

Fig. 2 The seasonal variation of anthropogenic sulphate and vanadium at Mould Bay, Canada (M in Fig.1) between 1979 and 1983.
Atmospheric transport delivers particles to snowfields where they are removed by precipitation (snow or rain) as wet deposition and by direct interaction at the air/snow interface as dry deposition. These processes of removal form the link between the concentration of atmospheric aerosols and the chemical composition of glaciers. They are complex, but it is the purpose of this paper to help bridge the gap in understanding between atmospheric chemistry and glaciology. This will be accomplished by describing the physical and chemical characteristics of aerosols that are pertinent to their removal from the atmosphere and then examining mechanisms of wet and dry deposition.
The Physical and Chemical Characteristics of Aerosols
The effectiveness of wet and dry removal processes in cleansing aerosols from the atmosphere strongly depends on the mass-size distribution. In general, the mass is distributed in three modes between 0.005 and 100 µm diameter (Fig.3). Each mode is maintained in a quasi-dynamic equilibrium by a unique set of sources and sinks. The nuclei mode (from 0.005 to 0.05 µm), at the lower end of the size range, originates from the condensation of unstable gases which are often formed photochemically in the atmosphere. Its sink is coagulation to form larger particles and removal by dry and wet deposition. The former is the main sink. At mid-range (from 0.05 to 1.0 µm) is the accumulation mode consisting of particles (i) released during fuel combustion and metal-processing activities, (ii) produced by the coagulation of smaller nuclei mode particles, (iii) formed by liquid or solid phase gas-to-particle conversion, and (iv) emitted from volcanoes. Its main sinks are wet and dry removal processes. At the upper end is the coarse-particle mode maintained by mechanical generation processes and volcanic emissions. The main sink, at least at the upper end of the mode, is sedimentation (the sedimentation velocity is proportional to the diameter squared, a unit density 100 μm sphere settles at 0.3 m s−1). It should be emphasized that there is considerable overlap between the coarse-particle and accumulation modes. Because the large particles in the coarse mode fall out faster than the small ones, the median of the coarse-particle mass-size distribution will shift towards smaller particles as the distance from the source increases. Thus in the Antarctic, which is remote from sources of wind-blown dust, the concentration and mass median diameter of soil dust will be lower than that shown in Figure 3 which is more typical of areas closer to continents.

Fig. 3 A schematic depiction of an atmospheric aerosol mass-size distribution showing the principal modes, the source of mass in each mode and the principal removal mechanisms (adapted from Reference WhitbyWhitby 1978). Note that the relative magnitude of each model is very dependent on source strengths and proximity to sources. In general, the nuclei mode is negligibly small in terms of mass.
The nuclei and accumulation modes, containing the so-called fine particles, are dynamically coupled by coagulation. They are not coupled to the coarse-particle mode. Consequently, the chemical composition of coarse particles is different from that of the fine particles. In general, coarse particles contain mechanically generated sea salt (Na, C1, Mg) and wind-blown dust elements (Al, Si, Fe, Ti) while more toxic elements (V, Cd, Pb, Ni, Cr, S), generated from high-temperature anthropogenic processes, accumulate on fine particles.
In remote regions, the nuclei mode is usually relatively small leaving most of the mass in the accumulation and coarse-particle modes. A comparison of mass-size distributions at remote surface locations (Fig.4) measured by Reference BiggBigg (1980) reflects these differences. At all locations, a coarse-particle sea-salt mode is evident. It is especially prominent at Cape Grim, Tasmania, which is on the coast in the roaring forties. At both poles, the aerosol has a dominant accumulation mode. However, the mass is greater at Barrow, in the Arctic, than at the South Pole. These results are confirmed by other observations (Reference Hogan, Barnard and BortiniakHogan and others 1979, Reference HeinzenbergHeinzenberg 1980, Reference ShawShaw 1984). In this case, the difference is due mainly to man’s influence, since the observations in the Arctic were made in recent years during winter when suspended particulate matter was comprised mainly of anthropogenic substances (Reference Barrie, Hoff and DaggupatyBarrie and others 1981). However, even before man’s influence was so great, microparticle loading of ice sheets was higher in the Arctic than in the Antarctic, This is due to the proximity of the Arctic to land while Antarctica is isolated by water (Fig.1), The fine-particle mass-size distribution at Mauna Loa is representative of a well-aged aerosol commonly found in the upper troposphere and lower stratosphere. The preponderance of anthropogenic sulphate salts in the accumulation mode and of sea salt in the coarse-particle mode of winter Arctic aerosol is clearly illustrated in Figure 5. The ion balance as a function of particle size is shown.

Fig. 4 The mass-size distribution of particles at (a) Barrow, Alaska, (b) Mauna Loa, Hawaii, (c) Cape Grim, Tasmania and (d) South Pole measured by Reference BiggBigg (1980).

Fig. 5 Cation and anion balance in suspended particles at Igloolik, Canada as a function of particle diameter D (Reference Hoff, Leaitch, Fellin and BarrieHoff and others 1983). Hydrogen ion is inferred from an ion balance. The dotted line represents the fraction of anion equivalents required to balance sodium and magnesium ions.
An important feature of airborne particles is their hygroscopicity. It is this property that leads to their incorporation into cloud and precipitation water (Reference Pruppacher and KlettPruppacher and Klett 1978) as well as to an enhancement of dry deposition at moist surfaces (Reference Slinn and SlinnSlinn and Slinn 1980). Observed variations in particle mass with relative humidity for common atmospheric aerosol constituents are shown in Figure 6. The ordinate is essentially the ratio of particle mass at high and low humidity. Note that there is a marked variation in growth characteristics dependent on the relative proportion of ![]() and H+ in sulphate salts. Growth of (
and H+ in sulphate salts. Growth of (![]() )2 SO4 undergoes a distinct discontinuity at 70 to 80% relative humidity as the dry salt crystal deliquesces to form a saturated solution droplet. In contrast, H2SO4 is an aqueous solution at all humidities. It grows continuously as humidity increases.
)2 SO4 undergoes a distinct discontinuity at 70 to 80% relative humidity as the dry salt crystal deliquesces to form a saturated solution droplet. In contrast, H2SO4 is an aqueous solution at all humidities. It grows continuously as humidity increases.

Fig. 6 Humidographs for pure laboratory-generated sulphate compounds measured by Reference Charlson, Covert, Larson and WaggonerCharlson and others (1978). The dashed curves are theoretical estimates. The vertical axis represents the amounts of particle light scattering at a finite relative humidity to that at zero relative humidity. This is equal to the ratio of particle mass.
All salts grow rapidly at high relative humidities. In clouds, where relative humidities are from 100 to 101% this leads to their incorporation into cloud water and eventually into precipitation. In remote regions, both accumulation and coarse-mode aerosol contain sufficient soluble salts to be hygroscopic. Accumulation-mode particles are often coated with sulphate salts which have either deposited as nuclei-mode particles or been formed by gas-to-particle reactions on their surfaces (e.g. Reference BiggBigg 1980).
Deposition Processes
Precipitation scavenging
In polar regions, aerosols are scavenged from the atmosphere by precipitation, following the sequence of processes depicted in Figure 7. Condensation of water on hygroscopic aerosols entering a cloud (step 1) leads to supercooled cloud drops containing soluble and insoluble aerosol constituents. The cloud drops have the unique property of remaining liquid at temperatures as low as –10 to –30 °C (i.e. supercooling). Typically in precipitation clouds, condensation takes place on particles of diameters >0.2 to 0.4 µm (Reference Pruppacher and KlettPruppacher and Klett 1978). The greater the supersaturation in a cloud is, then the lower the minimum particle size is. As seen from the mass-size distributions in Figure 4, 50 to 100% of the aerosol mass can be incorporated into cloud water at this stage. Upon nucleation of the ice phase in the cloud, the cloud water may now evaporate. Water vapor, driven by the difference in saturation vapor pressure over water and ice, diffuses from the drops to ice crystals (steps 2 and 3). The aerosols incorporated into cloud water during condensation are then returned to the atmosphere. Alternatively, the cloud water may be scavenged by large snow crystals (diameter >200 μm). This process is called riming. It is the collection by snow of supercooled cloud drops which are from 2 to 50 μm in diameter by inertial impaction and interception as the heavier snow crystals fall past the small drops. The cloud drops freeze upon contact. The aerosol mass in cloud water thereby enters precipitation and falls from the cloud.

Fig. 7 The precipitation scavenging process.
Aerosol particles that do not enter cloud water during condensation (Fig.7, step 1) or that are released during vapor growth of the ice phase (step 2) either leave the cloud or are scavenged by Brownian diffusion, electrical attraction and inertial impaction on snow crystals (steps 3 and 4). Precipitation leaving the cloud base can consist of rimed or unrimed snow crystals. We shall see below that storms with mostly unrimed snow crystals (i.e. scavenging steps 1, 2, 3 and 4) remove aerosols from the atmosphere much less efficiently than storms with rimed snow crystals (i.e. scavenging steps 1, 2, 3 and 4 and 1 and 4). Thus, the riming process is extremely important.
Snow crystals falling below the cloud base scavenge aerosols by the same mechanisms as they do within the cloud with the exception of the riming process and with the addition of phoretic forces caused by evaporation in the less-than-saturated air below the cloud. As an illustration of the complex processes involved in the ice crystal/particle interaction, consider the theoretical calculations of Reference Martin, Wang and PruppacherMartin and others (1980) in Figure 8. The particle collection efficiency of a simple plate-like ice crystal as a function of particle size, relative humidity and electrical charging is shown for ice crystals of two diameters. Collection efficiency is defined as the fraction of particles captured from a vertical column swept out by a falling ice crystal. The following features are noteworthy, (i) The dependence on particle size is minimal at particle diameters of 0.02 to 0.1 µm. Below that range, particles are more efficiently collected by Brownian diffusion, while above that range they are captured more efficiently by inertial impaction aided by electrical and phoretic forces (associated with evaporation), (ii) In the absence of electrical forces, ice crystals >450 μm diameter capture all particles >8 μm while those <450 μm miss the large particles. The latter effect is somewhat reduced by the presence of electrical charging. (iii) In the particle size ranges containing the main mass of atmospheric aerosol (i.e. diameter >0.1 μm) collection efficiencies of larger ice crystals (diameter 1278 μm) are much greater than those of smaller ones (diameter 426 μm). Furthermore, phoretic forces improve the collection of only the larger crystals while electrical attraction affects both ice-crystal sizes.

Fig. 8 The theoretical dependence of the collision efficiency of plate-like ice crystals and particles on particle size, electrical charging (q = charge density) and evaporation (RH = relative humidity). From Reference Martin, Wang and PruppacherMartin and others 1980.
There is little evidence available to check the above theory. The existing information applies to situations with no electrical charging, when good agreement is found.
The above theoretical results illustrate that even in the relatively simple case of a plate-like crystal which scavenges aerosols the collision efficiency strongly depends on crystal and aerosol size, on degree of charging, and on evaporation. Add to this an extremely variable ice-crystal shape (Reference Bentley and HumphreysBentley and Humphreys 1962, Reference Pruppacher and KlettPruppacher and Klett 1978) and one is left with a complicated situation to handle, either theoretically, experimentally, or observationally.
Considering the complexity of the microphysical processes involved in precipitation scavenging and the variability in macroscopic features of storms (e.g. thunderstorms, frontal storms, orographic clouds), as well as in the vertical distribution of atmospheric aerosols, it is not surprising that empirical descriptions of scavenging processes based on observations have been necessary for practical purposes. For instance, one often needs to estimate the concentration of a substance in precipitation on the basis of its concentration in the atmosphere, the precipitation amount, and microphysical factors such as whether the storm is rimed or unrimed. A common approach is based on the simple premise that the concentration of a substance in precipitation, C (mol kg−1), should depend on its concentration in the air, K (mol kg−1), within which the precipitation forms. The scavenging ratio W is defined as follows:
Precipitation concentrations are essentially normalized by air concentration to reduce the variability in observations. The concentrations used to calculate W are usually obtained from ground-based observations and are averages for a period of several hours to several months In general, the variability in W decreases as averaging time increases. Thus the variance in daily scavenging ratios is much greater than that in annual ratios. The concept of scavenging ratio has been widely used to calculate the scavenging of radioactive, sea-salt and anthropogenic particulate matter from the atmosphere (Reference GatzGatz 1976, Reference JungeJunge 1977, Reference SlinnSlinn 1977, Reference ScottScott 1981, Reference Lambert, Ardouin, Mesbah-Bendezu, Pruppacher, Semonin and SlinnLambert and others 1983, Reference Barrie, Neustaedter, Pruppacher, Semonin and SlinnBarrie and Neustaedter 1983, Reference Hidy, Countess and HicksHidy and Countess 1984, Reference BarrieBarrie 1985).
Although there are numerous measurements of W for rain, few studies of scavenging by winter snowstorms have been made. One of these studies was made by Reference ScottScott (1981) on the eastern shore of Lake Michigan. He examined the dependence of non-sea-salt sulphate scavenging ratio on precipitation rate and on the degree of riming (Fig.9). The averaging time of observations was several hours. W for rimed snow (150 to 3000) is from 10 to 50 times higher than for unrimed snow (20 to 400). Furthermore, the inverse dependence on precipitation rate is much greater for unrimed than for rimed snow. Similar observations for a daily averaging period in eastern Canada (Fig.10) yield W values of 150 to 7000 which are, on average, comparable to Scott’s observations for rimed snow. An inverse dependence on precipitation amount P is indicated.
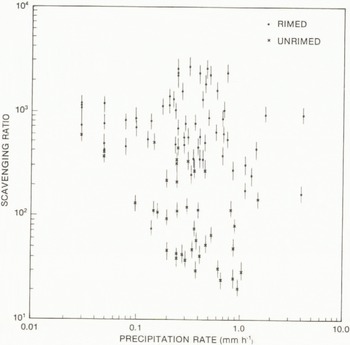
Fig. 9 The sulphate scavenging ratio averaged over several hours as a function of precipitation rate for rimed and unrimed snowfalls (Reference ScottScott 1981).

Fig. 10 The daily average sulphate scavenging ratio of snow in eastern Canada as a function of precipitation amount (Reference BarrieBarrie 1985).
In general, scavenging ratios in polar regions are obtained from the concentration of a substance in a glacial core (corrected for dry deposition) and observed ground-level air concentrations averaged for the period of time represented by the core. Such measurements in the Antarctic by Reference Lambert, Ardouin, Mesbah-Bendezu, Pruppacher, Semonin and SlinnLambert and others (1983) for Pb210, a particulate constituent of continental origin, yielded a long-term mean W of 535 to 724. Since Pb210 and anthropogenic ![]() have similar mass-size distributions (i.e. mainly fine particles) and similar sources at the Earth’s surface, suggesting similar vertical profiles, a comparison of these observations with those in Figure 9 is warranted. It suggests that the snow that delivers most of the pollutants to the locations in Antarctica mentioned by Reference Lambert, Ardouin, Mesbah-Bendezu, Pruppacher, Semonin and SlinnLambert and others (1983) consists of rimed crystals. There was also evidence that Sr90, which originates in the upper atmosphere, has higher scavenging ratios (877 to 1451) than Pb210 (535 to 724). This is likely because its concentration increases with increasing height in contrast to that of Pb210 and
have similar mass-size distributions (i.e. mainly fine particles) and similar sources at the Earth’s surface, suggesting similar vertical profiles, a comparison of these observations with those in Figure 9 is warranted. It suggests that the snow that delivers most of the pollutants to the locations in Antarctica mentioned by Reference Lambert, Ardouin, Mesbah-Bendezu, Pruppacher, Semonin and SlinnLambert and others (1983) consists of rimed crystals. There was also evidence that Sr90, which originates in the upper atmosphere, has higher scavenging ratios (877 to 1451) than Pb210 (535 to 724). This is likely because its concentration increases with increasing height in contrast to that of Pb210 and ![]() which decreases with increasing height.
which decreases with increasing height.
Scavenging ratios for rain tend to have a marked dependence on particle size (Reference GatzGatz 1976). They increase as the particle size increases. Little information exists for snow. This remains an area for more research. For another earlier perspective on precipitation scavenging processes, readers are referred to Reference JungeJunge (1977) which, like this paper, was aimed at bridging the gap between atmospheric chemists and glaciologists.
Dry deposition
Particles can interact directly with the Earth’s surface by means of various processes which depend strongly on particle size. These include Brownian diffusion particle impaction/interception and sedimentation. It is convenient to view the exchange of particles between the atmosphere and a snow surface using a two-layer model and an electrical resistance analog (Reference Ibrahim, Barrie and FanakiIbrahim and others 1983). This is depicted in Figure 11. The flux of particles per unit surface area F to the surface across the turbulent surface boundary layer which may be from 10 to 100 m deep and a viscous sub-layer from 0.1 to 1 mm deep is related to the concentration of aerosol, KZ(mol m−3), at some reference height Z as follows:
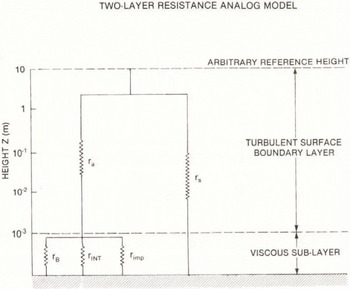
Fig. 11 A schematic diagram of the two-layer, electrical analog model used to represent dry deposition processes in snow. For explanations of the various resistances see Table II.
where VD is the deposition velocity. Its inverse is a total resistance to transfer rT given by a number of resistances associated with different transfer processes (Table II) acting in the configuration shown in Figure 11. An additional factor which affects all resistances by altering the particle size is hygroscopic growth in the moist near-surface sub-layer (Reference Slinn and SlinnSlinn and Slinn 1980).
Table II Resistances to Particle Transfer Between Atmosphere and Snowpack that are Operative in the Dry Deposition Process (see Fig.11)

These processes result in a deposition velocity of magnitude and particle size dependence shown in Figure 12. Very small particles (<0.05 µm) are deposited by Brownian diffusion while large particles (>20 μm) are removed by sedimentation. Between these ranges, sedimentation, inertial impaction and interception influenced by hygroscopic growth of particles in the moist near-surface layer determine the deposition velocity. Comparison with theory of observed values of VD when Z = 10 cm for particles of (NH4)2SO4 of diameter 0.7 μm shows that hygroscopic growth is necessary for agreement. The observed deposition velocity is 0.05 to 0.1 cm s−1.

Fig. 12 The theoretical dependence of dry deposition velocity of particles in snow on particle size for different relative humidities. The two points are observations representing the mean of five measurements of the deposition of particles of (NH4)2SO4 of 0.7 ± 0.3 µm diameter to snow (Reference Ibrahim, Barrie and FanakiIbrahim and others 1983).
Often values of VD are evaluated from Equation (2) by dividing the total mass flux of a substance carried to the surface in a polydisperse aerosol by the total concentration at height Z. VD is given by:

KZ(D) is the aerosol mass-size distribution function and D is the particle diameter.
VD is a representative deposition velocity for a particular mass-size distribution, rather than a particular particle diameter. Most of the deposition velocities reported in the literature are of this kind. Since deposition velocity increases rapidly with particle size throughout the accumulation and coarse-particle mode, most of the deposition associated with a particular mode is carried by particles in the upper tail of the distribution, not by those near the mass median diameter. Care should therefore be taken when comparing observed VD values to theoretical ones such as those in Figure 12.
Observations of VD for anthropogenic aerosol constituents in the accumulation mode (Ag, As, Cd, Cu, Ni, Cr, Pb, Zn) and for natural aerosol constituents in the coarse-particle mode (Ca, Fe, K, Mg, Ti) in Greenland (Reference Davidson, Chu, Grimm, Nasta and QamoosDavidson and others 1981) yield VD values of from 0.06 to 0.1 cm s−1 and from 0.1 to 0.5 cm s−1, respectively. The results agree reasonably well with the theory and observations in Figure 12.
The Relative Importance of Wet and Dry Removal
The total flux of a substance to a snow surface FT is the sum of wet and dry deposition. Using Equations (1), (2) and (3) this is given by the following expression:
where ρa is the density of air and R is precipitation rate. One can define a wet VW and total VT deposition velocity which are analogous to the dry deposition velocity. Then, it follows from Equation (4) that:
where R is the accumulation rate of precipitation and ρa is air density and that
A comparison of each of these deposition velocities and the fraction of total deposition made up of dry deposition (i.e. VD/VT) for unrimed and rimed snowfall is made in Table III. R was assumed to be 200 kg m−2 a−1 which is in the middle of the range from 150 to 500 kg a−5 in the Arctic, Greenland and Antarctica (Reference HerronHerron 1982). The results for rimed rather than unrimed snowfall agree best with the observations of Reference Davidson, Chu, Grimm, Nasta and QamoosDavidson and others (1981) in southern Greenland. They estimate an annual mean VT of 0.5 cm s−1 and that VD/VT for fine particles is less than 25%. The corresponding estimates in Table III are from 0.56 to 0.68 cm s−1 and 14%, respectively. If unrimed snowfall were predominant, VT would be 3 or 4 times smaller and dry rather than wet deposition would be the dominant removal mechanism. Of course, if R were much smaller than 200 kg m−2 a−1 the importance of dry deposition would be greater.
Table III A Comparison of Wet, Dry and Total Deposition Velocities of Fine and Coarse Particulate Matter for Rimed and Unrimed Snowfall on an Annual Basis

It has been reported that the concentration of non-sea salt sulphate in glaciers in Greenland and Antarctica varies inversely with R (Reference HerronHerron 1982). The relationship is a spatial one involving numerous locations as opposed to a temporal one involving one location such as that in Figure 9. One must be cautious in the interpretation of this observation for there are several possible causes that include (i) the inverse dependence of W on R (Fig.9), which is characteristically observed in precipitating clouds at one location, (ii) a coincidental inverse correlation of airborne pollutant concentration with R, and (iii) the increasing importance of dry deposition as R decreases. The pollutant concentration in glaciers Cg is given by:

Thus as R decreases the term for dry deposition becomes dominant and Cg is proportional to R−1.
From the discussion earlier in this section and the results in Table III, it is apparent that, in the case of rimed snowfall, it is only when R is below 50 and 100 kg m−2 a−1 for fine and coarse-particles, respectively, that dry deposition becomes dominant and factor (iii) is important. Variation of C with R for larger accumulation rates would probably be due to factors (i) and (ii). However in the case of unrimed snowfall dry deposition will be important at accumulation rates >50 to 100 kg m−2 a−1.
Conclusion
Wet and dry removal processes are an important link in the chain between atmospheric particulate sources and glacial receptors. They are strongly dependent on particle size which in turn varies from 0.005 to from 20 to 100 μm in the atmosphere. They also depend on a chemical property of the aerosol, namely, its hygroscopicity. Empirical parameterizations of precipitation scavenging and dry deposition (viz. W and VD) can be used to estimate total deposition knowing the particulate mass concentration, the particle mass-size distribution and precipitation rate. The estimate is more accurate for longer averaging times. Except in cases of low annual accumulation of snowfall (i.e. <60 kg m−2 a−1) or exceptionally large particles that can be emitted by volcanoes or when unrimed snowfall predominates, most particulate material deposited in the course of a year comes down in precipitation. That is, dry deposition plays a minor role.


