


Epidemiological investigations of diet in India are rare and appear to be hindered by insufficient dietary assessment tools and nutrient databases to capture data on the wide variety of Asian-Indian foods and regional recipes. The ongoing epidemic of diabetes and other diet-related chronic diseases burdening Asian-Indian populations within India and abroad( Reference Enas, Mohan and Deepa 1 – Reference Wild, Roglic and Green 3 ) cannot be adequately addressed without widely applicable and effective research tools to measure dietary intakes in these at-risk populations. Diverse dietary practices linked to India's unique religious and socio-economic heterogeneity may provide information on a wide range and variety of food and nutrient intakes as well as on vegetarian diets and use of distinctive spices, oils and pulses( Reference Padmadas, Dias and Willekens 4 – Reference Rastogi, Reddy and Vaz 6 ). Such data could provide insights into diet–disease relationships and contribute to the development and refinement of international dietary recommendations with a stronger emphasis on health promotion and disease prevention globally.
In an effort to begin to address these needs, we conducted a multicentre pilot study designed to assess the feasibility of establishing a prospective diet and cancer cohort, known as the India Health Study (IHS( Reference Sinha, Daniel and Devasenapathy 7 , Reference Mathew, Daniel and Ferrucci 8 )). Although other methods of diet assessment were available at the time( Reference Sudha, Radhika and Sathya 9 – Reference Hebert, Gupta and Mehta 19 ), none adequately captured data on Indian foods, particularly local and regional foods; Indian nutrient databases( Reference Gopalan, Rama Sastri and Balasubramanian 13 , 20 , 21 ) either were out of date or included information on only a limited number of common foods and recipes. The overall objective of the nutritional component of the IHS was to develop and test a modern and adaptable dietary assessment instrument that could be easily implemented in the field, but would also comprehensively capture the regional, ethnic, religious and socio-economic heterogeneity of dietary habits within India. Herein, we describe the development of a simple but flexible software program to assess habitual diets via complementary platforms (diet history questionnaire (DHQ) and multiple 24 h recalls (24HR)), the necessary details it can collect and how we created a collated nutrient database of regional Indian foods and recipes. We also provide preliminary data that are useful to make decisions on the type of dietary instrument to use in the Indian population as well as future studies of South Asians.
Methods
Study subjects
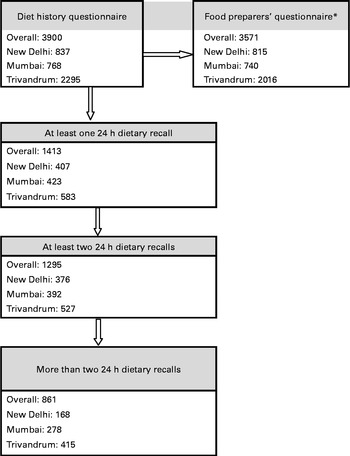
The IHS was a multicentre pilot study designed to investigate the feasibility of establishing a diet and cancer cohort in India, and it has been described in detail elsewhere( Reference Sinha, Daniel and Devasenapathy 7 , Reference Mathew, Daniel and Ferrucci 8 ). Briefly, the study was conducted between December 2006 and July 2008 in participating centres spread across three regions of India: New Delhi in the north (All India Institute of Medical Sciences and Centre for Chronic Disease Control), Mumbai in the west (Healis-Sekhsaria Institute for Public Health) and Trivandrum in the south (Regional Cancer Center). Centres were selected in areas with established cancer registries and to capture a range of different economic, ethnic and urbanisation patterns( Reference Sinha, Daniel and Devasenapathy 7 , Reference Mathew, Daniel and Ferrucci 8 ). The household sampling scheme has been described in detail elsewhere( Reference Sinha, Daniel and Devasenapathy 7 ). Briefly, we recruited diverse religious groups known to follow varied patterns of diet and lifestyle practices and targeted both urban and rural areas in Trivandrum. Healthy adults (aged 35 to 69 years) proficient in English or regional language were eligible to participate and provided sociodemographic, diet and other lifestyle information upon enrolment via interviews conducted by trained field staff in their homes. Of the 4177 eligible IHS participants, 94 % (n 3908) completed the DHQ. Fig. 1 shows the number of participants for the other nutritional components. Following further data cleaning, eight participants were excluded from the DHQ analysis (n 3900) for reporting less than ten total food items in the DHQ. An additional thirty-eight participants (n 3862) were excluded from the nutrient analysis due to improbable total energy intake (outside of three standard deviations). The present study was conducted according to the guidelines laid down in the Declaration of Helsinki, and all procedures involving human subjects were approved by the human ethics committees from each study centre, the Special Studies Institutional Review Board of the US National Cancer Institute and the Indian Health Ministry Screening Committee (part of the Indian Council of Medical Research reporting to the Government of India).
Number of the India Health Study participants who completed the diet history questionnaire, 24 h dietary recall and food-preparer questionnaire. * Food preparers' information from the number of households (Delhi: n 815; Mumbai: n 629; Trivandrum: n 2016).
Dietary assessment
The New Interactive Nutrition Assistant – Diet in India Study of Health (NINA-DISH) software (Fig. 2), which was adapted from the software originally developed by Novo Nordisk Pharma India( Reference Kapur, Kapur and Prakash 22 ), is designed such that it can be ported into any database with minimal modification. The application was designed using the following three approaches: User Interface; Business Logic; the Database. It was developed using the DOTNET FRAMEWORK version 1.1 (Microsoft Corporation) C# and ASP.NET Languages (Microsoft Corporation) and MS SQL SERVER (Microsoft Corporation) and ORACLE as DATABASE (Oracle RDBMS; Oracle Corporation).
Details of the NINA-DISH (New Interactive Nutrition Assistant – Diet in India Study of Health) software. (A colour version of this figure can be found online at http://www.journals.cambridge.org/bjn)
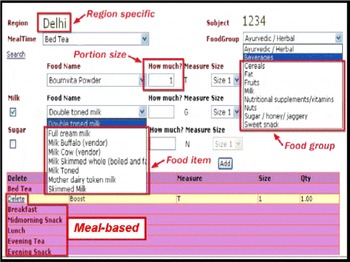
The NINA-DISH software consists of four sections: (1) defined questions on frequency and portion size, similar to a FFQ; (2) an open-ended section for each mealtime; (3) a food-preparer questionnaire; (4) a 24 h dietary recall. The DHQ comprised the first two sections and was specifically designed to collect comprehensive dietary intake data over the past year in IHS participants residing in the three different regions.
Diet history questionnaire
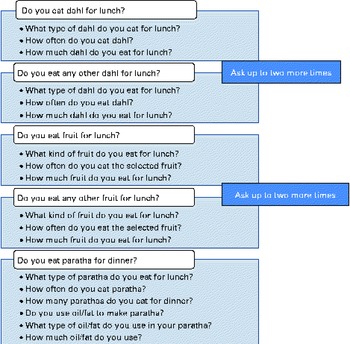
In the developmental phase, small pilot studies were conducted in each of the three regions to develop region-specific food lists for the DHQ component. In a convenience sample of approximately twenty to thirty-five individuals in each region, 24HR were administered to identify the most commonly consumed foods and beverages at various mealtimes and snack times, as well as potential seasonal variation in fruit and vegetable intakes. A meal-based approach was found to be more user-friendly for the interviewers and cognitively acceptable for the participants in this population. Other cognitive studies of a computerised dietary recall in the USA have also revealed a strong preference for a meal-based approach( Reference Subar, Thompson and Potischman 23 ), as it helps the participants to first relate to a meal occasion, for example, breakfast, and then to access and select the foods from their memory that they typically eat for breakfast. While designing the software, it was also more advantageous to include certain foods typically associated with a particular meal in a drop-down menu rather than searching the full database (Fig. 3). However, in India, people tend to eat similar food items across different meal occasions throughout the day (e.g. rice), as reflected in the overall limited number of food items reported (Table 1). The NINA-DISH software also allowed the interviewers to link the same food items consumed at multiple meal occasions throughout the day.
Sample of questions included in the diet history questionnaire. (A colour version of this figure can be found online at http://www.journals.cambridge.org/bjn)
Number of food items queried and reported in the diet history questionnaire (DHQ) and 24 h recalls (24HR) (Medians with their 10th and 90th percentiles)
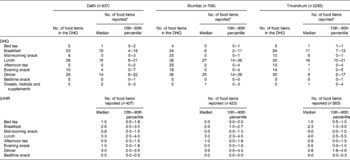
* Main food items only, excluding foods used with main items (e.g. milk and sugar used with tea).
The final version of the software for the DHQ queried dietary intake over the past year and included a selection of 910 food items over eight mealtimes (bed tea, breakfast, mid-morning snack, lunch, afternoon tea, evening snack, dinner and bed time snack; Figs. 2 and 3). Items displayed in the drop-down menu were customised for each region, and the number of additional queries also varied between regions from 157 to 216. An open-ended section with prompts for each mealtime was also included in the software to allow the participants to provide information on other food items that were not included in the DHQ's predefined lists or drop-down menu.
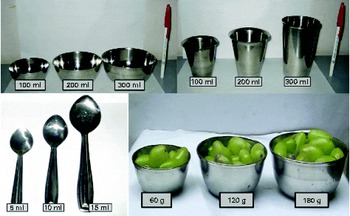
The DHQ was structured to first capture data on the type of food consumed at each mealtime (e.g. fruit), followed by details of the individual type of food (e.g. banana), frequency of consumption (e.g. daily, weekly and monthly) and the quantity or portion size (Fig. 2). A sample of questions included in the DHQ is shown in Fig. 3. For some of the questions, we followed the nesting approach( Reference Subar, Thompson and Potischman 23 ) of asking about the addition of a food item in relation to the main food (e.g. the addition of milk and sugar to tea). The interviewers provided standard props to aid the participants in portion size estimation (Fig. 4). These included different sizes and types of household measures, such as glasses, katoris (bowls) and spoons, as well as cardboard cut-outs (e.g. five sizes for chapatti/dosa/paratha) and fruit photographs (three sizes: small, medium and large). The final section of the DHQ specifically queried about the intake of sweets and the use of multivitamins and mineral and herbal supplements, as well as Ayurvedic medicines.
Utensils and food models for capturing dietary data. (A colour version of this figure can be found online at http://www.journals.cambridge.org/bjn)
The software was also designed to facilitate simple dietary analyses and food group comparisons. Responses to the DHQ were linked to a food database classified into twenty general food groups (i.e. beverages; cereals; chutney, soups and condiments; confectioneries, syrups and chocolates; curry vegetables; dry vegetables; fast food; fats and oil; fruit; green vegetables; juice and soft drinks; liquor; meat, fish and chicken; milk; nuts; pulses; salad; savoury snacks; sugar, honey and molasses; and sweet snacks). Food items under each of these groups were further categorised and coded into a total of twelve broader ‘food categories’ (Appendix 1, available online). For example, we can evaluate total cereal or subgroups of cereals, such as wheat and rice, separately or be more specific and evaluate fermented rice. Similarly, for vegetables, we can evaluate total vegetables or cruciferous v. allium vegetables( Reference Daniel, Prabhakaran and Kapur 24 ).
Food-preparer questionnaire
A detailed description of the food-preparer component of the NINA-DISH software is available elsewhere( Reference Ferrucci, Daniel and Kapur 25 ). Briefly, this portion of the computer-assisted interview was completed by the individual within the household who was primarily responsible for purchasing and preparing food for the family. This novel method for assessing food items primarily added during cooking allowed us to estimate per capita consumption of nineteen spices, chilies, coconuts, garlic, onions and thirteen cooking oils among 3625 participants.
24 h recall
The computer-assisted 24HR was designed to collect data on food and beverage intakes, as well as portion size, for the day before the interview, starting from the time the participants woke up in the morning until the time they went to bed. In order to better understand the eating habits of the study population, we designed the 24HR component to first record the different times the participants ate throughout the day, followed by queries on what type of meal they ascribed to that eating occasion. For example, many working Indians consume a main meal akin to a lunch at 09.00 hours, but only a snack at ‘lunchtime’. As in the DHQ, the foods were classified into eight mealtimes with the appropriate food options readily available from the drop-down menu. To account for variation in dietary intakes by season and day of the week (weekday v. weekend), up to four recalls over three weekdays and one weekend were administered to a subset of the participants during a six-month period (Fig. 1).
Nutrient database
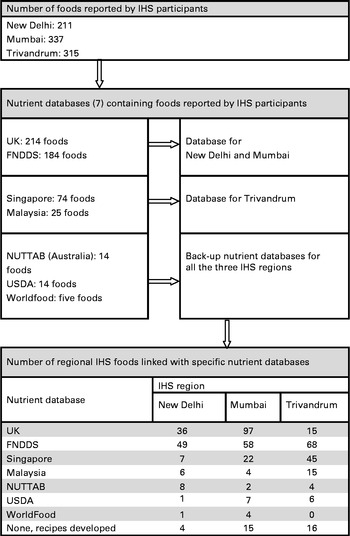
There is no single up-to-date and comprehensive Indian food and nutrient database currently available for estimating the nutrient values of regional Indian foods( Reference Rastogi, Hildesheim and Sinha 5 ); thus, to create a single, cohesive NINA-DISH nutrient database, we pooled the relevant data from seven international databases we identified that contained data on Indian foods and recipes in 2009 (Appendix 2, available online). Given the wide variety of foods reported by the study participants and to fill critical gaps, IHS investigators also carried out additional reconstruction and updating of Indian recipes.
The process of compiling the NINA-DISH database is shown in Fig. 5. As we had to use databases from several different countries containing information on similar Indian foods, we developed matching criteria to select the most culturally relevant representative of a regional food or recipe preparation. Many of the pre-existing databases that we identified represented countries where Indians from particular regions commonly immigrate. For example, the nutrient databases of Malaysia or Singapore are more likely to reflect the ingredients and regional cooking practices of Trivandrum (e.g. payasam, murukku and masala dosa), while the UK database is more likely to reflect the ingredients and regional cooking practices of New Delhi and Mumbai (e.g. chana, aloo-matar and khichdi). Additionally, the US database and the Food and Nutrition Database for Dietary Studies (FNDDS) were used for items common to the three regions (e.g. fruit juice, eggs and doughnut). Additionally, we developed a total of thirty-five recipes (e.g. avial, bhel-puri, pav bhaji, pani puri, modak and modakam, puran poli and several types of appams), as we could not source reasonable data for these foods in the available databases. Although we found it necessary to develop recipes for all the three regions, we found the current databases to be the most lacking with regard to data on the foods reported in Trivandrum. For each nutrient, we used a standardised unit of measurement and reported values per 100 g of the edible portion of the food product( 26 , Reference Subar, Midthune and Kulldorff 27 ).
Identification and selection of nutrient databases for the foods reported by the India Health Study (IHS) participants. FNDDS, Food and Nutrition Database for Dietary Studies; NUTTAB, Nutrition Tables; USDA, US Department of Agriculture.
Quality control
Many layers of quality-control steps were instituted to minimise possible errors in data collection and analysis. The study nutritionist trained field staff in interview techniques for dietary assessment and use of food models for assessing portion sizes and unique regional food items. Each interviewer was required to have working knowledge of computers to operate the NINA-DISH software on portable laptops. During the field component of the study, project leaders made unannounced visits to observe the interviews being conducted. Each 24HR was checked by the study nutritionists after it was collected, and any questionable entry was re-queried. Daily random checks for errors were also done for the DHQ. In preparation for analysis, the dietary data were edited to revise updated food items, resolve duplicated entries and identify new foods for review and inclusion in the nutrient database. Field and cross-field checks were also done to identify problematic values or inconsistencies in the data items being analysed.
Statistical analysis
Descriptive statistics by region, including means, medians, and 10th and 90th percentiles, were generated using the PROC MEANS and PROC UNIVARIATE procedures in SAS version 9.1.3 (SAS Institute, Inc.).
Results
Table 1 reports the number of foods queried and reported in the DHQ and 24HR by region and mealtime. In all the regions, the greatest numbers of food items were reported for the three main meals, namely breakfast, lunch and dinner. Participants in New Delhi appeared to consume slightly more foods between main meals, while consuming a mid-morning or an evening snack was rare in Mumbai and Trivandrum. Including more food items in the DHQ queries (tailored to each region to capture data on unique regional foods) resulted in a greater number of foods being reported. Including repeat queries for certain foods (as shown in Fig. 3) increased the number of food items being reported substantially (i.e. 30·1 % for Delhi, 44·9 % for Mumbai and 12·4 % for Trivandrum).
Table 2 reports the number of food items reported and time taken to complete the DHQ and 24HR by various demographic factors. Across all the regions, the DHQ was generally completed within 20 min to 1 h, while a single 24HR was generally completed by the interviewer and participant within 10 min or less. The number of food items reported and the median time taken for the participants to complete the DHQ and 24HR interview varied by age, sex, income or education level. Patterns in the number of food items by region, mealtime and demographic factors were similar between the DHQ and 24HR. Across the three regions, the participants reported a total of 576 unique food items (Fig. 5).
Number of food items reported and time taken to complete the diet history questionnaire (DHQ) and 24 h recalls (24HR) by demographic factors (Medians with their 10th and 90th percentiles)

* Recalls with large gaps were excluded. Recall values for each individual were averaged across their recalls.
The top five foods that contributed to the derived nutrient values in this population are provided in Table 3. Commonly consumed foods across all the three regions, such as roti (a flat wheat bread), rice and mixed-curry dishes, contributed largely to macronutrient intake, but we also observed regional differences. For example, in Trivandrum, 35 % of total energy intake was captured with the assessment of rice intake, while in New Delhi, 28 % of total energy intake came from roti. In Mumbai, major contributors to total energy intake were more varied, with roti and rice contributing 13 and 8 %, respectively. The contributions of meat or fish to nutrient intake also revealed interesting regional differences. For example, fish dishes were a key contributor to the intake of several essential macro- and micronutrients in Trivandrum, while dairy products were unique contributors in New Delhi. Food contributors to nutrient values did not differ substantially by sex (data not shown).
Top five food item contributors from the diet history questionnaire to nutrient values by region

Discussion
To facilitate epidemiological research on diet and disease risk in India, we developed and tested a comprehensive dietary assessment tool to capture data on food and nutrient intakes within three diverse regions of India. In the developmental phase, we identified a number of unique regional foods and found that a meal-based approach was more user-friendly for the interviewers and cognitively acceptable for the participants. In the field, the interactive NINA-DISH software allowed the field staff of the IHS to successfully and efficiently collect dietary data via computer-assisted, in-person interviews. The comprehensive nature of the pilot study resulted in the inclusion of over 1000 unique foods and mixed dishes across the three regions; however, the software can be easily adapted to include additional new food items. We found informative differences in the number of food items reported at different times of the day and in the time needed to complete the DHQ and 24HR among different sociodemographic groups. Using a nutrient database that we developed by collating and updating data from several international resources, we identified major food contributors to nutrient intake across the regions, which provided practical information on the most important food items to assess within the Indian population.
We found the meal-based approach for the NINA-DISH software to be particularly useful and informative in this population. Although this requires more time than that required to complete a food-based FFQ from the respondent, it provides more cognitive support for the recall process, particularly when interviewer administered and combined with a nesting approach( Reference Subar, Thompson and Kipnis 28 – Reference Thompson, Subar and Brown 30 ). In conjunction with the meal-based approach, the 24HR and the open-ended queries in the DHQ provided the participants an opportunity to ascribe foods to a particular mealtime and to report foods that were not in the database. This provided useful information to improve the efficiency and performance of the NINA-DISH software, which is easily modified, adapted and updated.
A predominant three-meal eating pattern emerged with some differences by region and demographic factors including age, income and urban–rural residence. The difference in the number and type of foods reported by the participants in the DHQ and 24HR was probably due to several factors. Differences in the number of food items across demographic factors may reflect differences in access to food and other resources, as the present results suggested that individuals of higher socio-economic status and younger age and/or living in an urban area consumed a wider variety of foods. However, participants in all the three regions did not eat a large variety of foods during the day and also appeared to eat many of the same foods during different meal occasions. For example, rice or roti may be typically eaten at breakfast, lunch and dinner, and snacking between meals was relatively infrequent.
No single nutrient database available was adequate to capture up-to-date and comprehensive nutrient profiles of local Indian foods and regional dishes. Thus, the nutrient database for the present study was compiled from various nutrient databases throughout the world containing data on South Asian or Asian-Indian foods. Although recent nutrient data for India are limited, the food and nutrient profiles that we found in the Indian population( Reference Sinha, Daniel and Devasenapathy 7 , Reference Daniel, Prabhakaran and Kapur 24 ) are generally in line with other published studies of dietary intakes conducted in India( Reference Rao 31 – Reference Shetty 34 ). Staple carbohydrate dishes were the primary contributors to total energy intake across each of the regions and corroborate the starch-based nature of the Indian diet( Reference Rao 31 , Reference Misra, Khurana and Isharwal 33 ). Within South Asian populations, both an excess and a deficiency of nutrients have been associated with highly prevalent risk factors for chronic diseases, such as insulin resistance, dyslipidaemia and inflammation( Reference Rao 31 , Reference Misra, Khurana and Isharwal 33 , Reference Chatterjee 35 ). More specifically, dietary concerns include a low intake of ‘good fats’ (MUFA and n-3 PUFA) and fibre, combined with a high intake of ‘bad fats’ (mainly SFA and trans-fatty acids) as well as refined carbohydrates and sugars( Reference Misra, Khurana and Isharwal 33 , Reference Lawton, Ahmad and Hanna 36 , Reference Singh, Rastogi and Rao 37 ).
Major strengths of the IHS and the design of nutritional component were the use of trained interviewers for conducing interviews at the participants' homes and the inclusion of three diverse regions of India. Using these methods, we were able to identify important aspects of dietary variability, such as unique and understudied regional foods and recipes in a population with a wide range of intakes and great access to food resources. However, it is important to note that our sampling scheme and recruitment methods( Reference Sinha, Daniel and Devasenapathy 7 ) may have decreased the external validity of the study population, as we did not include individuals in temporary housing or of very low socio-economic status from urban areas, due to potential issues with very limited dietary variability and major challenges with follow-up, particularly for medical outcomes( Reference Mathew, Daniel and Ferrucci 8 ).
With the understanding that all dietary assessment instruments are subject to limitations and measurement error, the NINA-DISH software was developed to facilitate a multifaceted and comprehensive approach (i.e. DHQ, food-preparer questionnaire and multiple 24HR) for measuring dietary intakes. Previous research has shown that such an approach is likely to improve the reliability of the overall estimates of intake by utilising the strengths of multiple dietary assessment methods( Reference Carroll, Midthune and Subar 38 ). While this would often be considered time- and cost-prohibitive, the computer-based NINA-DISH software proved to be efficient in terms of both data collection (front end) and analysis (back end) for the study staff. It is important to note that the NINA-DISH software was adapted and designed for use in a prospective epidemiological study of diet and cancer. Thus, priority was placed on capturing long-term or habitual diet and population variations, along with a reasonable estimate of individual intake. Previous analyses have demonstrated that the NINA-DISH dietary assessment tool successfully captures regional differences in dietary patterns( Reference Daniel, Prabhakaran and Kapur 24 ), as well as data on a wide range of and variation in intakes of various foods, nutrients, spices and oils across this diverse, middle-class population( Reference Sinha, Daniel and Devasenapathy 7 , Reference Ferrucci, Daniel and Kapur 25 ). We realise that our nutrient database collated and modified from other international data sources is not optimal. However, given the limitations of what was available at the time, we feel that what we have created is both a vast improvement and urgently needed. Although the NINA-DISH software will need to be carefully validated in this and other South Asian populations, we met our initial objective to create a dietary assessment tool that was culturally appropriate and helpful to better understand the dietary habits of an understudied population at a high risk of developing chronic diseases. Our findings from the IHS nutritional component are intended to guide investigators in important aspects of designing dietary questionnaires and to provide useful insights for future studies within this and similar South Asian populations.
Conclusion
We developed and tested comprehensive dietary assessment tool and nutrient database to capture data on food and nutrient intakes within three diverse regions of India. We found that the computer-based NINA-DISH dietary software allowed the field interviewers of the IHS to successfully and efficiently collect dietary data via the DHQ and 24HR from the study participants in both urban and rural settings. We identified the preferred ‘meal-based’ approach and found informative differences in the number of food items reported at different times of the day and in the time needed to complete the DHQ and 24HR among different sociodemographic groups. While studying the major food contributors to nutrient intake across the regions, we identified many of the most important food items to assess within the Indian population. The NINA-DISH software can be relatively easily updated and modified and may provide a valuable resource for measuring dietary intakes in South Asian populations in other parts of the world, as well as among those who have recently immigrated to other countries, such as Canada, Fiji, Kuwait, Malaysia, Saudi Arabia, Singapore, the UK and the USA. Further research on Indian diet and lifestyle is urgently needed to develop targeted recommendations to address the emerging epidemics of chronic diseases as well as ongoing challenges of under- and overnutrition in India( Reference Popkin, Horton and Kim 2 , Reference Shetty 34 , 39 , Reference Griffiths and Bentley 40 ).
Supplementary material
To view supplementary material for this article, please visit http://dx.doi.org/10.1017/S0007114513001864
Acknowledgements
We thank Novo Nordisk Pharma India Limited for permitting us to use and adapt the NINA software for the present study. We also thank all the participants and field investigators of the IHS. This research was supported by the Intramural Research Program of the National Institutes of Health, National Cancer Institute. The authors' responsibilities were as follows: C. R. D. was responsible for the statistical analysis, interpretation of results and writing of the manuscript; K. K. developed the diet assessment questionnaire, nutrient database and software and wrote the manuscript; M. J. M. was responsible for data analysis and writing; S. D.-J. developed the nutrient database and wrote the manuscript; H. S. developed the region-specific diet assessment questionnaire and implemented the study; N. D. and P. S. G. were responsible for study implementation; S. H. developed the NINA-DISH software; A. M. was responsible for site-specific study coordination and implementation; R. S. designed and initiated the study and secured funding for the study, interpreted the results and wrote the manuscript. All authors were responsible for the critical review and approval of the final manuscript. None of the authors has a financial or personal conflict of interest.



