

Perinatal iodine nutrition influences thyroid hormone (TH) availability essential for neurodevelopment of the child. Salt iodisation has been introduced in many countries to control iodine deficiency. Assessment of global and regional iodine status, as of 2011, shows an increase in number of countries with adequate iodine intake(Reference Andersson, Karumbunathan and Zimmermann1). Implementation of universal salt iodisation programmes has resulted in eradicating the serious problem of neurological cretinism. However, globally, 29·8 % (241 million) of school-aged children are estimated to have insufficient iodine intakes, with the majority living in Asia and Africa. Although iodine nutrition has been improving since 2003, global progress may be slowing(Reference Andersson, Karumbunathan and Zimmermann1).
Thus, a mild or moderate degree of iodine deficiency still persists due to tardy implementation of universal salt iodisation in many rural communities of third world countries. Resultant thyroxine deficiency (hypothyroxinaemia) is 150–200 times more common compared with frank hypothyroidism in human subjects in iodine-deficient areas(Reference Lavado-Autric, Auso and Garcia-Velasco2). Maternal as well as neonatal hypothyroxinaemia may lead to neurocognitive delays, memory loss and learning deficits(Reference Berbel, Mestre and Santamaria3, Reference Babu, Sinha and Mohan4), and they are correctable with adequate iodine nutrition. At the molecular level, iodine is required for the synthesis of TH, namely triiodothyronine (T3) and thyroxine (T4), which are secreted by the thyroid gland. TH bind to their nuclear receptors in developing brain and regulate the expression of genes like neurotrophins and their receptors, which are critical for normal brain development. Under perinatal hypothyroidism, enhancement of cerebellar apoptosis and modulation of anti-oxidative defence have been reported(Reference Singh, Upadhyay and Kumar5, Reference Bhanja and Chainy6). Neuronal loss has been ascribed to impaired neurotrophic signalling and increased proteolysis of p75 neurotrophin receptor (p75NTR)(Reference Sinha, Pathak and Kumar7).
Recent data revealed that n-3 fatty acids (FA) could have a prophylactic role in preventing the developmental brain damage of hypothyroidism(Reference Sinha, Khare and Rai8). n-3 FA are essential to sustain neuronal function, to protect synapses and neuronal circuits. n-3 PUFA potently decrease serum lipids, which is also an effect of TH(Reference Bazan, Molina and Gordon9). DHA, the main member of the n-3 essential FA family, is avidly retained and concentrated in the nervous system and is known to play a role in neuroprotection, memory and vision(Reference Bazan, Molina and Gordon9). Recent findings suggest that the increase in TH signalling in the liver may be one of the mechanisms by which n-3 FA exert part of their effects on lipid metabolism(Reference Bazan, Molina and Gordon9).
Lipids are the most abundant biomolecules found in the brain after water. Mechanisms of n-3 FA action on the developing brain, in general, can be divided into properties conferred by lipid-bound DHA in the membrane bilayer and those related to unesterified DHA. Interestingly, unesterified DHA, like TH, appears to have roles in regulating gene expression. Both PPAR and liver X receptor have been shown to be nuclear receptors for n-3 FA and are known to have similar site specificity on DNA as TH receptors (TR). These apparent similarities in the molecular mechanism of action of TH and n-3 FA prompted us to see whether they could have overlapping molecular targets and compensatory effects. Considering the hypolipidaemic effect of TH and n-3 PUFA, together with a previous demonstration of interactions between TR and PPAR pathways in the regulation of lipid metabolism(Reference Bogazzi, Hudson and Nikodem10–Reference Liu, Heymann and Moatamed12), we tested, in the present study, the hypothesis that supplementation of n-3 FA alone or in combination with iodine would enhance TH action in the brain and may salvage iodine deficiency-induced loss of cerebellar morphology and function. In order to test this hypothesis, we evaluated the cerebellar expression of TR, retinoic orphan receptor (ROR) and neurotrophins along with neuronal and motor functions in an iodine-deficient perinatal rat model. We also checked specific staining of cerebellum Purkinje cells, molecular layer dendrites and axonal fibres, as well as expression of antioxidant defence enzymes and apoptosis in the developing cerebellum.
Results indicate that, surprisingly, n-3 FA alone without enhancement of circulating TH improve functional, morphological and biochemical indices of the developing cerebellum. Results further show that co-supplementation with iodine and n-3 FA rescues not only the loss of neurotrophic support, but also improves motor coordination, memory and learning. This improvement of neurotrophic support seems to be mediated by a parallel increase in TRα and normalisation of TRβ, RORα and p75NTR. The overall results indicate the important role that n-3 FA may play in enhancing TH nuclear receptor-mediated signalling in the developing cerebellum.
Materials and methods
Iodine-deficient model (hypothyroxinaemic model)
The present study on iodine deficiency-induced hypothyroxinaemia and cerebellar development was reviewed and approved by the institutional animal care ethics committee at the Sanjay Gandhi Postgraduate Institute of Medical Sciences institutional animal care ethics committee, which follows the guidelines published by the Committee for the Purpose of Control and Supervision on Experiments on Animals, Government of India. The low-iodine diet (LID) was prepared by thoroughly mixing 6 kg flour of maize grown in a well-known iodine-deficient area with a recurrent flooding history, 2·5 kg of wheat gluten, 1·0 kg brewer's yeast, 0·15 kg NaCl and 0·15 kg CaCO3. Diet was fortified with 16 ml of maize oil equivalent of 15 g/kg of diet(Reference Mano, Potter and Belling13). A sufficient amount of LID was prepared to cover a complete experiment within the same batch.
Female rats aged 50 d and weighing 120–150 g were switched to a LID diet. They were given 1 % KClO4 in drinking-water for 10 d for removal of stored iodine in their thyroid gland. Animals were then separated into two groups, namely: (1) iodine-sufficient group (LID+KI (10 μg iodine/20 g of diet+normal drinking-water)) and (2) LID group (LID+0·005 % KClO4). Both the groups were kept on the afore-mentioned diet regimen for 3 months.
At the end of 3 months, approximately 1·0 ml of blood was obtained under slight diethyl ether anaesthesia. It was centrifuged and the separated serum was stored at − 20°C for hormone estimation. Total serum T4, free T4 (FT4) and total T3 were measured by specific RIA using Coat-A-Count Siemens Healthcare diagnostics kits (Siemens Health Care Diagnostics Inc.). Based on the hormonal estimations, female rats were divided into euthyroid and iodine-deficient groups (on LID). A total of eight female rats from the iodine-sufficient or euthyroid group and thirty-two female rats from the LID group were mated with normal male Sprague–Dawley rats in a female:male ratio of 2:1. Further, the LID group was divided into four subgroups having eight female rats in each group. Vaginal smears and microscopic visualisation of spermatozoa confirmed the embryonic day zero of the four subgroups: (1) LID, (2) LID+KI, (3) LID+n-3 FA and (4) LID+KI+n-3 FA. The diet of the n-3 FA group was supplemented with 300 mg of n-3 FA contained in MAX-EPA (Merck India Limited) daily through oral administration. KI was added in amounts that provided 10 μg of iodine/20 g of diet. The litter size for the euthyroid and LID groups did not differ significantly and were found to be 7 ± 1.
The dams and pups were kept under the aforementioned conditions and the cerebellum was dissected at postnatal day (P) 16 (n 15). All animal procedures performed earlier were approved by the institutional animal ethics committee as per the international guidelines for animal care and research.
Lipid extraction from cerebellum and cerebellar fatty acid composition
For lipid extraction(Reference Folch, Lees and Sloane Stanley14), for every group, the cerebella of three randomly selected pups born to different dams of each group were harvested at P16. A measure of 300 mg of cerebellar tissue was homogenised in chloroform–methanol (1:2, v/v) five times, followed by twice in chloroform–methanol (2:1, v/v). Butylated hydroxytoluene (0·5 %; Sigma) was added to the chloroform–methanol solvent mixture to avoid oxidation of the extracted lipid. The homogenate was filtered and the filtrate was washed with 5-fold of its volume of water and left for layer separation. A biphasic system was obtained, and the lower layer mainly containing the tissue lipids was evaporated in a stream of N2. In brief, the oil/lipid was dissolved in 0·1 m-alcoholic KOH, refluxed in a water-bath for 15 min and treated with 0·1 m-HCl. This was then extracted with petroleum diethyl ether, followed by its evaporation in a stream of N2. BF3–methanol was further added, refluxed for 2 min, followed by extraction with petroleum diethyl ether (40–60°C boiling range). The petroleum diethyl ether was further evaporated in N2 and an aliquot of the FA-methyl ester extract was injected in a GC–MS, equipped with a PerkinElmer auto system XL gas chromatograph interfaced with a Turbomass mass spectrometric mass selective detector (PerkinElmer Inc.). The analytical column connected to the system was an ELITE-Wax capillary column (30 m × 0·25 mm internal diameter, 0·5 mm film thickness). Helium was used as a carrier gas, with a flow rate of 1 ml/min. The column temperature programme was 100°C (0 min); 100–180°C at 68°C/min (holding time: 0 min); and 180–250°C at 10°C/min (holding time: 15 min). The transfer line and ion source temperatures were maintained at 200 and 250°C, respectively. A solvent delay of 5 min was selected. In the full-scan mode, electron ionisation mass spectra in the range of 50–500 m/z were recorded at electron energy of 70 eV. In order to identify the FA in rat brain, the mass spectra of FA-methyl esters were compared with those of the National Institute of Standards and Technology library available in the instrument. Retention time of FA-methyl ester standards of FA (Sigma) was taken into consideration for quantification in selected ion monitoring by GC–MS. Values are expressed as parts per million.
Measurement of enzymatic activity
Catalase activity was measured according to the method described by Aebi(Reference Aebi15), following the decrease in absorbance of H2O2 at 240 nm and expressed as nKat/mg protein. A measure of 1 nKat of catalase is defined as the amount of enzyme able to catalyse the degradation of 1 nmol of H2O2/s. Superoxide dismutase activity was measured according to the modified nitrite method and expressed as units/mg protein, where 1 unit of enzyme activity is defined as the amount of enzyme able to inhibit 50 % of nitrite formation under assay conditions(Reference Das, Samantha and Chainy16). Malondialdehyde (MDA) was determined by quantifying the reaction product with thiobarbituric acid in the tissue supernatant(Reference Ohkawa, Ohishi and Yagi17). The coloured end product was read at 540 nm. The results were expressed as nmol MDA/mg protein. Reduced glutathione reductase (GSH) was measured in the tissue supernatant using dithiobis-2-nitrobenzoic acid reagent(Reference Beutler, Duron and Kelly18). The coloured end product was read at 412 nm and the results were expressed as mg GSH/mg protein.
Terminal transferase dUTP nick end labelling assay
Apoptosis was visualised in cerebellar sections of 16-d-old pups from both control and rats treated by various modalities following the instructions of the in situ apoptosis detection kit (Roche diagnostic, catalogue no. 11684809910). Apoptosis was quantified by counting the number of TUNEL-positive nuclei per 500 cells in a total of fifteen randomly chosen fields contained in three different sections. Labelling index was taken as the number of TUNEL-positive cells per total number of cells counted per field. Adjacent sections were processed as negative controls and run by omitting terminal deoxynucleotidal transferase (TdT) enzyme following identical procedure to confirm specificity of labelling. Positive controls were treated with nuclease enzyme supplied in the kit and then stained to confirm proper labelling. TUNEL-positive cells are expressed as means with their standard errors of three animals.
Protein extraction and Western blotting
Cerebellum samples taken at P16 (n 5) from three different litters (from all groups; euthyroid, hypothyroxinaemic and three reversibility groups) were harvested, snap-frozen in liquid N2 and stored at − 80°C until further investigation. For preparation of tissue homogenates, cerebellum samples were washed once with PBS and suspended in ten volumes of lysis buffer (10 mm-Tris–Cl (pH 7·5), 50 mm-NaCl, 1 % Triton-X-100 containing phenylmethylsulphonyl fluoride (1 mm) and protease inhibitor cocktail (a mixture of 4-(2-aminoethyl) benzenesulphonyl fluoride, pepstatin A, E-64, bestatin, leupeptin and aprotinin); Sigma) and kept on ice for 10 min. Tissues were then homogenised using a Teflon homogeniser, centrifuged at 12 000 g for 15 min at 4°C and the supernatant was collected. Protein concentration was determined in supernatant using a protein assay kit (Bio-Rad). A measure of 50 μg protein homogenate from the respective experimental groups was subjected to SDS-PAGE and electrotransferred onto nitrocellulose membrane. The membranes were incubated with either anti-caspase-3 or anti-β actin (Cell Signalling Technology) antibody followed by incubation with horseradish peroxidase-conjugated secondary antibodies (Santa Cruz Biotechnology). The signals were detected using an enhanced chemiluminescence detection system (Amersham Biosciences). Relative expression of each protein was determined by densitometric analysis using LabWorks 4.0 software (UVP Limited).
RNA extraction and real-time PCR
Total mRNA was isolated from the cerebral cortex at P16 (n 4) from three different litters from three groups following a single-step mRNA isolation method using TRI reagent (MRC, Inc.). Total mRNA (2 μg) was reverse transcribed to complementary DNA using Thermoscript RT-PCR kit (Invitrogen) following the manufacturer's instructions. Real-time analysis for neurotrophin-3 (NT-3), nerve growth factor (NGF), brain-derived neurotrophic factor (BDNF), RORα, p75NTR, TRα, TRβ, RORα, B-cell lymphoma-2 (Bcl-2) associated death promotor (BAD) and normalising gene glyceraldehyde-3-phosphate dehydrogenase (GAPDH) was performed using specific Taqman UNIVERSAL PCR MASTER mix (Applied Biosystems) for assays on demand for gene accession numbers (Rn01199 850-m1 (NT-3), Rn01533 872-m1 (NGF), Rn00560868-m1 (BDNF), Rn00562044-m1 (p75NTR), Rn00579692-m1 (TRα), Rn00562044-m1 (TRβ) and Rn00576699-m1 (GAPDH)) or using SYBER GREEN MASTER mix (Applied Biosystems) for RORα, (forward: 5′-CCCAACCGTGTCCATGGCGG-3′, reverse: 5′-CCCGTCGATGCGTTTGGCGA-3′) and BAD (forward: 5′-CAGTGATCTGCTCCACATTC-3′, reverse: 5′-TCCAGCTAGGATGATAGGAC-3′), as per the manufacturer's instruction (Applied Biosystems), and fold changes in gene expression were calculated using the 2− ΔΔC T method.
Immunofluorescence
At P16, three pups, each from three separate litters, were taken from all the groups. Pups were anaesthetised and transcardially perfused with normal saline (0·9 % NaCl (w/v), 15–20 ml for pups) followed by 4 % (w/v) paraformaldehyde in 0·1 m-phosphate buffer (20–25 ml) and post-fixed in 4 % paraformaldehyde at 4°C for 4 h. Tissues were then dehydrated in an alcohol series for paraffin embedding by a standard protocol. Coronal sections (3 μm) were cut from the rat brain containing the cerebellum from the pups at P16 developmental stages and mounted on poly-l-lysine-coated slides. De-paraffinised and rehydrated coronal sections were boiled in a microwave oven using 10 mm-citrate buffer (pH 6·0) for antigen retrieval. Sections were blocked with 10 % normal sheep serum for 20 min. To localise the Purkinje neurons, sections were stained with antibodies against calbindin D28K (1:250; Cell Signaling Technology) overnight at 4°C. After washing with PBS, the sections were incubated with anti-mouse Alexa Flor 546 (Invitrogen) secondary antibodies for 1 h in the dark. The sections were then counterstained with Hoechst 33 258 (Invitrogen) and visualised under a Nikon 80i fluorescence microscope (Nikon Instruments Inc.). Image-Pro plus 5.1 software (Media Cybernetics, Inc.) was used for image capturing and cell counting.
Neurobehavioural testing
A total of eight pups born to each group of rats were weaned away on P24. Care was taken to include equal numbers of male and female pups. Male and female pups were housed in separate cages. As the litters were born on different days to different mothers belonging to different groups, a date of birth record was maintained to know the exact date when these pups achieved P24. During the post-weaning period, these pups were fed with an iodine-sufficient control diet fortified with maize oil until P40. These pups were administered training for two consecutive days starting from P38, before performing the final test on P40. All the three tests were carried out on pups that achieved P40 on a particular day. The following neurobehavioural tests were carried out on these pups.
Motor coordination test
This was performed in rat pups from different dietary supplement groups at the age of P40. Rats were trained three times a day for two consecutive days on a rotarod at a constant speed of 20 rpm. On the 3rd day, the time of stay was recorded for different rats on the rotating rod. The length of time that a given animal stays on this rotating rod was a measure of their balance, coordination, physical condition and motor planning. The mean index value of the three trials was used to reflect the motor coordination functions of each rat.
Y-maze test
The Y-maze was performed as described previously(Reference Cazala and Zielinski19). During the Y-maze test, P40 rats were placed in the centre of a symmetrical Y maze and were allowed to explore freely in the maze for 8 min. The total number and sequence of arms entered were recorded. An arm was entered if the hind paws of the rat were completely in the arm. The rats were trained for two consecutive days to habituate. On day 3, the alteration between arms was recorded. Rats that found the arm having a light on, indicating absence of current in that arm, within 30 s were recorded as having a positive response. The acquisition time was recorded to determine short-term memory. The mean value of the three trials was used to reflect the short-term memory functions of each rat.
Morris water maze test
The ability of different groups of rat pups to learn and memorise was tested by a Morris water maze (Techno India Pvt Ltd)(Reference Morris20). The water maze consisted of a large, circular, galvanised steel pool. A white platform (10 cm in diameter) was placed inside and the tank was filled with water until the top of the platform was submerged 1 cm below the water's surface. A sufficient amount of white paint was added to make the water opaque and render the platform invisible. In addition to the visual cues, on the walls of the laboratory (shapes), five sheets of paper with black-and-white geometric designs attached to the sides of the tank served as additional cues. An automated tracking system was used to analyse the swim path of each subject and it calculated the escape latencies and total path lengths. Beginning on the following day, rats were given seven acquisition sessions that consisted of four trials per d, with an inter-trial interval of 10 min throughout the course of this acquisition period. The hidden platform remained in the same fixed position for all rats. Once a rat located the platform, it was allowed to remain there for 30 s before being removed from the tank. The automated tracking system recorded the path length, the escape latency and swimming speed to find the platform, and these data were given by the computer as the index of learning and memory. Mean latency of each session was obtained for the purpose of data representation.
Statistical analysis
Data are presented as means with their standard errors of the indicated number of experiments. Statistical analysis was performed using SPSS 9.0 software (SPSS, Inc.). Data were analysed by one-way ANOVA, followed by the Bonferroni post hoc test. P< 0·05 was taken to indicate a statistically significant difference. The significance levels of multiple comparisons are given in Table S1 (available online).
Results
We compared the pups born to iodine-sufficient (control) and LID-fed rat dams. This diet regimen was continued for 3 months prior to conception. From P1, iodine-deficient dams along with their litter were either continued on the same or LID diet given along with KI or n-3 FA alone or both KI and n-3 FA combined together. Half the number of pups were continued on the same diet regimen and tested for their motor coordination and neurobehavioural parameters. After recording body weights, circulating levels of T3, T4 and FT4 were estimated in equal numbers of pups from each dam on the peak cerebellar neurogenesis period of day 16. Pups were then killed for assessment of cerebellar morphology and markers of apoptosis and oxidative stress, as well as neurotrophins, nuclear TR and ROR.
The body weight and hair texture in 16 d pups remained unaltered in all the groups of pups (data not shown). Serum T4 and FT4 levels were significantly decreased in pups on LID compared with the controls. T3 levels, though, showed a decreasing trend, but the decrease was not significant compared with the controls (Table 1). Circulating FT4 and T3 levels normalised in KI-supplemented groups compared with controls, but total T4 levels, though significantly improved, failed to normalise compared with controls. Circulating FT4, total serum T4 and T3 levels remained significantly low in iodine-deficient rat pups fed on n-3 FA supplementation alone compared with controls (Table 2).
Circulating thyroid hormone levels in dams (Mean values with their standard errors, n 5 in each group)
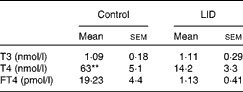
LID, low-iodine diet; T3, triiodothyronine; T4, thyroxine; FT4, free T4.
** Mean value was significantly different compared with LID (P< 0·005).
Circulating thyroid hormone levels in pups of different dietary groups at postnatal day 16 (Mean values with their standard errors; n 5 in each group)
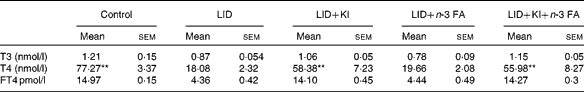
LID, low-iodine diet; KI, potassium iodide; FA, fatty acid; T3, triiodothyronine; T4, thyroxine; FT4, free T4.
** Mean value was significantly different compared with LID (P< 0·005).
n-3 Fatty acid treatment elevates developing cerebellar n-3 fatty acid (DHA) levels
We measured the levels of n-3 FA by GC–MS in the cerebellar tissue of P16 pups from all the groups. Results showed that n-3 FA-treated pups showed significant increases in levels of n-3 FA compared with the control, LID and KI alone-supplemented groups. The levels of DHA in cerebellar tissue rose by 6·5-fold in n-3 FA (P< 0·001) and by 7-fold in n-3 FA+KI (P< 0·001) supplemented groups when compared with the control. Thus, treatment of iodine-deficient dams with n-3 FA caused elevations in cerebellar n-3 FA composition in the P16 offspring (Table 3).
Levels of DHA in cerebellar tissue from three pups each of both the sexes from all the groups of rats (Mean values and standard deviations)
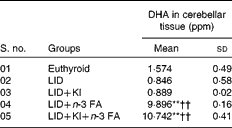
ppm, Parts per million; LID, low-iodine diet; KI, potassium iodide; FA, fatty acid.
** Mean value was significantly different compared with LID (P< 0·005).
†† Mean value was significantly different compared with control (P< 0·005).
Improvement in motor coordination and cognitive performance
We observed significant worsening of motor coordination and memory at P40 in iodine-deficient rat pups, when compared with the euthyroid group pups (P< 0·005). We did not observe significant improvement in motor coordination, at P40, in iodine-deficient rat pups that were supplemented with KI alone. However, significant improvement in motor coordination was observed in rat pups supplemented with n-3 FA alone as well as in those co-supplemented with KI groups at day 40 when compared with the LID group pups (P< 0·05) (Fig. 1(a)–(c)). The significant memory improvement was seen in all the treatment groups when compared with iodine-deficient pups (P< 0·005) (Fig. 1(a)–(c)).
Motor coordination and cognitive performance of different dietary groups at postnatal day (P) 40: control group; low-iodine diet (LID) group; LID+potassium iodide (KI) group; LID+n-3 fatty acid (FA) group; LID+KI+n-3 FA group. Eight pups born to each group of rats were weaned away on P24. Care was taken to include equal numbers of male and female pups. Male and female pups were housed in separate cages. As the litters were born on different days to different mothers belonging to different groups, a date of birth record was maintained to know the exact date when these pups achieved P24. During the post-weaning period, these pups were fed with an iodine-sufficient control diet fortified with maize oil until P40. These pups were administered training for two consecutive days starting from P38 before imparting the final test on P40. All the three tests were carried out in pups that achieve P40 on a particular day. Values are means, with their standard errors represented by vertical bars. (a) Motor co-ordination performance assessed as time of stay on rotating rod. (b) Y-maze test for learning performances assessed as number of positive responses. (c) Morris water test showing escape latency. Mean value was significantly different from that for the LID group: * P< 0·05, ** P< 0·005.

Rescue of impaired dendrite arborisation
Calbindin D28K staining at P16 revealed gross stunting of dendrites in iodine-deficient cerebellums compared with controls (Fig. 2(a) and (b)). Both iodine and n-3 FA supplementation alone did significantly improve the dendrite architecture, but their effect was further enhanced under combinatorial supplementation of iodine and n-3 FA (Fig. 2(b)v. Fig. 2(c) and (d)). The maximal restoration of dendrite arborisation of Purkinje neurons was seen in combinatorial supplement given to pups (Fig. 2(b)v. Fig. 2(e)).
Representative photomicrograph of calbindin D28K immunofluorescence staining showing Purkinje cells dendritic arborisation in cerebellum of different groups ((a) control; (b) low-iodine diet (LID); (c) LID+potassium iodide (KI); (d) LID+n-3 fatty acid (FA)) at postnatal day 16. Hoechst was used as a counter-nuclear stain. Scale bar 50 μm. (A colour version of this figure can be found online at http://www.journals.cambridge.org/bjn).

Alterations in cerebellar apoptosis
The present result showed significantly increased TUNEL-positive cells in iodine-deficient cerebellum compared with controls (P< 0·005) (Fig. 3(a) and (b)), indicating enhanced apoptosis. There were significantly fewer TUNEL-positive cells on supplementation, either with KI or n-3 FA (P< 0·005). However, further reduction of TUNEL-positive cells was seen on combined supplementation when compared with KI and n-3 FA treatments alone (P< 0·005) (Fig. 3(a) and (b)). These results show an additive effect of combined treatment with KI and n-3 FA on the extent of apoptosis, comparable with the euthyroid control group pup cerebellum. Alterations in caspase-3 show a trend similar to that obtained for TUNEL, with significantly increased levels seen in the cerebellum of iodine-deficient pups compared with the controls, and significantly reduced levels seen on either KI or n-3 FA supplementation (P< 0·005), with combined supplementation showing further significant reduction compared with either of the individual supplements (P< 0·005) (Fig. 3(c)). Seen together, these results show significant enhancement of apoptosis caused by iodine deficiency and its mitigation by both KI and n-3 FA supplementation, with combined supplementation giving additive benefit.
Analysis of cell death in the developing cerebellum under different dietary regimens. (a) Representative photomicrographs of terminal transferase dUTP nick-end labelling (TUNEL)-labelled cells in the cerebellum at postnatal day (P) 16 in different groups: control group; low-iodine diet (LID) group; LID+potassium iodide (KI) group; LID+n-3 fatty acid (FA) group; LID+KI+n-3 FA group. (b) The apoptotic index was expressed as percentage change in TUNEL-positive cells/500 nuclei (Hoechst stained). (c) Immunoblots of whole-cell lysate (50 μg) prepared from cerebellum at P16 from different groups, showing levels of cleaved caspase-3 and β-actin. Histogram shows the relative densities of cleaved caspase-3 in different groups. (d) Histogram showing the transcriptional level changes in the expression of BAD in different groups at P16. Values are means of TUNEL-positive cells in different groups, with their standard errors represented by vertical bars. Mean value was significantly different from that for the LID group: * P< 0·05, ** P< 0·005. Mean value was significantly different from that for the LID+KI group: † P< 0·05, †† P< 0·005. Mean value was significantly different from that for the LID+n-3 FA group: ‡ P< 0·05, ‡‡ P< 0·005. (A colour version of this figure can be found online at http://www.journals.cambridge.org/bjn).

Increased TUNEL positivity in iodine-deficient cerebellum was not reflected in Bcl2 and Bcl-2 associated X protein (Bax) levels. They remained unaltered in iodine-deficient cerebellum compared with controls (NS) (data not shown). However, we observed significantly decreased BAD mRNA levels, which corroborated with lower levels of cleaved caspase-3 in n-3 FA-supplemented group and even more so in iodine plus n-3 FA co-supplemented groups (P< 0·005) (Fig. 3(c) and (d)).
Alteration in oxidative stress
We found lipid peroxidation to be significantly increased in iodine-deficient pups compared with the controls (P< 0·005) (Fig. 4(a)). Results also indicated significant loss of superoxide dismutase (P< 0·05), catalase and GSH activity in iodine-deficient rat pups compared with the controls (P< 0·005). KI treatment of LID rats alone did not improve levels of catalase, GSH or superoxide dismutase; however, it resulted in improved lipid peroxidation (P< 0·005). While superoxide dismutase levels did not show any improvement on treatment with n-3 FA alone, they showed significant improvement upon combined n-3 FA and KI treatment (P< 0·05) A significant improvement in the levels of catalase and GSH activity was observed in supplementation groups receiving either n-3 FA alone or those receiving it along with KI compared with LID (P< 0·005). However, combined supplementation of KI and n-3 FA did not produce any further improvement compared with n-3 FA alone supplementation (Fig. 4(b)–(d)).
Analysis of oxidative stress markers in the developing cerebellum under different dietary regimens. Changes in the patterns of (a) lipid peroxidation (LPO), (b) superoxide dismutase (SOD), (c) catalase and (D) glutathione reductase (GSH) levels in the different groups: control group; low-iodine diet (LID) group; LID+potassium iodide (KI) group; LID+n-3 fatty acid (FA) group; LID+KI+n-3 FA group. Values are means of the different groups (n 5), with their standard errors represented by vertical bars. Mean value was significantly different from that for the LID group: * P< 0·05, ** P< 0·005. Mean value was significantly different from that for the LID+KI group: † P< 0·05, †† P< 0·005.

Changes in cerebellar neurotrophins
TH is known to regulate the expression of neurotrophins in developing rat cerebellum. mRNA expression of NT-3, BDNF and low-affinity NGF revealed a mixed response to iodine deficiency and supplementation or n-3 FA and iodine (Fig. 5(a)–(c)). While cerebellar mRNA expression of NT-3 and BDNF in iodine-deficient pups significantly decreased (P< 0·005), expression levels significantly increased for both NGF (P< 0·005) and p75NTR (P< 0·001) when compared with controls. Iodine supplementation alone failed to restore levels of both NT-3 and BDNF, but n-3 FA supplementation either alone or in combination with KI, completely restored NT-3 levels to control levels (Fig. 5(b)). In case of BDNF, optimisation of mRNA levels was only observed under combinatorial supplementation of iodine and n-3 FA (P< 0·005) (Fig. 5(a)). Increased mRNA levels of NGF and p75NTR seen under the iodine-deficient condition responded differently to iodine and n-3 FA supplements. p75NTR, which was up-regulated under iodine deficiency, showed a significant decrease on supplementation with iodine or n-3 FA and was further significantly enhanced on combined supplementation (P< 0·005) (Fig. 5(d)). In contrast, NGF normalised only on iodine supplementation (P< 0·005) and remained high when supplemented with either n-3 FA alone or given in combination with iodine (Fig. 5(c)).
Levels (fold changes) of neurotrophins and their receptor under different dietary regimens. Graph showing the transcriptional level changes in the expression of neurotrophins and their receptors in different groups at postnatal day 16: control group; low-iodine diet (LID) group; LID+potassium iodide (KI) group; LID+n-3 fatty acid (FA) group; LID+KI+n-3 FA group. (a) Brain-derived neurotrophic factor (BDNF), (b) neurotrophin-3 (NT-3), (c) nerve growth factor (NGF) and (d) p75 neurotrophin receptor (p75NTR). Glyceraldehyde-3-phosphate dehydrogenase mRNA was used as an internal control. Values are means (n 5), with their standard errors represented by vertical bars. Mean value was significantly different from that for the LID group: * P< 0·05, ** P< 0·005. Mean value was significantly different from that for the LID+KI group: † P< 0·05, †† P< 0·005. Mean value was significantly different from that for the LID+n-3 FA group: ‡ P< 0·05, ‡‡ P< 0·005.

Circulating thyroid hormone levels and thyroid hormone receptor expression
We saw improvement, albeit to a different degree, in several functional, morphological as well as biochemical parameters related to cell death and oxidative stress, either by supplementation of iodine and/or n-3 FA alone. Though the improvement with the n-3 FA-only treatment, without enhancement of circulating TH levels, was a bit puzzling, the rescue effect of combined supplementation was ubiquitous. Analysis of TR was done with quantitative PCR and caution is exercised in interpretation of the results. Under the iodine-deficient condition, a significant up-regulation of TRβ (>1·5-fold, P< 0·005) was observed compared with the control group. This was concomitant with a highly significant decrease in the levels of TRα ((>3-fold, P< 0·005) Fig. 6(a) and (b)). Another TH-dependent gene RORα, which is partially responsible for the regulation of neurotrophic action on Purkinje cells' dendrites, was also analysed. RORα levels were significantly low under iodine deficiency compared with the control group (>4-fold, P< 0·005) and showed moderate, yet, significant recovery with either treatment regimen (Fig. 6(c)). n-3 FA supplementation, either alone or in combination with iodine supplementation, restored the levels of TR to euthyroid levels. This restoration was much more significant in the case of TRα and RORα on the combined treatment with KI plus n-3 FA supplementation (>2-fold, P< 0·005). However, when supplemented together with both nutrients, recovery in RORα levels was significant, although still less than control (P< 0·005).
mRNA levels (fold changes) of thyroid hormone receptor (TR)α (a), TRβ (b) and retinoic orphan receptor (ROR)α (c) in the developing cerebellum of different dietary groups at postnatal day 16: control group; low-iodine diet (LID) group; LID+potassium iodide (KI) group; LID+n-3 fatty acid (FA) group; LID+KI+n-3 FA group. Glyceraldehyde-3-phosphate dehydrogenase mRNA was used as an internal control. Values are means (n 5), with standard errors represented by vertical bars. Mean value was significantly different from that for the LID group: * P< 0·05, ** P< 0·005. †† Mean value was significantly different from that for the LID+KI group (P< 0·005). ‡‡ Mean value was significantly different from that for the LID+n-3 FA group (P< 0·005).

Discussion
Iodine deficiency is known to produce a hypothyroxinaemic state, which is 150–200 times more common than hypothyroidism(Reference Andersson, Karumbunathan and Zimmermann1). It is known that postnatal iodine supplementation to dams improves motor coordination and cognition ability in progeny of iodine-deficient rats through recovery of neuronal architecture of the developing cortex and cerebellum. The present study was planned to investigate if any additional improvement is achievable in functional and morphological attributes on supplementation of n-3 FA along with iodine. The broad findings of the present study include the following: (1) several-fold increase in n-3 FA uptake was found in the cerebellum on n-3 FA supplementation, (2) KI supplementation alone, though effective in improving learning and memory function, fails to improve motor coordination; however, supplementation of n-3 FA alone as well as along with KI improves both motor coordination and memory function and (3) maximal restoration of dendrite arborisation, significant reduction of cerebellar apoptosis and significantly reduced oxidative stress observed on combined supplementation of n-3 FA and KI suggest additional benefits derived by cerebellum undergoing iodine deficiency insult on either n-3 FA supplementation alone or with iodine.
Numerous basic and clinical studies have shown the benefits of n-3 FA in the well-being of mental health(Reference Bradbury21). n-3 FA provide benefits by exerting a protective mechanism at the cellular and neuronal levels, including modulation of the inflammatory cascade following traumatic brain injury(Reference Moreira, Knorr and Ganzella22, Reference Schipper, Kiliaan and Homberg23). This protective signalling is already well-established in a number of neurodegenerative disorders like Alzheimer's and Parkinson's disease(Reference Bazan, Molina and Gordon9). However, apart from their role in neuroprotection of the adult brain(Reference Karr, Alexander and Winningham24), relatively little is known of their action in disorders of the developing brain(Reference Innis25–Reference Niculescu, Lupu and Craciunescu27). Epidemiological studies are now providing favourable evidence for the nutritional benefit of early n-3 FA supplementation in children(Reference Ryan, Astwood and Gautier28–Reference van Goor, Dijck-Brouwer and Erwich30). Although the effects of n-3 FA on the developing brain in a chemically induced hypothyroid model have been studied earlier(Reference Sinha, Khare and Rai8), we in the present study tested the ability of n-3 FA in protecting the developing brain from the deleterious effect of nutritional iodine deficiency. Iodine deficiency, which results in low levels of TH in the developing brain, causes a multitude of neurological disorders in human populations and poses a serious threat to public health. We here found that n-3 FA supplementation to iodine-deficient rat pups, either alone or in combination with iodine, provided a remarkable recovery in both cellular and cognitive indices affected under iodine deficiency.
At the cellular level, iodine deficiency is associated with stunted dendritic architecture and increased apoptosis in the developing rat cerebellum(Reference Neveu and Arenas31). The present results here clearly demonstrate the efficacy of n-3 FA in preventing these abnormalities, both alone and even better when combined with iodine. Mechanisms by which n-3 FA seem to prevent cellular injury under iodine deficiency involve regulation of pro-apoptotic Bcl2 member proteins, enforcing antioxidant response and increasing neurotrophic support. Interestingly though, we found some remarkable differences in the regulation of Bcl2 family proteins under our present model of iodine deficiency compared with chemically induced hypothyroidism. Although both anti-apoptotic Bcl2 and B-cell lymphoma extra large (BclxL) levels (data not shown) were unchanged under iodine deficiency, compared with that under chemically induced hypothyroidism(Reference Singh, Upadhyay and Kumar5), pro-apoptotic BAD levels were significantly increased under iodine deficiency. The present results suggest that the protective action of n-3 FA in iodine deficiency could involve the down-regulation of pro-apoptotic Bcl2 proteins like BAD instead of affecting the anti-apoptotic family members like Bcl2. Other interesting finding was the up-regulation of antioxidant enzymes in n-3 FA+iodine-treated iodine-deficient pups(Reference Bhanja and Chainy6). n-3 FA have been previously shown to reduce oxidative stress and we here further corroborate it(Reference Farooqui32).
Neurotrophic loss is considered as a major cause of impaired neurodevelopment under iodine deficiency. Neurotrophins like NT-3 and BDNF in the developing rat cerebellum are required for dendritic arborisation in Purkinje neurons and are essential for the survival of other neuronal subtypes(Reference Neveu and Arenas31).
The present data showed that n-3-FA limit the impairment in neuronal morphology and survival by restoring the levels of NT-3 and BDNF, which are markedly reduced in iodine deficiency. We also found other genes, like RORα and p75NTR (Reference Sinha, Pathak and Kumar7), which fine tune the development and patterning of rat cerebellum in response to neurotrophins, although not affected by n-3 FA and iodine supplementation alone, could be regulated when the iodine-deficient pups were co-supplemented with both the nutrients.
Other than these findings, we also report, for the first time, that TR expression itself can be affected by n-3 FA in the developing brain. Under iodine deficiency, TRα levels are reduced with a compensatory increase in TRβ levels in vivo. Iodine, along with n-3 FA supplementation, is able to normalise TRα levels in the cerebellum, and it being the prominent receptor responsible of early neuronal development(Reference Gauthier, Chassande and Plateroti33–Reference Heuer and Mason35), might probably explain its ability to reverse other cellular and behavioural deficits seen under iodine deficiency. Notwithstanding the significance levels arrived through post hoc ANOVA, in the iodine-deficient group, the increase in TRβ transcript was less than 2-fold (approximately 1·7-fold), while the decrease in TRα and RORα transcripts was more than 3- to 4-fold when compared with controls. Results show that the iodine-deficient state reduces TRα and RORα transcripts by many fold, which recover optimally upon combined supplementation of KI and n-3 FA. In contrast, the TRβ transcript withstands iodine deficiency and remains constitutively expressed to the similar level compared with control on various supplementation regimens. It has been previously shown that the absence of TRα receptors in wild-type mice leads to hypothyroxinaemia(Reference Fraichard, Chassande and Plateroti36), and others have described limited hypothyroxinaemia in TRα1− / − mice(Reference Wikstrom, Johansson and Salto37). These data suggested that the TRα proteins might balance the action of TRβ receptors and positively control the production of TH. This contradiction is easily resolved if we assume that the absence of the weak repressor, TRα, eliminates the competition between the two types of receptors and enables the stronger repressor, TRβ, to fully exert its repression potential. This assumption is supported by data showing that TRβ proteins are more efficient than TRα1 in binding the negative TH response element of the TSH promoter and repressing its activity(Reference McCabe, Yarwood and Gurr38). This explains the prevalence of the widespread hypothyroxinaemic state rather than frank hypothyroidism in iodine-deficient areas. However, we at this point are not sure how the gene-specific effect of iodine/TH and n-3 FA works.
The results raise an intriguing possibility of overcoming some of the refractiveness in children who are given iodine supplementation alone to treat hypothyroidism(Reference Souza, Nunes and Paula39). In fact, based on these results, it could be argued that recovery of iodine deficiency in children may be more complete and accelerated if given a supplementation of n-3 FA along with iodine. The beneficial effects of n-3 FA under iodine deficiency were even more strengthened by the results that we obtained from the behavioural tests. These results showed that perinatal supplementation of n-3 FA to iodine-deficient pups clearly resulted in restoration of key molecular and cellular targets and improved cognitive performance in later life.
Taken together, the present study supports the nutritional benefits of n-3 FA in the developing brain and shows its efficacy in reducing neuronal damage under other nutritional deficiencies. Here, we also show complementation provided by n-3 FA to iodine supplementation under developmental hypothyroidism and argue for its inclusion as a supplement in treating different nutritional deficiencies in human populations.
Supplementary material
To view supplementary material for this article, please visit http://dx.doi.org/10.1017/S0007114512005569
Acknowledgements
This work was supported by grants from the Department of Science and Technology, Government of India (SR/SO/HS/95/2007 and SR/SO/HS-0054/2010 to M. M. G.) and Senior Research Fellowship (no. 3/1/2/30/09-RHN) from the Indian Council of Medical Research (A. P.). All authors contributed to the preparation of the manuscript. M. M. G., D. R. M. and R. A. S. designed the study. A. P. and V. M. were responsible for the feeding protocol; A. P. and P. K. for the collection of tissue and blood samples; and A. P. and L. R. for neurobehavioural testing. This work constitutes the PhD thesis of A. P., and all biochemical assays were performed by him. A. P. and V. M. also carried out the statistical analysis. The authors declare that they have no conflict of interest in relation to this work.


