


High-protein, low-carbohydrate diets have become popular in recent years and are even recommended by some nutritional guidelines, as they can persistently decrease appetite and body weight(Reference Krieger, Sitren and Daniels1, Reference Weigle, Breen and Matthys2). In addition, amino acid toxicity is generally regarded as rare and the ingestion of normal amounts of protein is beneficial for patients with liver failure (e.g. hepatic encephalopathy), as it prevents protein energy malnutrition(Reference Soeters, van de Poll and van Gemert3, Reference Merli and Riggio4). However, Frank et al. (Reference Frank, Graf and Amann-Gassner5) have shown that a short-term (7 d), high-protein diet alters renal haemodynamics in healthy subjects, and suggested that more attention should be paid to the potential adverse effects of such diets. Liver plays a vital role in protein metabolism(Reference Lobley, Connell and Lomax6). Because amino acids from dietary proteins are absorbed through the gut and directly delivered into the liver via the portal vein(Reference Rerat7), we hypothesised that liver is a major target organ of a high-protein diet. A previous study has shown that feeding for 2 weeks on a high-protein (45 % casein) diet led to a slight increase in serum alanine aminotransferase (ALT) and aspartate aminotransferase (AST) activity levels in healthy rats(Reference Bolter and Critz8). However, it remains unclear whether high-protein diets can cause liver injury in healthy human subjects or experimental animals.
There is now both experimental and clinical evidence to indicate that refeeding after fasting occasionally leads to elevated serum aminotransferase activities(Reference Sogawa, Sogawa and Fukuoka9–Reference De Caprio, Alfano and Senatore11). Refeeding after a period of extreme starvation causes moderate increases in serum ALT and AST activities at day 10 in a healthy male(Reference Korbonits, Blaine and Marinos12). Patients with anorexia nervosa also exhibit mild to moderate elevation in their serum ALT and AST activities following refeeding therapy(Reference Ozawa, Shimizu and Shishiba13). These findings suggest that refeeding after fasting has potentially adverse effects on hepatocytes.
Given that excessive protein ingestion and irregular eating habits are becoming more prominent in developed countries, the combination of a high protein intake and a fasting–refeeding regimen on disease development should be investigated. This will yield valuable new insights into the adverse effects of a high-protein diet. In the present study, we investigated the effects of refeeding with different protein concentrations after 48 h of fasting on the development of acute hepatocellular injury.
Materials and methods
Diets
Casein, α-maize starch, sucrose, cellulose powder, AIN-76 mineral mixture(14), AIN-76 vitamin mixture(14) and choline bitartrate were purchased from Oriental Yeast (Tokyo, Japan). dl-Methionine was obtained from Wako Pure Chemical Industries (Osaka, Japan). Soyabean oil was supplied by NOF (Tokyo, Japan). Using food-grade ingredients, purified rodent powder diets were prepared in our laboratory. The composition of these test diets is shown in Table 1. The six dietary groups examined in the present study could be differentiated by their casein weight percentage (3, 15, 35, 40, 45 or 50 %) and dl-methionine percentage (0·045, 0·225, 0·525, 0·6, 0·675 or 0·75 %). Casein and dl-methionine were exchanged isoenergetically with α-maize starch.
Composition of the test diets
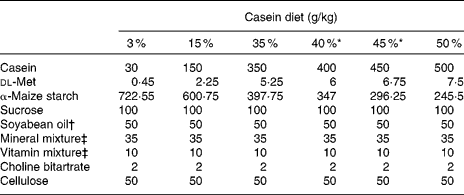
* 40 and 45 % casein diets were used to obtain additional data.
† Fatty acid composition (g/100 g fatty acid): 16 : 0, 17·4; 16 : 1n-9, 0·1; 18 : 0, 5·7; 18 : 1n-9, 22·3; 18 : 1n-7, 1·2; 18 : 2n-6, 46·9; 18 : 3n-3, 6·1; 20 : 1n-9, 0·2; 22 : 5n-3, 0·1.
‡ AIN-76 mineral and vitamin mixtures(14).
Animals and experimental design
Specific pathogen-free, 5-week-old female BALB/c mice were obtained from Charles River Japan (Atsugi, Japan). The animals were maintained on a commercial laboratory chow (Oriental Yeast) and were given water ad libitum. The non-purified diet comprised approximately 23·6 % protein, 5·3 % fat, 6·1 % ash, 2·9 % fibre and 54·4 % N-free extracts. After an acclimatisation period (5 d), mice were given the test diet containing 15 % casein and water ad libitum. At 7 d after commencing the 15 % casein diet, mice were deprived of food for a period of 48 h but were allowed free access to water. After this food deprivation period, the animals were immediately administered a test diet containing 3, 15, 35 or 50 % casein ad libitum for 24 h. The animals were killed by decapitation at 0, 2, 3, 8, 11 and 24 h after refeeding had commenced and their blood and liver samples were harvested.
To elucidate whether different protein sources with different amino acid compositions modulate the effects of refeeding a high-protein diet on the development of acute hepatocellular injury, mice were fasted for 48 h and administered diets containing casein+dl-methionine (844 g crude protein/kg), soyabean protein (869 g crude protein/kg) (Clea Japan, Inc., Tokyo, Japan) or wheat gluten (819 g crude protein/kg; Nacalai Tesque, Kyoto, Japan). Each protein source was added to the experimental diet at the level of 68·5 g N/kg diet (i.e. 507·5 g casein+dl-methionine, 492·9 g soyabean protein or 523 g wheat gluten/kg diet, respectively). Different amounts of each protein source were exchanged with cellulose (50, 64·6 and 34·5 g cellulose/kg diet for the casein, soyabean and wheat gluten diets, respectively). In addition to each protein source and cellulose, these three test diets contained 245·5 g α-maize starch, 100 g sucrose, 50 g soyabean oil, 35 g mineral mixture, 10 g vitamin mixture and 2 g choline bitartrate/kg.
All animal housing, handling and sample collection procedures conformed to the policies and recommendations of the Laboratory Animal Care Advisory Committee of Chiba University (Chiba, Japan).
Measurement of urea nitrogen, total protein, albumin, glucose, inorganic phosphorus, total bilirubin and corticosterone levels and alanine aminotransferase and aspartate aminotransferase activities in serum
Blood was collected and allowed to clot for 1 h at room temperature. Serum was then separated by centrifugation at 1500 g for 20 min at 4°C and was stored at − 80°C until analysis. Serum urea N, total protein, albumin, glucose, inorganic P, total bilirubin and corticosterone levels were measured using commercially available kits as follows: urea N B-test (Wako Pure Chemical Industries); BCA™ Protein Assay Kit (Pierce, Rockford, IL, USA); A/G B-test (Wako Pure Chemical Industries); glucose CII-test (Wako Pure Chemical Industries); Phosphor C (Wako Pure Chemical Industries); bilirubin kit-K (Alfresa, Osaka, Japan); RIA kit (ICN Biomedical, Costa Mesa, CA, USA). Serum ALT and AST activities were measured using a transaminase CII-test (Wako Pure Chemical Industries). All assays were performed in duplicate and data averages were statistically analysed.
RNA extraction and quantitative real-time RT-PCR
Total RNA was isolated from mouse liver using an RNAeasy extraction kit (Qiagen, Santa Clarita, CA, USA) and quantitative real-time RT-PCR was performed with an ABI Prism 7300 Sequence Detection System (Applied Biosystems, Foster City, CA, USA), as described previously(Reference Oarada, Tsuzuki and Gonoi15). Primer sequences used were as follows: heat shock protein 1A (Hsp72) – forward 5′-CGAGGCTGACAAGAAGAAGG-3′, reverse 5′-CTGGTACAGCCCACTGATGA-3′; FBJ osteosarcoma oncogene (c-fos) – forward 5′-CCTGTCCGGTTCCTTCTATG-3′, reverse 5′-AAGTAGTGCAGCCCGGAGTA-3′; nuclear receptor subfamily 4, group A, member 1 (nur77) – forward 5′-CTTGAGTTCGGCAAGCCTAC-3′, reverse 5′-GGTGTCAAACTCTCCGGTGT-3′; growth arrest and DNA-damage-inducible 45 gamma (Gadd45g) – forward 5′-TACAGTTCCGGAAAGCACAG-3′, reverse 5′-CAGGGTCCACATTCAGGACT-3′; B-cell translocation gene 2, anti-proliferative (Btg2) – forward 5′-TGAAGTGTCTTACCGCATCG-3′, reverse 5′-GGAGACGGCCATCACATAGT-3′; uracil-DNA glycosylase (Ung) – forward 5′-CAAGGTGTCCTCCTCCTCAA-3′, reverse 5′-GGCCACTCAGGTTCTGATTC-3′; C-reactive protein (Crp) – forward 5′-GCCAGCTGGGAGTCTGCTAC-3′, reverse 5′-CACCGCCATACGAGTCCT-3′; glyceraldehyde-3-phosphate dehydrogenase – forward 5′-TGCACCACCAACTGCTTAG-3′, reverse 5′-GGATGCAGGGATGATGTTC-3′.
Measurement of lipid peroxidation
The extent of lipid peroxidation in mouse liver tissues was assayed by measuring one of the end products of the process, thiobarbituric acid-reactive substances (TBARS). Livers were homogenised in a 0·1 m-phosphate buffer (pH 7·4) to yield a 10 % (w/v) homogenate. A thiobarbituric acid reaction was carried out by mixing 0·2 ml SDS solution (8·1 %, w/v), 1·5 ml acetic acid buffer (20 %, v/v, pH 3·5), 1·5 ml thiobarbituric acid (0·8 %, v/v) and 0·6 ml water with 0·2 ml of the tissue homogenate. The resulting reaction mixture was incubated at 95°C for 60 min and then cooled by mixing it with 1 ml of water and 5 ml n-butyl alcohol and pyridine (15:1, by volume). The mixture was then centrifuged (4°C, 1000 g) for 10 min, and the supernatant was measured spectrophotometrically at 535 nm. Tetramethoxypropane was used as a standard to estimate TBARS formation, which is expressed as μmol malondialdehyde equivalents/g tissue.
Measurement of TNF-α, IL-1β and IL-6
Mouse livers were homogenised in ice-cold PBS (10 %, v/v) with a glass hand-held tissue homogeniser and centrifuged at 6000 g for 30 min at 4°C to pellet the debris. TNF-α, IL-1β and IL-6 levels were determined in sample supernatants and in serum using an ELISA kit (TNF-α and IL-1β: Pierce; IL-6: R&D systems, Minneapolis, MN, USA). The lower detection limits for TNF-α, IL-1β and IL-6 were 50, 15·6 and 7·8 pg/ml, respectively.
Measurement of antioxidant enzyme activity
Mouse livers were homogenised in ice-cold 50 mm-potassium phosphate buffer (pH 7·0) containing 1 mm-EDTA and centrifuged at 6000 g for 30 min at 4°C to pellet the debris. The activities of glutathione S-transferase, catalase and superoxide dismutase were determined in sample supernatants using commercially available kits: Glutathione S-Transferase Assay Kit 703302 (Cayman, Ann Arbor, MI, USA), Catalase Assay Kit 707002 (Cayman) and Superoxide Dismutase Assay Kit 706002 (Cayman), respectively.
Statistical analysis
All experiments were repeated twice independently. All data are presented as means and standard deviations of representative measurements. Statistical comparisons between measurements taken at 48 h before (pre-fasting, normal levels) and at 0, 2, 3, 8, 11 or 24 h after the commencement of refeeding were made using the unpaired Student's t test. Differences among the four dietary groups for each time point were analysed using one-way ANOVA and Tukey's honestly significant difference test for post hoc analysis. Differences were considered significant at P < 0·05. All statistical analyses were performed using SPSS software (SPSS, Inc., Tokyo, Japan).
Results
Food intake and total body and liver weight
In all dietary groups, mice that had been refed large quantities of the test diets during the 0–3 h period after the initiation of refeeding showed a greatly reduced food intake for the next 3–24 h (Fig. 1(A)). Fasting for 48 h resulted in a decrease in body weight from 20·2 (sd 1·0) g (before fasting) to 17·7 (sd 0·7) g (P < 0·001, n 10 per group). At 24 h after refeeding, the body weights did not significantly differ among the mice refed on the four levels of casein used (20·2 (sd 0·9) g for 3 %, 20·8 (sd 0·6) g for 15 %, 21·0 (sd 0·8) g for 35 % and 19·9 (sd 1·2) g for 50 %; n 10 per group). The liver weights also decreased following fasting for 48 h (P = 0·002), and then recovered to the pre-fasting levels within 2 h of refeeding in all dietary groups (Fig. 1(B)). The liver weights were significantly lower in mice refed the 50 % casein diet compared with the 15 % casein diet at 3, 8, 11 and 24 h after refeeding. Mice that had been refed the 35 % casein diet showed lower liver weights than those in the 15 % casein diet group at 3, 8 and 24 h.
(A) Food intake and (B) liver weights in mice refed on diets with four levels (3, 15, 35 or 50 %) of casein. Values are means (n 5 per test group at each time point), with standard deviations represented by vertical bars. − 48 h, pre-fasting; 0 h, end of fasting for 48 h (start of refeeding). a,b Mean values with unlike letters were significantly different for the same time point (P < 0·05; Tukey's honestly significant difference test). * Mean values were significantly different from those of normal (pre-fasting) levels (P < 0·05; unpaired Student's t test). –○–, 3 % Casein diet; –△–, 15 % casein diet; –●–, 35 % casein diet; –▲–, 50 % casein diet.

Measurement of serum urea nitrogen, total protein, albumin, glucose, inorganic phosphorus and total bilirubin levels
Fasting for 48 h had no significant effects on serum urea N, total protein or albumin levels in the subject mice (Fig. 2(A)–(C)). However, in mice refed the 35 or 50 % casein diets, serum urea N levels substantially increased by 2 h after refeeding had started (P < 0·001 and P < 0·001), and remained at these higher levels for 24 h after refeeding (Fig. 2(A)). Animals that had been refed the 15 % casein diet exhibited higher levels of serum urea N than the normal (pre-fasting) levels at 2, 3 and 8 h (P < 0·001, P < 0·001 and P = 0·003). In contrast, in the 3 % casein diet refed group, serum urea N levels decreased below normal levels by 3 h after refeeding (P < 0·001) and remained at these levels for 24 h. Serum total protein levels in the 35 or 50 % casein diet groups were found to be maintained at normal pre-fasting levels until 24 h after refeeding (Fig. 2(B)). Mice that had been refed the 15 % casein diet showed lower than normal total protein levels at 11 h (P = 0·023). In mice refed the 3 % casein diet, serum total protein levels were lower than normal at 8 and 24 h (P = 0·013 and P = 0·018). The serum albumin levels of mice refed the 50 % casein diet were higher than the normal pre-fasting concentration at 11 h after refeeding (P = 0·013; Fig. 2(C)). In contrast, in the 3, 15 or 35 % casein diet groups, these levels were not significantly different from normal throughout the experimental period.
Serum levels of (A) urea N, (B) total protein, (C) albumin, (D) glucose, (E) inorganic phosphorus and (F) total bilirubin in mice refed on diets with four levels (3, 15, 35 or 50 %) of casein. Values are means (n 5–6 per test group at each time point), with standard deviations represented by vertical bars. Abscissas are the same as in Fig. 1. a,b,c,d Mean values with unlike letters were significantly different for the same time point (P < 0·05; Tukey's honestly significant difference test). * Mean values were significantly different from those of normal (pre-fasting) levels (P < 0·05; unpaired Student's t test). –○–, 3 % Casein diet; –△–, 15 % casein diet; –●–, 35 % casein diet; –▲–, 50 % casein diet.

Serum glucose levels decreased in mice following fasting for 48 h (P < 0·001), and then recovered to a level that was above the normal pre-fasting levels within 2 h of refeeding in all dietary groups (Fig. 2(D)). Serum inorganic P levels were decreased by fasting for 48 h (P = 0·029), but then returned to the normal pre-fasting levels within 8 h of refeeding, and persisted until 24 h after refeeding, in all dietary groups (Fig. 2(E)). Fasting for 48 h also led to an increase in serum bilirubin levels (P = 0·01; Fig. 2(F)). In the 35 % casein diet group, these levels were higher than normal at 8 and 11 h after refeeding (P = 0·033 and P = 0·01) and in the 15 and 50 % casein groups, this was found to be the case at 3 and 11 h, respectively (P = 0·013 and P = 0·027). In contrast, in the 3 % casein diet group, bilirubin levels remained normal until 24 h after refeeding.
When mice were administered a test diet containing 3, 15, 35 or 50 % casein immediately after ingestion of the 15 % casein diet for 9 d without fasting for 48 h, their blood parameters, except for urea N, at 0, 2, 3, 8, 11 and 24 h after administration of the test diets were not significantly different from those of mice given the 15 % casein diet for 7 d (at − 48 h in Fig. 2(B)–(F)), and were not affected by dietary protein levels (data not shown). In mice administered the 35 and 50 % casein diets immediately after ingestion of the 15 % casein diet for 9 d without fasting for 48 h, serum urea N levels progressively increased to 226 (sd 46) and 283 (sd 43) mg/l by 24 h after administration of these test diets, respectively. In contrast, in mice administered the 3 % casein diet immediately after ingestion of the 15 % casein diet for 9 d, serum urea N levels progressively decreased to 86 (sd 11) mg/l by 24 h after administration of this test diet. There was no significant difference in serum urea N levels between mice given the 15 % casein diet for 7 and 10 d (data not shown).
Development of hepatic parenchymal cell injury
Hepatic parenchymal cell injury was predicted from the observed increases in serum ALT and AST activities in our subject mice. Fasting for 48 h had no significant effects on either of these activities (Fig. 3(A) and (B)). In the 50 % casein diet group, both ALT and AST showed abnormally high activities within 2 h of refeeding (P = 0·004 and P = 0·001), remained elevated until at least 11 h and then returned to near normal levels by 24 h. At 3 h after refeeding, the serum ALT and AST activities of mice on the 50 % casein diet were 8·4- and 4·1-fold higher than the normal pre-fasting levels, respectively (P = 0·006 and P = 0·001). Mice in the 35 % casein diet group exhibited moderate and transient increases in their serum ALT and AST activities at 2 h after refeeding (P < 0·001 and P < 0·001). In contrast, the 3 % casein diet group showed only a mild increase in the activities of these enzymes at 8–11 h after refeeding (P = 0·002 for ALT at 8 and 11 h; P = 0·004 for AST at 8 and 11 h). In mice receiving the 15 % casein diet, serum ALT activity slightly increased at 8–11 h (P = 0·032 and P < 0·001), whereas serum AST activity remained at normal levels for 24 h after refeeding.
Serum levels of (A) alanine aminotransferase (ALT) and (B) aspartate aminotransferase (AST) in mice refed on diets with four levels (3, 15, 35 or 50 %) of casein. Values are means (n 5–6 per test group at each time point), with standard deviations represented by vertical bars. Abscissas are the same as in Fig. 1. a,b,c Mean values with unlike letters were significantly different for the same time point (P < 0·05; Tukey's honestly significant difference test). * Mean values were significantly different from those of normal (pre-fasting) levels (P < 0·05; unpaired Student's t test). –○–, 3 % Casein diet; –△–, 15 % casein diet; –●–, 35 % casein diet; –▲–, 50 % casein diet.

Because the 50 and 35 % casein diets produced different increases in serum ALT and AST activities, we examined the effects of diets containing 40 and 45 % casein. Mice were again fasted for 48 h and then refed the diets containing 35, 40, 45 or 50 % casein for 3 h (Table 1). In animals refed with 35–50 % casein, serum ALT and AST activities increased in proportion to the protein contents (Fig. 4(A) and (B)). This indicated that a refeed with a higher protein content increases the risk of acute hepatocellular injury. Significantly, when a 49 % soyabean protein diet or a 52 % wheat gluten diet was used, serum ALT and AST activities increased to the same extent as the 50 % casein diet, consistent with the equivalent levels of protein from these three sources (casein+dl-methionine, soyabean protein and wheat gluten; data not shown).
Serum levels of (A) alanine aminotransferase (ALT) and (B) aspartate aminotransferase (AST) in mice refed on diets with 35, 40, 45 or 50 % casein for 3 h. Values are means (n 5 per test group), with standard deviations represented by vertical bars. a,b,c Mean values with unlike letters were significantly different for the same time point (P < 0·05; Tukey's honestly significant difference test).

When mice were administered a test diet containing 3, 15, 35 or 50 % casein immediately after ingestion of the 15 % casein diet for 9 d without fasting for 48 h, their serum ALT and AST activities at 0, 2, 3, 8, 11 and 24 h after administration of the test diets were not significantly different from those of mice given the 15 % casein diet for 7 d (at − 48 h in Fig. 3(A) and (B)), and were not affected by the dietary protein levels (data not shown).
Expression of specific genes in the liver
HSP72, a highly stress-inducible 72 kDa protein, has a crucial cytoprotective function mediated by its role as a molecular chaperone(Reference Gething and Sambrook16, Reference Galloway, Shin and Huber17). Fasting for 48 h had no significant effects on liver Hsp72 expression levels in mice (Fig. 5(A)), but these transcripts were transiently elevated in the 3, 15 and 35 % casein groups by 16-, 9- and 7-fold over the normal pre-fasting levels by 2 h after refeeding, respectively (P = 0·001, P < 0·001 and P = 0·017). In contrast, mice in the 50 % casein diet group exhibited only a slight increase in liver Hsp72 expression (P < 0·001).
Liver mRNA levels of (A) heat shock protein 1A (Hsp72), (B) FBJ osteosarcoma oncogene (c-fos), (C) nuclear receptor subfamily 4, group A, member 1 (nur77), (D) growth arrest and DNA-damage-inducible 45 gamma (Gadd45g), (E) B-cell translocation gene 2 (Btg2) and (F) uracil-DNA glycosylase (Ung) in mice refed on diets with four levels (3, 15, 35 or 50 %) of casein. The transcript levels for each gene are expressed as relative mRNA levels normalised to Gapdh. Values are means (n 5–6 per test group at each time point), with standard deviations represented by vertical bars. Abscissas are the same as in Fig. 1. a,b,c Mean values with unlike letters were significantly different for the same time point (P < 0·05; Tukey's honestly significant difference test). * Mean values were significantly different from those of normal (pre-fasting) levels (P < 0·05; unpaired Student's t test). –○–, 3 % Casein diet; –△–, 15 % casein diet; –●–, 35 % casein diet; –▲–, 50 % casein diet.

c-Fos and nur77 are members of the immediate-early genes, and encode members of the leucine-zipper family of transcription factors(Reference Ishii, Abe and Saito18). These proteins regulate the cellular response genes after injury that are associated with tissue repair and cell apoptosis(Reference Hui, Mizuguchi and Sugiyama19). We found that fasting for 48 h resulted in only a slight increase in their c-fos and nur77 levels (P = 0·046 and P = 0·011; Fig. 5(B) and (C)). However, both of these genes were found to be transiently increased in the 50 % casein diet group by 20- and 30-fold, respectively, by 3 h after refeeding (P = 0·007 and P = 0·002; Fig. 5(B) and (C)). In contrast, there was no apparent elevation of liver c-fos and nur77 levels in the 3, 15 or 35 % casein groups.
Gadd45g is a DNA-damage-inducible protein(Reference Jung, Yi and Kim20, Reference Zhang, Bae and Krishnaraju21), Btg2 is induced by genotoxic stress and has strong antiproliferative properties(Reference Matsuda, Rouault and Magaud22, Reference Tirone23), and UNG is a DNA base-excision repair enzyme(Reference Pearl24). Fasting for 48 h had no significant effects on liver Gadd45g mRNA levels (Fig. 5(D)), but resulted in a slight increase in liver Btg2 and Ung transcript levels (P = 0·001 and P = 0·003; Fig. 5(E) and (F)). In the 35 % casein diet group, liver Gadd45g expression levels were found to be transiently elevated by 2·8-fold at 2 h after the commencement of refeeding (P = 0·015; Fig. 5(D)). In mice refed the 50 % casein diet, liver Gadd45g expression levels increased by 2·2-fold at 2 h after refeeding (P < 0·001) and stayed at these elevated levels until 3 h. In contrast, in the 3 or 15 % casein diet groups, liver Gadd45g expression levels were maintained below normal until 24 h after refeeding. Liver Btg2 expression levels were found to be transiently increased in the 50 % casein diet group by 5-fold at 3 h after refeeding (P = 0·024; Fig. 5(E)). In contrast, these levels in the 3, 15 or 35 % casein diet groups were maintained below the levels seen after 48 h of fasting. Liver Ung expression was increased in the 50 % casein diet group by 2-fold (P = 0·01) and in the 35 % casein diet by 4-fold (P < 0·001) over the normal levels by 3 h after refeeding (Fig. 5(F)). In the 3 or 15 % casein groups, however, liver Ung expression was maintained below that observed after refeeding for 48 h.
CRP is primarily produced by the liver and secreted in elevated quantities in response to inflammation(Reference Schultz and Arnold25). Liver Crp expression levels decreased to 83 % of the pre-fasting levels following fasting for 48 h and then further decreased to 28, 41, 68 and 64 % by 24 h after refeeding the test diets containing 3, 15, 35 and 50 % casein, respectively (data not shown; Table 2). There was no significant difference in liver Crp expression levels among the different casein dietary groups at 2 and 3 h after refeeding. Although mice refed the 35 or 50 % casein diet had a higher liver Crp expression at 8, 11 and 24 h after refeeding than mice refed the 3 or 15 % casein diet, no significant difference in liver Crp expression levels was found between the 35 and 50 % casein diet groups (data not shown).
Concise summary of changes in various indices induced by fasting and refeeding with diets containing different levels of casein

ALT, alanine aminotransferase; AST, aspartate aminotransferase; Hsp72, heat shock protein 72; c-fos, FBJ osteosarcoma oncogene; nur77, nuclear receptor subfamily 4, group A, member 1; Gadd45g, growth arrest and DNA-damage-inducible 45 gamma; Btg2, B-cell translocation gene 2, anti-proliferative; Ung, uracil-DNA glycosylase; Crp, C-reactive protein; GST, glutathione S-transferase; CAT, catalase; SOD, superoxide dismutase; TBARS, thiobarbituric acid-reactive substances.
* No significant changes or only a slight increase or decrease.
† Returned to normal pre-fasting levels.
When mice were administered a test diet containing 3, 15, 35 or 50 % casein immediately after ingestion of the 15 % casein diet for 9 d without fasting for 48 h, their expressions of specific genes in the liver at 0, 2, 3, 8, 11 and 24 h after administration of the test diets were not significantly different from those of mice given the 15 % casein diet for 7 d (at − 48 h in Fig. 5(A)–(F)), and were not affected by the dietary protein levels (data not shown).
Serum corticosterone levels and liver thiobarbituric acid-reactive substances levels
Serum corticosterone levels are involved in the suppression of inflammation(Reference Munck, Guyre and Holbrook26). Fasting for 48 h appeared to increase serum corticosterone levels (pre-starved v. starved, 122 (sd 50) v. 344 (sd 103) ng/ml serum; P = 0·02; n 5 per group) and liver TBARS levels (0·30 (sd 0·03) v. 1·79 (sd 0·69) μmol malondialdehyde/g tissue; P = 0·005; n 5 per group). These elevated levels returned to normal pre-fasting levels within 8 and 24 h, respectively, after refeeding in all dietary groups (data not shown; Table 2). There were no significant differences found in serum corticosterone or liver TBARS levels among the different casein dietary groups throughout the experimental period (data not shown).
TNF-α, IL-1β and IL-6 levels in liver and serum
Fasting for 48 h had no significant effects on liver TNF-α (Fig. 6(A)) and IL-1β (data not shown; Table 2) levels in mice. In all of the dietary groups, however, liver TNF-α and IL-1β levels decreased to below normal levels within 11 and 24 h after refeeding, respectively. Liver IL-6 levels increased following fasting for 48 h (P < 0·001), and then returned to the pre-fasting levels within 11 h after refeeding in all dietary groups (Fig. 6(B)). Mice that had been refed the 50 % casein diet exhibited similar or lower levels of liver TNF-α, IL-1β and IL-6 than those refed the 3, 15 or 35 % casein diet throughout the experimental period.
Liver (A) TNF-α and (B) IL-6 levels in mice refed diets with four levels (3, 15, 35 or 50 %) of casein. Values are means (n 5–6 per test group at each time point), with standard deviations represented by vertical bars. Abscissas are the same as in Fig. 1. a,b Mean values with unlike letters were significantly different for the same time point (P < 0·05; Tukey's honestly significant difference test). * Mean values were significantly different from those of normal (pre-fasting) levels (P < 0·05; unpaired Student's t test). –○–, 3 % Casein diet; –△–, 15 % casein diet; –●–, 35 % casein diet; –▲–, 50 % casein diet.

Serum TNF-α, IL-1β and IL-6 levels were below the detection limits of the assay during the experimental period in all dietary groups (data not shown).
Activity of antioxidant enzymes in the liver
Fasting for 48 h did not significantly affect liver glutathione S-transferase, catalase and superoxide dismutase activities (data not shown; Table 2). In all of the dietary groups, liver glutathione S-transferase and catalase activities decreased to approximately 55 and 60 % of the pre-fasting levels by 8 h after refeeding, respectively, and remained at these decreased levels until 24 h after refeeding, with no significant differences being observed among the groups (data not shown). In all of the dietary groups, liver superoxide dismutase activity also decreased to approximately 70 % of the pre-fasting levels by 8 h after refeeding, and then returned to the normal levels within 24 h after refeeding, and was not affected by dietary protein levels (data not shown).
Discussion
In a previous study, healthy rats that were fed a high-protein (45 % casein) diet for 2 weeks showed only marginally higher serum ALT (23·3 (sd 0·8) IU/l) and AST (57·0 (sd 5·8) IU/l) activities than rats consuming a normal protein (20 % casein) diet (ALT, 19·2 (sd 0·8); AST, 42·1 (sd 2·0) IU/l)(Reference Bolter and Critz8). In the present study in healthy mice, however, refeeding with a 50 % casein diet after 48 h of fasting led to a rapid (within 2–3 h) and abnormal elevation in serum ALT and AST activities (Fig. 3). In addition, refeeding of these mice with the 40, 45 or 50 % casein diets increased serum ALT and AST activities in proportion to the dietary casein content (Fig. 4). The 50 % casein diet caused a marked increase in liver c-fos and nur77 expression levels (Fig. 5(B) and (C)). It is noteworthy in this regard that the expression of immediate-early genes such as c-fos and nur77 has been shown previously to increase in the liver after various insults, and to be associated with severe hepatic damage, followed by liver regeneration(Reference Ishii, Abe and Saito18, Reference Hui, Mizuguchi and Sugiyama19). Hence, the present results indicate that refeeding with a high-protein diet after fasting causes hepatocellular injury in healthy mice, the risk of which increases in proportion to the dietary protein content.
Ozawa et al. (Reference Ozawa, Shimizu and Shishiba13) have previously reported a mild to moderate increase in serum ALT and AST activities in patients with anorexia nervosa following refeeding therapy, and suggested that this was due to an abrupt and rapid increase in energy intake. In the present study, energy intake in the 50 % casein diet was equivalent to the 3 or 15 % casein diet but less than that of the 35 % casein diet within 0–8 h after the commencement of refeeding (Fig. 1(A)). However, severe and abnormal increases in serum ALT and AST activities were observed only in mice refed the 50 % casein diet. These results suggest that an abrupt increase in the metabolic burden of amino acids rather than a rapid increase in energy caused increases in ALT and AST activities. All of the casein diet groups showed excessive food intake during the 3 h period after the start of refeeding, but this decreased greatly afterwards up to the 24 h time point (Fig. 1(A)). This feeding pattern may be responsible for acute and transient, but not persistent, elevations observed for serum ALT and AST activities in the 50 % casein diet group. Although the carbohydrate (α-maize starch and sucrose) content of the 50 % casein diet was lower than that of the other diets (Table 1), serum glucose levels in the animals receiving this diet returned to the normal pre-fasting levels within 2 h after refeeding and remained at this normal level for a further 9 h (Fig. 2(D)). It is thus tempting to speculate that the low carbohydrate content of the 50 % casein diet may not contribute to the up-regulation of ALT and AST, but further studies will be necessary to confirm this.
Gadd45g is a sensitive marker of DNA damage resulting from a variety of insults, and is therefore an important regulator of cell survival(Reference Jung, Yi and Kim20, Reference Zhang, Bae and Krishnaraju21). UNG is the principal mammalian enzyme that removes misincorporated uracil from DNA(Reference Pearl24). In mice that had been refed the 35 % casein diet, liver Gadd45g and Ung expression levels rapidly increased, such that Ung expression was greater than that in the 50 % casein diet group (Fig. 5(D) and (F)), although serum ALT and AST activities did not increase above the normal levels. These results suggest that the 35 % casein diet caused DNA damage in the hepatocytes, although this did not lead to acute hepatocellular injury.
The enhanced expression of HSP72 has been shown to reduce tissue injury in response to stress stimuli and improve cell survival in experimental models of stroke, sepsis, renal failure and myocardial ischaemia(Reference Gething and Sambrook16, Reference Galloway, Shin and Huber17, Reference Hotchkiss, Nunnally and Lindquist27). Hyperthermia preconditioning induces a 4-fold increase in liver HSP72 expression and almost completely suppresses lipopolysaccharide-induced serum ALT and AST elevation in cirrhotic rats(Reference Mikami, Otaka and Goto28). In the present analyses, liver Hsp72 expression levels were found to be rapidly and transiently up-regulated after the commencement of refeeding, but this elevation was markedly attenuated in the 50 % casein diet group (Fig. 5(A)). This result suggests that the HSP72-mediated cytoprotective system was not fully activated in the 50 % casein mice and could not sufficiently alleviate the pathological conditions that follow hepatocellular injury.
It has been reported previously that inflammation and oxidative stress contribute to the development of hepatocellular injuries (e.g. ischaemia–reperfusion injury)(Reference Klune and Tsung29, Reference Muzio, Marengo and Salvo30). In clinical settings, hypophosphataemia is often observed following the administration of a nutritional regimen to patients who are starved or severely malnourished, and is considered to be a major risk factor for the suppression of liver and cardiac functions(Reference Saito, Yojo and Miyashita31). In the present study, refeeding the high-protein (50 % casein) diet resulted in no increase in inflammatory cytokine and TBARS levels in the liver and no decrease in serum inorganic P levels (Fig. 2(E)). These findings rule out the possibility that acute hepatocellular injury observed with a high-protein diet was due to promotions of inflammation and lipid peroxidation in the liver and the development of hypophosphataemia during the refeeding period. On the other hand, further studies are needed to determine whether increases in liver IL-6 and lipid hydroperoxide levels and a decrease in serum inorganic P levels in the fasting state contribute to the high-protein diet-induced damage of the liver. The search for other physiological changes during the fasting and refeeding periods in the liver and other tissues should facilitate future studies of the mechanism(s) underlying acute hepatocellular injury caused by refeeding a high-protein diet.
Extremely high-protein, low-carbohydrate diets are popular approaches to achieving weight loss. However, the present results suggest that refeeding with a high-protein diet after fasting causes acute hepatocellular injury in healthy animals.
Acknowledgements
This study was supported in part by a Grant-in Aid for Science Research (no. 21580135) from the Ministry of Education, Culture, Sports, Science and Technology of Japan. There are no conflicts of interest. M. O. designed and performed the research, analysed the data, and wrote the manuscript; T. T., T. N. and S. K. performed the research; K. H. analysed the data; T. G. designed the research and wrote the manuscript.



