




Introduction
The final unstressed vowel in words such as happy, baby, and chilly, labeled the happy vowel by Wells (Reference Wells1982), is relatively neglected in variationist studies, despite being subject to pronounced geographical variability throughout the UK. The present paper seeks to address this by conducting a thorough sociolinguistic analysis of variation in the vowel in the English spoken in Manchester, Northern England, a variety which shows variation along a continuum from local open [ë], supra-local Northern lax [ɪ], and modern national prestige tense [i(:)].
For the most part, studies of happy in English have tended to focus on the shift in Received Pronunciation (RP) in recent years. This saw a traditionally lax [ɪ]-like vowel move to a tense [i(:)]-like vowel, most famously reported over the lifespan of Queen Elizabeth II (Harrington, Reference Harrington2006). Apart from this, descriptions of the happy vowel are largely based on geographic observations of variation. Generally, the variation in England today is said to follow the North–South divide, with Southerners having tense [i(:)] and Northerners having lax [ɪ] (Foulkes & Docherty, Reference Foulkes, Docherty and Britain2007:66; Hughes et al., Reference Hughes, Trudgill and Watt2012:62; Wells, Reference Wells1982:165-166), with the Northern cities of Liverpool, Newcastle, and Stoke-on-Trent being exceptions to the rule, that is, having tense vowels (Wells, Reference Wells1982:166).
While Manchester traditionally fits into the Northern pattern of lax [ɪ], the co-existence of open variants approximating [ë] seems to have become more salient in recent years, particularly to outsiders. At the same time, a tense variant can occur, too, particularly in middle-class speech, likely originating outside of the speech community. In this paper, we use acoustic analysis to model variation and potential change across a range of social and linguistic factors: socioeconomic status, age, ethnicity, gender, and style, alongside linguistic factors such as vowel harmony; preceding consonant; stress of the preceding vowel; and positional context. This investigation contributes more broadly to our understanding of vocalic variation in Northern Englishes across a large sample and carefully stratified socioeconomic spectrum; it provides a rare window into the unstressed vowel system, which is often excluded from more general analyses of the vowel space.
In addition, variation in the realization of the happy vowel allows us to test the hypothesis according to which linguistic constraints on variation are largely independent of social ones (Labov, Reference Labov1994:3, Reference Labov2001:103; Weiner & Labov, Reference Weiner and Labov1983). This hypothesis has been shown to be generally true, particularly for stable consonantal variables such as TD-deletion (Guy, Reference Guy and Labov1980) and (ING), where the grammatical constraints show the same ordering in different social groups (Labov, Reference Labov2001:103), but it has been supported less robustly for vocalic variables thus far.
The research questions are as follows:
(1) Is happy undergoing a change in progress in Manchester?
(2) What social factors, such as class, ethnicity, and gender, condition variation in the Manchester happy vowel?
(3) Is there any evidence of social awareness and evaluation of tensing and laxing as indicated by style-shifting patterns?
(4) Does the happy vowel provide evidence supporting the hypothesis of the independence of linguistic factors from social ones?
Previous studies
Social factors
Manchester English is a variety of Northern English, in which speakers have no distinction between the foot and strut vowels (Turton & Baranowski, Reference Turton and Baranowski2021a) or the trap and bath vowels. Generally, the Manchester happy vowel conforms to the pattern described in the existing dialect literature, which reports the general area around the city as having lax [ɪ] (Ellis, Reference Ellis1889:318; Ihalainen, Reference Ihalainen and Robert1994:258; Orton, Reference Orton1962:34). Although this may suggest that the hyper-lax open [ë] variant is a comparatively new phenomenon, we have had evidence of it in Stockport (Greater Manchester) since Lodge’s (Reference Lodge1978) study of a teenager, suggesting it has at least been around for the past 50 years.
As mentioned above, happy studies have predominantly focused on the recent sound change in Southern English varieties toward a tense variant. It could, therefore, be the case that this change toward tenseness might take effect in the North as well.Footnote 1 We have reported elsewhere that the upper middle classes of Manchester resemble Southerners in some variables, such as having a foot/strut distinction (Turton & Baranowski, Reference Turton and Baranowski2021a), a fronted goat vowel (Baranowski, Reference Baranowski2017), clearer word-initial /l/ (Turton, Reference Turton2014; Turton & Baranowski, Reference Turton and Baranowski2021b), and a lack of distinction between the north and force vowels (Baranowski, Reference Baranowski2022), so it would not be totally unexpected to see happy-tensing show up in Manchester, as well. This, however, would be in stark contrast to the traditional system, where the vowel is reported to be lax or, in recent decades, reported to be hyper-lax.
In the North of England, the tenseness of the happy vowel is said to increase with higher social classes (Windsor-Lewis, Reference Windsor-Lewis and Ramsaran1990), a claim that, though impressionistic, aligns with observations of British English speech. Indeed, a modern Northern variant, falling somewhere between kit and fleece, is found for General Northern English speakers in the English Dialects App Corpus (Strycharczuk et al., Reference Strycharczuk, López-Ibáñez, Brown and Leemann2020:12), that is, university-educated, young speakers in the North. Although the dialect app study does not give us any indication of potential change over time (so we do not know if this has mirrored the shift in RP), it does demonstrate that more middle-class educated Northerners have relatively tense vowels. If a more open/lax vowel is associated with lower social classes, we may expect negative associations with this realization. Indeed, an open happy vowel in areas of the North was described by Beal (Reference Beal, Bermúdez-Otero, Denison, Hogg and McCully2000:126) as being the “shibboleth of the neighbouring dialects.” Watts (Reference Watts2005) made the case for open [ë] being a highly stigmatized variant, and went as far as saying it is doomed because of its exposed position, that is, because it is more salient pre-pausally. In terms of overt commentary, Kirkham (Reference Kirkham2015) discussed a speaker named Polly (whose name included the vowel in question) overtly commenting on the use of the hyper-lax open variant as something that would be considered “common,” that is, of lower social status.
Consequently, in areas such as Manchester, Cheshire, Sheffield, and Nottingham, with three impressionistically discernible variants (open [ë], lax [ɪ], and tense [i(:)]), we may expect to see social class stratification, that is, higher classes using tenser variants. Interestingly, in these same areas, women and younger speakers—groups typically associated with adopting prestige forms—are reported to show higher rates of the open [ë] variant (Flynn, Reference Flynn2010; Stoddart et al., Reference Stoddart, Upton, Widdowson, Foulkes and Docherty1999). This might be viewed as surprising: If open or lax happy is associated with lower status or perceived as “common,” women might be expected to avoid it.
Watts’ (Reference Watts2005) in-depth study of two social groups in affluent Wilmslow, Cheshire, provides the closest sociolinguistic comparison to Manchester. Although Wilmslow is associated with wealth—the home of several Real Housewives of Cheshire and one of the few Northern areas to remain politically Conservative in the 2024 General Election—it also includes council estates (i.e., a form of publicly provided social housing) extending from Manchester, relocated there in the 1970s. Around 30 years after the relocation, Watts (Reference Watts2005) utilized this socioeconomic contrast as a representation of class in the town and interviewed speakers from both sides of the tracks. Importantly, the teenagers who formed part of this study attended the same high school, uniting the working-class council estates kids with the middle-class wealthy kids for a brief five years of their life; Watts noted that they attended different primary schools and didn’t tend to mix after high school.
As with the aforementioned Northern varieties, although [ɪ] is the traditionally reported variant for Wilmslow, tense variants such as [i:] and [i], as well as open [ë], can also occur alongside the lax variant. Watts (Reference Watts2005) found that all speakers use the pan-Northern variant [ɪ] to some extent, but more open [ë]-like variants are almost exclusively found in the working classes. Tense variants are found across the middle classes, but also notably in the speech of the working-class high school students. She found that these younger speakers are predominantly settled on an in-between variant. For the middle-class speakers, tensing has reached completion in pre-pausal position in Wilmslow (Watts, Reference Watts2005:242), mirroring the shift in RP. Watts (Reference Watts2005:246) noted rapid change in this respect, stating that “the behaviour of the youngest group contrasts sharply with the behaviour of their parents and grandparents,” a similar finding to the cross-generational discontinuities reported in new-town dialect formation research (Payne, Reference Payne and Labov1980; Williams & Kerswill, Reference Williams, Kerswill, Foulkes and Docherty1999).
A similar pattern of social integration influencing dialect acquisition in a second language is found in Manchester itself. Howley (Reference Howley2015) reported that adolescent Romanian-born Roma speakers in a Manchester high school show high rates of local [ë] if they have open friendship networks that include local speakers; the Roma adolescents who have closed friendship networks including only other Roma speakers do not participate in acquiring the local variant.
Linguistic factors
The linguistic factors said to affect happy realization vary rather widely between studies but include predictors such as vowel harmony, some method of prosodic conditioning (such as rhythm or stress), lexically specific effects, and a connection between happy and letter, that is, the final vowel in words such as letter and Manchester. Contextual information, such as the following segment and position in the phrase, has also been reported as conditioning variation (Fabricius, Reference Fabricius2002; Kirkham, Reference Kirkham2015; Local, Reference Local1986), as well as morpho-syntactic conditioning (Halle & Mohanan, Reference Halle and Mohanan1985; Wells, Reference Wells1982:165-166; Windsor-Lewis, Reference Windsor-Lewis and Ramsaran1990). The open variant [ë], in particular, has been found to be stronger in pre-pausal position (Turton & Ramsammy, Reference Turton and Ramsammy2012), so it is more obvious in phrases like I’m so happy rather than happy in Manchester, where it is not as lax.
Several studies suggest that the happy vowel is tenser if the preceding vowel is [i], so the vowel in Healey would be tenser than in hilly, which, in turn, is tenser than in holly (Local, Reference Local1986; Watts, Reference Watts2005; Windsor-Lewis, Reference Windsor-Lewis and Ramsaran1990). Whether this is an allophonic process or merely a longer-term phonetic effect was not explicitly discussed by the authors claiming vowel harmony effects. This harmony pattern is partially borne out by Watts (Reference Watts2005:238) data, where, for working-class speakers in pre-pausal contexts, high preceding vowels, that is, /i:/, tend to trigger more tense realizations of the final vowel, for example, Healey being tenser than hilly. Yet a preceding open vowel seems to trigger similar proportions of lax and tense variants of the happy vowel (Watts, Reference Watts2005:Table 6.11)Footnote 2. At the same time, in middle-class speech, Healey-type words never result in lax or open variants of the final vowel.
Prosodic factors, such as stress, weight, or rhythm, may also play a role. Generally, it is argued that a previous unstressed vowel, as in basically, has a laxing effect and that a long (or heavy) preceding syllable results in a tenser final vowel, for example, in daily versus dally (Kirkham, Reference Kirkham2015; Local, Reference Local1986; Watts, Reference Watts2005). Watts (Reference Watts2005:226) noted further lexically specific effects, such as a speaker using lax [ɪ] for her working-class cousin Casey but tense [i] for her middle-class friends Lucy and Holly.
Finally, happy and letter may participate in a wider subsystemic shift, both moving in parallel. Turton and Ramsammy (Reference Turton and Ramsammy2012) found that letter shows backing with little change in height, a pattern we do not explore here but have examined elsewhere (Baranowski & Turton, Reference Baranowski and Turton2016, Reference Baranowski and Turton2018) and plan to investigate in future work.
Methodology
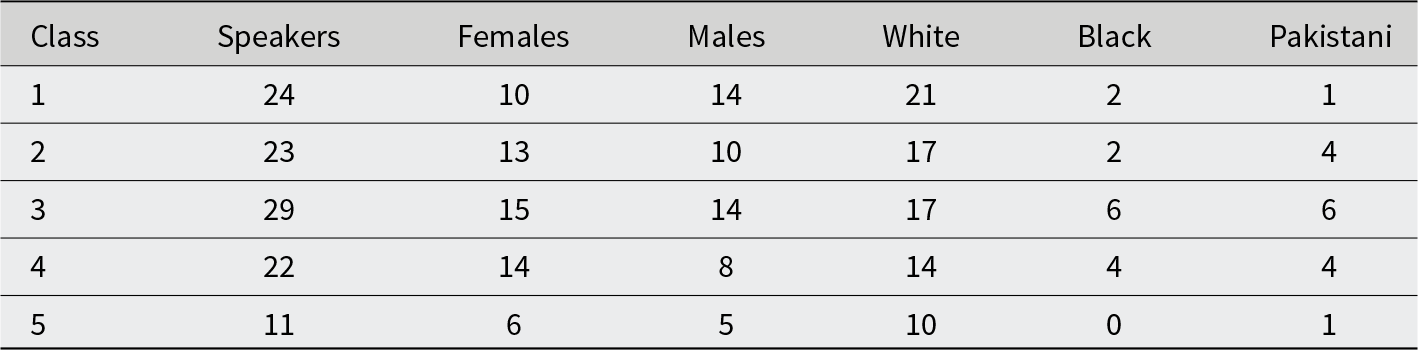
This paper is based on a sample of 109 speakers, aged 16-85, who grew up in Manchester and, in the case of White British Mancunians, whose parents were also local to the area (see Table 1 for breakdown). The three main ethnic groups living in Manchester are represented in the sample by 79 White, 16 Pakistani, and 14 Black Caribbean British speakers. The sample represents the entire socioeconomic spectrum of the city, with socioeconomic status operationalized in terms of five occupational levels, from lower-working as the lowest level, to upper-working, lower-middle, middle-middle, and upper-middle at the highest end of the scale. Socioeconomic status was coded using speakers’ occupational histories (or parents’ status for teenagers), ranging from routine and skilled manual work to administrative/professional and higher professional occupations. The study is part of a larger investigation into variation and change in Manchester (Baranowski, Reference Baranowski2017, Reference Baranowski2022; Baranowski & Turton, Reference Baranowski, Turton and Hickey2015, Reference Baranowski and Turton2020; Turton & Baranowski, Reference Turton and Baranowski2021a, Reference Turton and Baranowski2021b).
Breakdown of speaker numbers across class, age, gender, and ethnicity

Table 1 Long description
The table provides a breakdown of speaker numbers across different classes, focusing on gender and ethnicity. Class 3 has the highest number of speakers, totaling 29, with an equal number of males and females, and a diverse ethnic composition including 17 white, 6 black, and 6 Pakistani speakers. In contrast, Class 5 has the fewest speakers at 11, with a majority being white and only one Pakistani speaker. Class 1 has a slightly higher male representation, while Class 2 has more females. Overall, white speakers are the majority across all classes, with varying numbers of black and Pakistani speakers. The data highlights the diversity in speaker demographics across different classes, with Class 3 being the most balanced in terms of gender and ethnicity.
The speech of the informants was recorded during sociolinguistic interviews (Labov, Reference Labov, Baugh and Sherzer1984) for around 45 minutes to an hour, supplemented with word-list reading. Our stylistic coding includes three spontaneous speech styles: “Narratives” of personal experience; “Careful” speech; “Language” (explicit discussions of language); and “Word-list” reading. The word list comprised up to 10 happy words, most frequently city, happy, Mary, merry, and petty. Each speaker read a subset of these words, yielding 552 tokens across 98 speakers. The interviews were forced-aligned with the Forced-Alignment Vowel Extraction (FAVE) suite developed at the University of Pennsylvania (Rosenfelder et al., Reference Rosenfelder, Fruehwald, Evanini, Seyfarth, Gorman, Prichard and Yuan2014; see also MacKenzie & Turton, Reference MacKenzie and Turton2020), and vowel formants were extracted automatically with new-fave (Fruehwald & Brickhouse, Reference Fruehwald and Brickhouse2025). Formants were normalized using Lobanov’s (Reference Lobanov1971) method and scaled back to Hz. We applied dynamic, percentile‐based filtering to remove tokens whose F1 or F2 fell outside the 1st–99th quantile, computed F2−F1 for the remaining tokens, and then excluded the top and bottom 1% of F2−F1 values to attenuate extreme outliers.
Although all extracted tokens were labeled IY0 by the aligner and are word-final, we manually excluded some tokens. As well as misaligned and partial items, we also targeted those that fall outside the envelope of variation for the happy vowel. These include the following:
• Function words and grammatical items, such as he, me, we, and also the, which typically involve reduction but are not subject to the same sociophonetic variation.
• Acronyms and initialisms like BBC and PhD, where the final [i] is part of a spelled-out sequence rather than a morphological suffix.
• Lexical items with full, stressed final syllables, such as guarantee, tea, and spree, where the final vowel is phonologically tense and does not pattern with unstressed happy vowels but may find itself in sentential unstressed position according to the aligner’s protocol.
We classified the segment immediately before each happy vowel into six broad place-of-articulation groups: lateral consonants (e.g., /l/); rhotics (e.g., /r/); apical nasals (e.g., [n]); labial nasals (e.g., [m]); alveolar stops and fricatives (e.g., /t, d, s, z/); and bilabial stops and fricatives (e.g., /p, b, f, v/), as well as a dorsal category for velar/palatal segments (e.g., /k, g, ŋ/). This scheme captures the primary articulatory context immediately preceding the vowel.
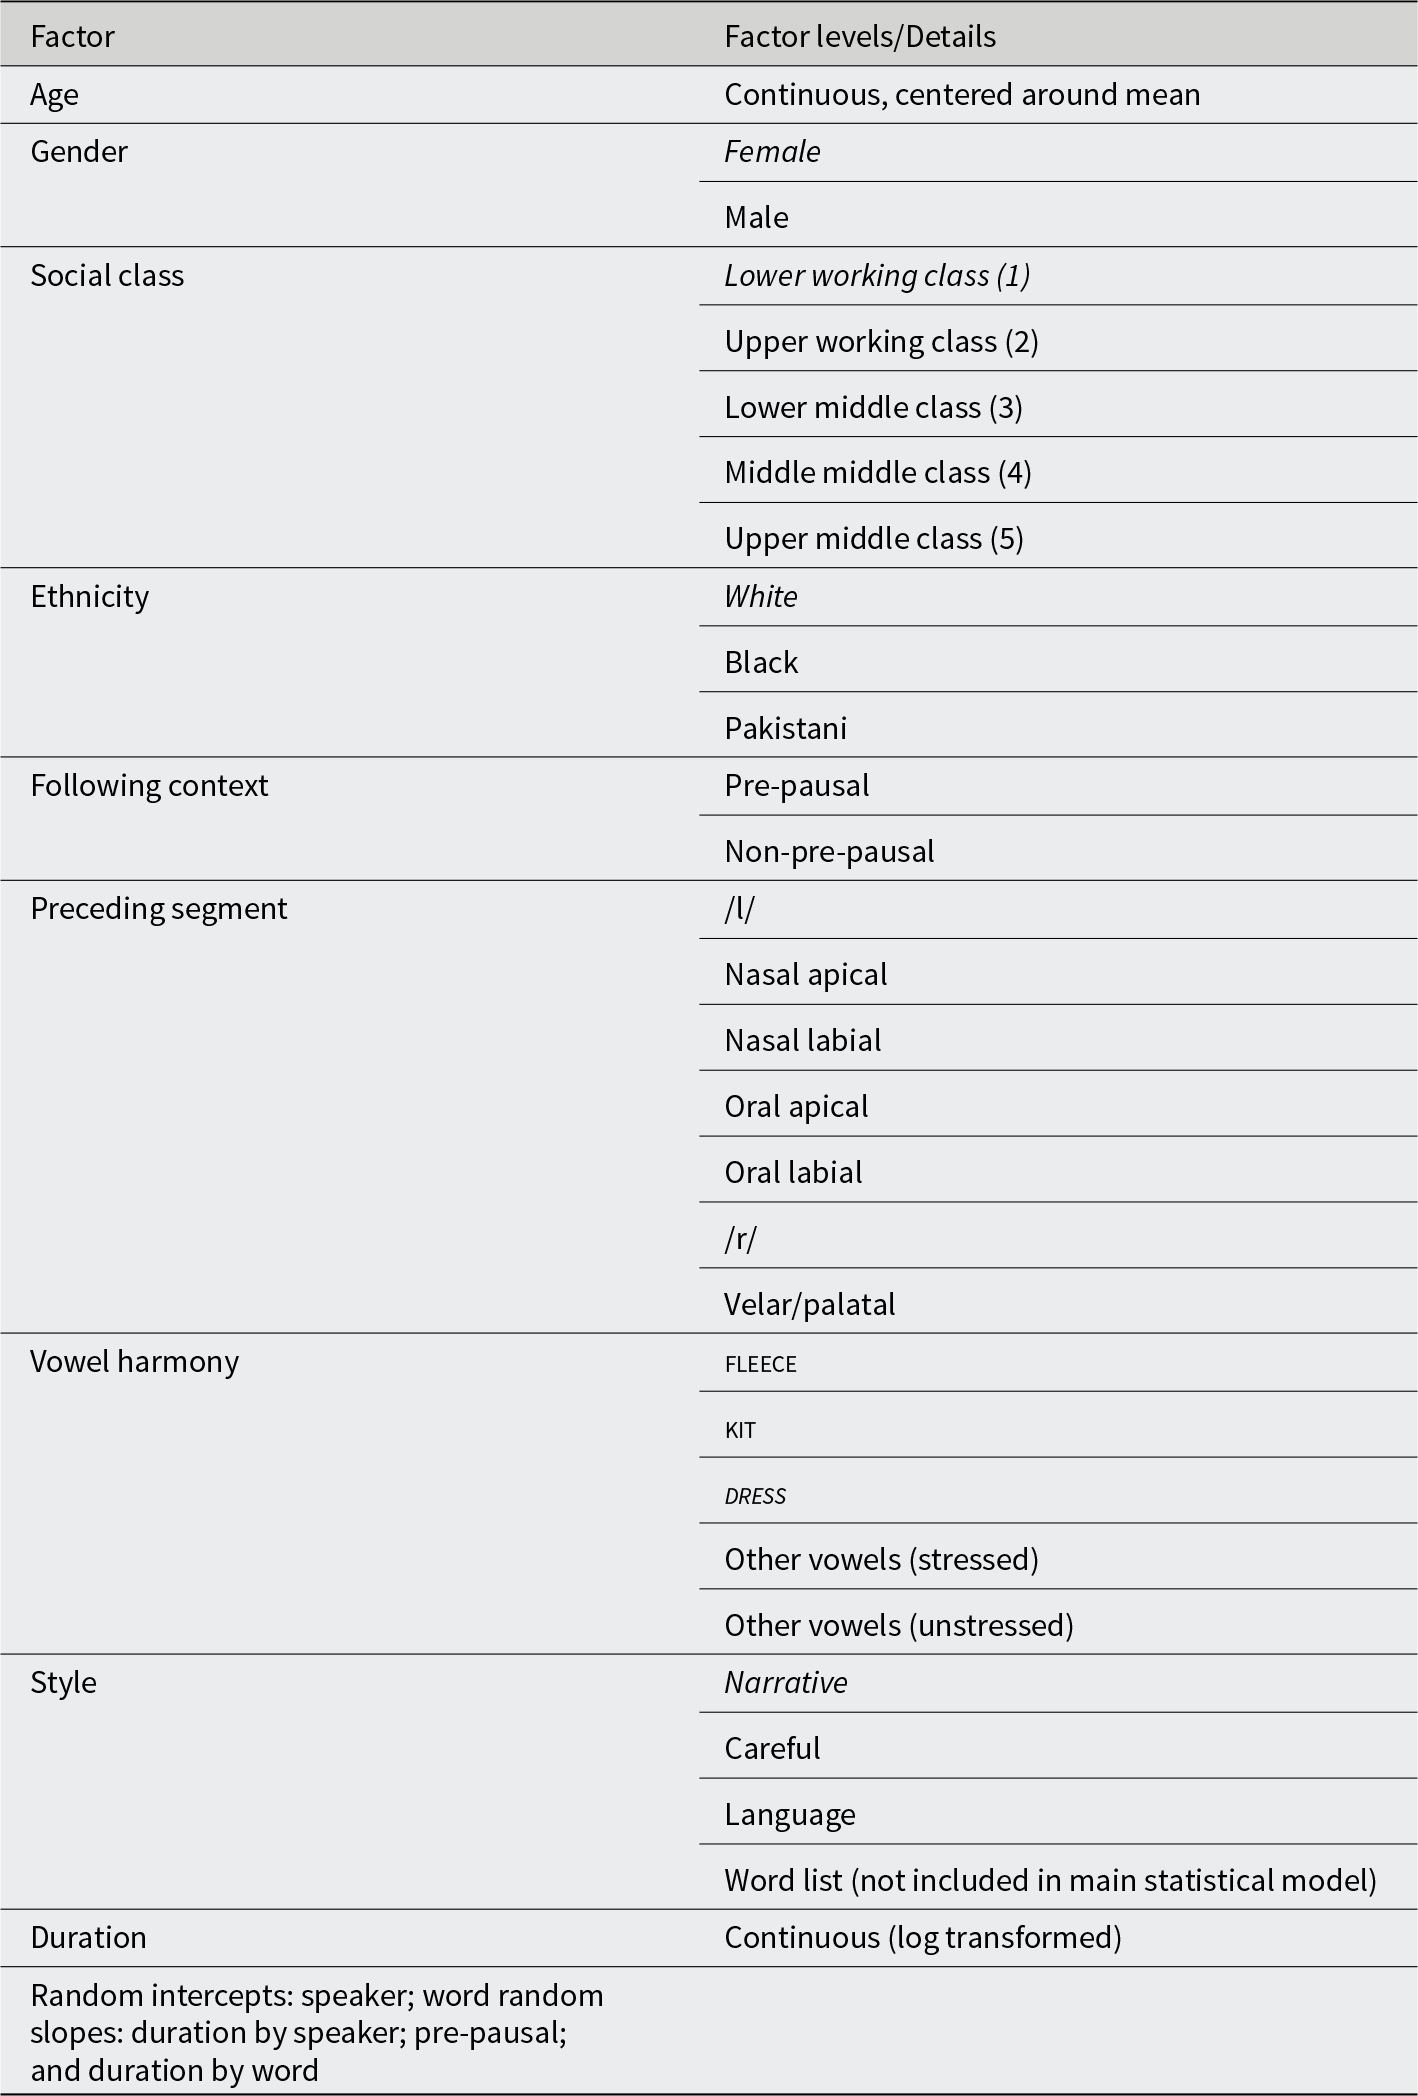
Vowel harmony encodes preceding vowel quality and stress (Table 2): Front vowels are separate levels, and other vowels are split by stress, following Watts (Reference Watts2005). Rhythm was not selected for the final model because we found that the combination of the predictors of rhythm, stress, and vowel harmony accounted for the same set of observations.
Predictors in the model (italics show baseline factors)

Table 2 Long description
This table lists various predictors used in a statistical model, detailing factors such as age, gender, social class, ethnicity, and linguistic context. Age is treated as a continuous variable centered around the mean, while gender is categorized into female and male. Social class is divided into five levels ranging from lower working class to upper middle class. Ethnicity includes White, Black, and Pakistani. Linguistic context factors include pre-pausal and non-pre-pausal contexts, and preceding segments like /l/, nasal apical, and others. Vowel harmony is categorized into fleece, kit, dress, and other vowels, both stressed and unstressed. Style is divided into narrative, careful, language, and word list, though the latter is not included in the main model. Duration is a continuous variable that is log-transformed, with random intercepts for speaker and word, and random slopes for duration by speaker and word, as well as pre-pausal context. These predictors are used to analyze trends and variations in the data, with considerations for random effects.
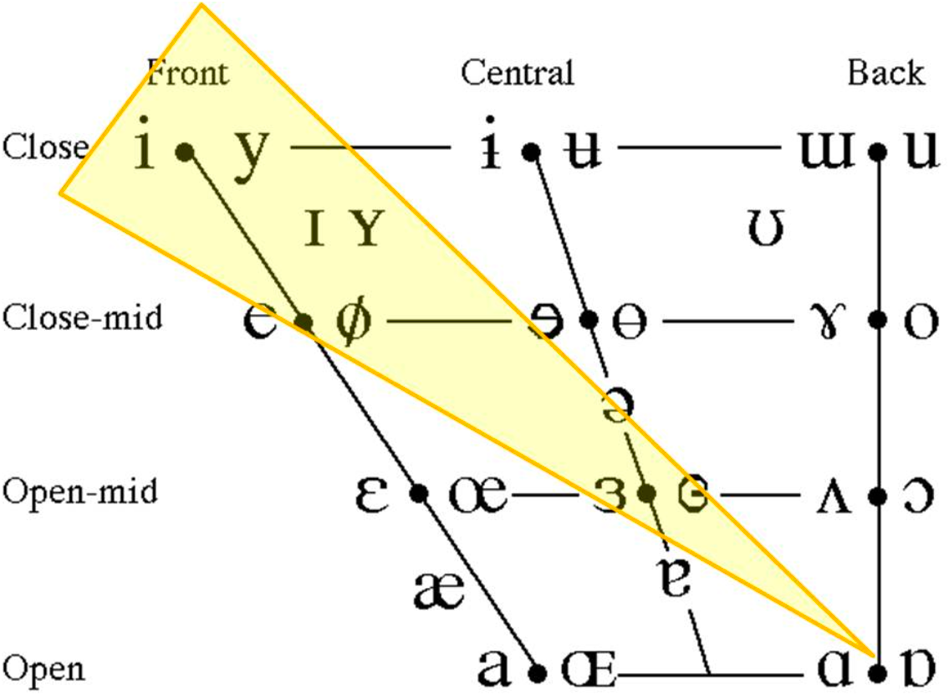
The acoustic measurements are subjected to mixed-effects modeling in the lme4 package in R (Bates et al., Reference Bates, Mächler, Bolker and Walker2015). The dependent variable for this study is the mid-diagonal measure (F2−F1; see Fig. 1), which was identified as the optimal measure for happy in the exploratory data analysis; the higher the value, the tenser the vowel. This measurement captures the variation on both the F1 and F2 dimensions, accounting for the fact that both F1 and F2 are employed to some extent in exhibiting variation along the various social and linguistic factors. F2−F1 (mid diagonal) was selected as the dependent measure based on exploratory comparisons of alternative measures (duration, F1, F2, and the front diagonal, i.e., F2 − 2 × F1 (Labov et al., Reference Labov, Rosenfelder and Fruehwald2013:41)), with best fit by Akaike Information Criterion (AIC), a standard measure used to compare model fit.
Demonstrating the mid-diagonal measure (From Turton and Ramsammy [Reference Turton and Ramsammy2012]).

Figure 1 Long description
A diagram illustrating vowel sounds based on tongue position. The chart is divided into sections: front, central and back, with further divisions into close, close-mid, open-mid and open. Each section contains symbols representing different vowel sounds, arranged to show their relative tongue positions. The front section includes symbols like 'i' and 'y', while the back section includes 'u' and 'o'. The central section features symbols such as 'ɨ' and 'ə'. Lines connect the symbols to indicate their positions within the triangular area representing the vowel space.
The independent variables investigated are shown in the list of predictors in Table 2, which include age, gender, social class, ethnicity, preceding segment, preceding vowel harmony, syllable stress, duration, and style. Note that style does not feature in the main model as we focus only on spontaneous speech (see Appendix B).
We first fitted a mixed-effects model including only the main effects of the social and linguistic predictors. We explored a range of random‐effects structures, beginning with more complex specifications and gradually simplifying until we reached a model that converged reliably. At each step, we prioritized slopes that were both theoretically motivated and supported by the data. The final model included random intercepts for speaker and word, with by‐speaker slopes for duration and by‐word slopes for pre‐pausal position and duration, which provided the best balance between complexity and stability.
To evaluate possible interactions, we tested a set of 15 two-way interaction candidates by adding each individually to the baseline model and comparing model fit using likelihood-ratio tests. Four interactions emerged as significant: class × pre-pausal; ethnicity × pre-pausal; pre-pausal × duration; and class × vowel harmony. We then fitted a maximal model including these four interactions simultaneously. Backward model comparison, dropping each interaction in turn, confirmed that all four contributed significantly to model fit. For clarity of presentation, the main-effects model is reported in the body of the paper (Table 3), with the interaction model presented in Appendix A.
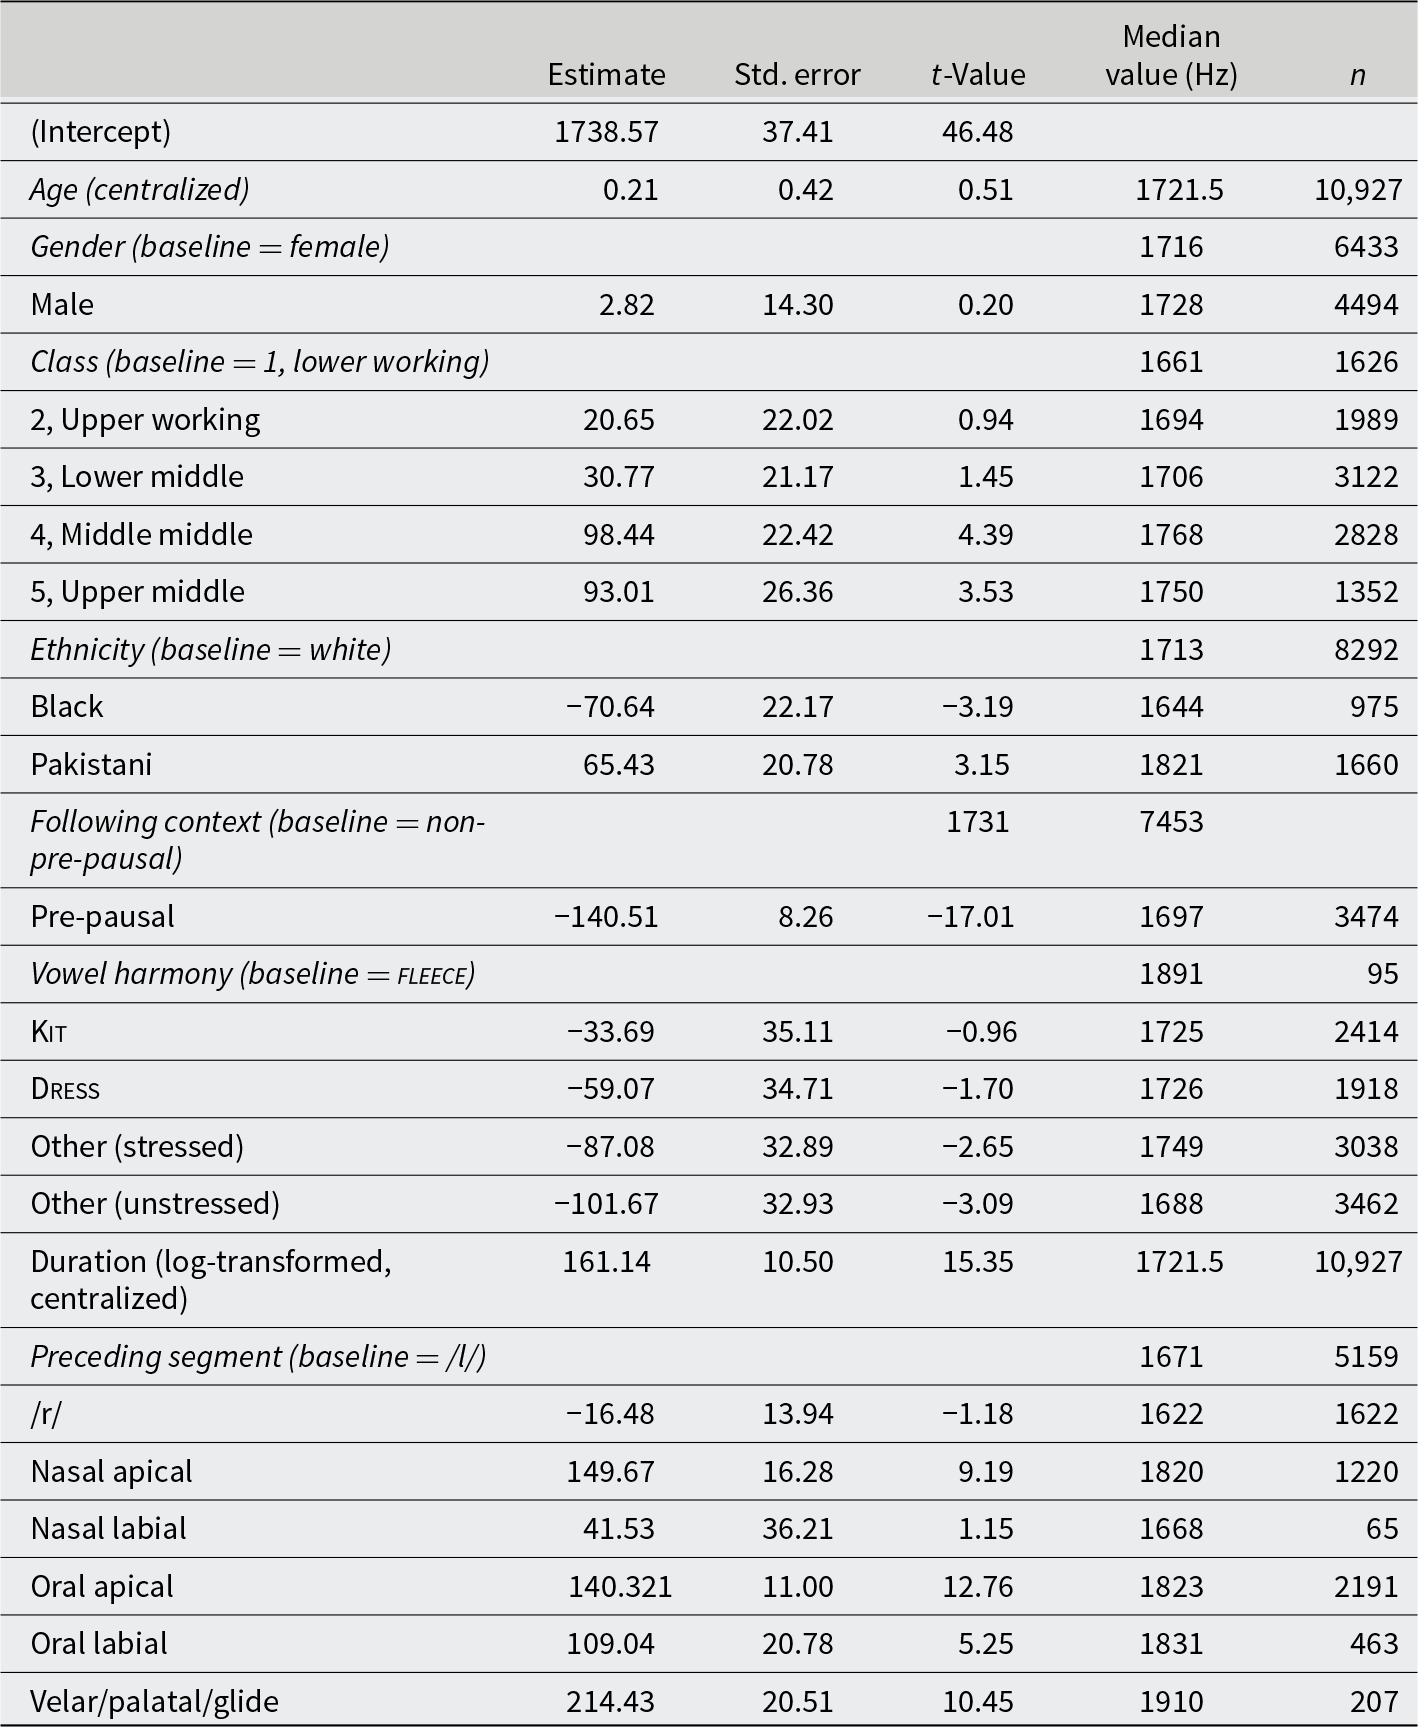
Best model for happy variation with the mid-diagonal F2−F1 as dependent variable; spontaneous speech

Table 3 Long description
The table analyzes the impact of various factors on the mid diagonal F2—F1 value in spontaneous speech. Pre-pausal context significantly lowers the value, with a t-value of -17.01, indicating a strong negative effect. In contrast, oral apical and velar/palatal/glide segments substantially increase the value, with t-values of 12.76 and 10.45, respectively. Ethnicity shows varied effects, with Black ethnicity reducing the value and Pakistani ethnicity increasing it. Class and vowel harmony also influence the value, with middle middle class showing a notable increase. Duration has a strong positive effect, while preceding segments like nasal apical and oral labial also contribute positively. The data suggests that context and phonetic environment play crucial roles in shaping speech characteristics.
Notes: Model includes random intercepts for speaker, with a by-speaker random slope for duration, and for word, with by-word random slopes for pre-pausal status and duration. t-Values >±2 are taken as significant in comparison to baseline.
For plots, values are averaged by speaker × word to reduce distortion from uneven token counts. For most patterns, we visualize raw model predictions in ggplot, but for key interactions, we use estimated marginal means (EMMs) from the emmeans package in R (Lenth, Reference Lenth2025), which provide model-based predicted values that hold other factors constant and, therefore, give a clearer view of each interaction’s independent effect.
This results in 10,927 tokens of spontaneous speech, which form the focus of our main model. We have an additional 552 tokens, which are elicited forms from the word list from 98 of the 109 speakers and are not included in the main statistical analysis but are present in the style plots and the additional style output model in Appendix B.
Results
The final model of spontaneous speech (i.e., excluding word-list reading) is shown in Table 3. The model includes random intercepts for speaker (SD = 69.0) with a by-speaker random slope for duration (SD = 71.6) and random intercepts for word (SD = 53.5) with by-word random slopes for pre-pausal status (SD = 71.9) and duration (SD = 57.6). It demonstrates that happy in Manchester is conditioned by both social factors (social class, ethnicity) and linguistic factors (preceding segment, pre-pausal status, and vowel harmony). As mentioned earlier, four interactions out of a possible 15 emerged as significant: class × pre-pausal; ethnicity × pre-pausal; class × vowel harmony; and pre-pausal × duration, three of which are interactions between social and linguistic factors. The following subsections will discuss the findings in detail.
Age
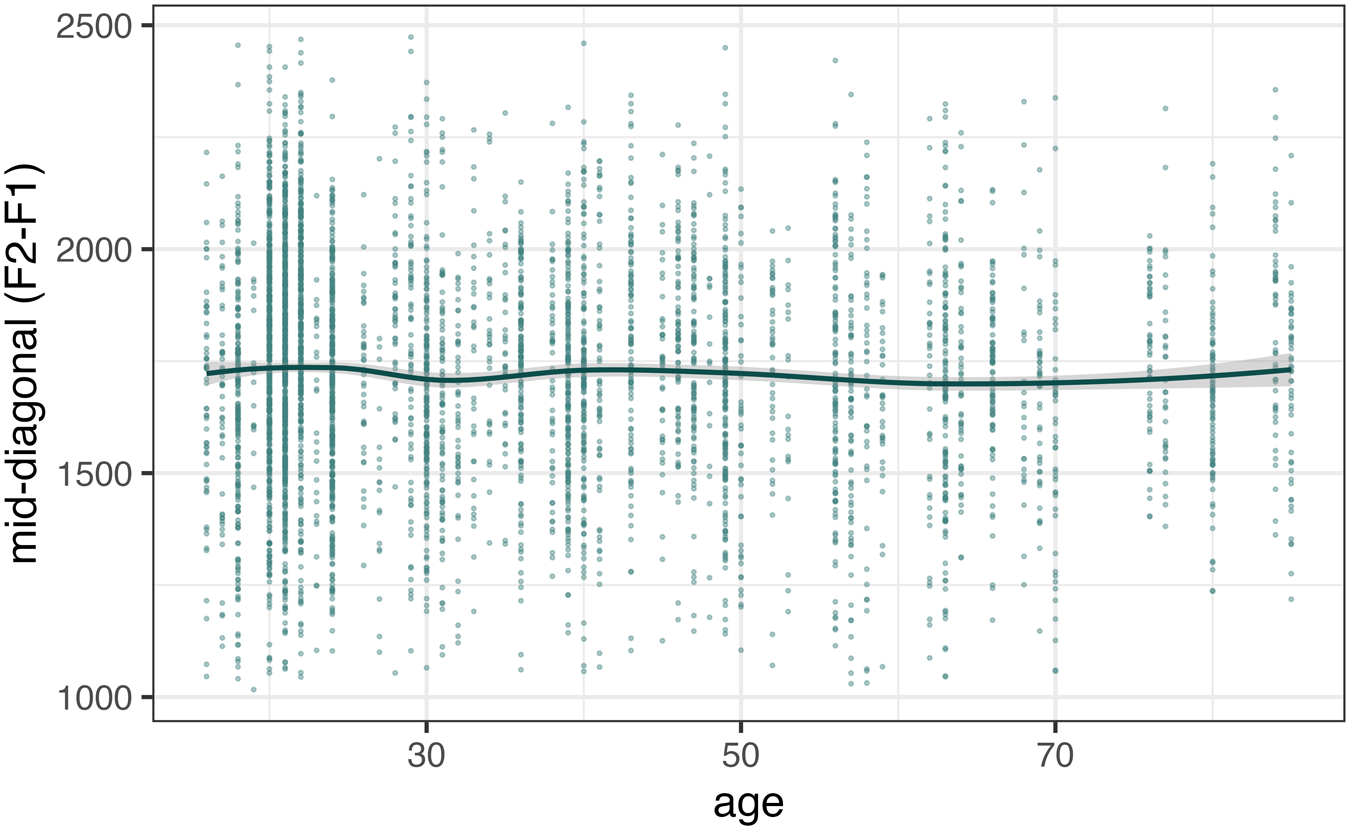
As Table 3 shows, happy is stable in Manchester, with no significant effect of age. While we did not expect to find change in progress, the stability observed in Figure 2 is nevertheless notable given the shift toward tensing reported in British English in recent decades (Beal, Reference Beal, Bermúdez-Otero, Denison, Hogg and McCully2000; Fabricius, Reference Fabricius2002; Watts, Reference Watts2005). In addition, we note that the examples of stable vocalic variables are rather rare in sociolinguistic research. There were no significant interactions between age and any other factors, demonstrating that the vowel quality for our sample of the speech community is currently stable across gender, ethnicity, and social class.
F2−F1 of happy across age.

Figure 2 Long description
A scatter plot with the x-axis labeled 'age' and the y-axis labeled 'mid-diagonal (F2 minus F1)'. The plot displays numerous data points scattered across the graph, with a trend line running through them. The data points are distributed from ages 20 to 80, with mid-diagonal values ranging from 1000 to 2500. The trend line shows a slight decline and then stabilizes as age increases.
Social class and style
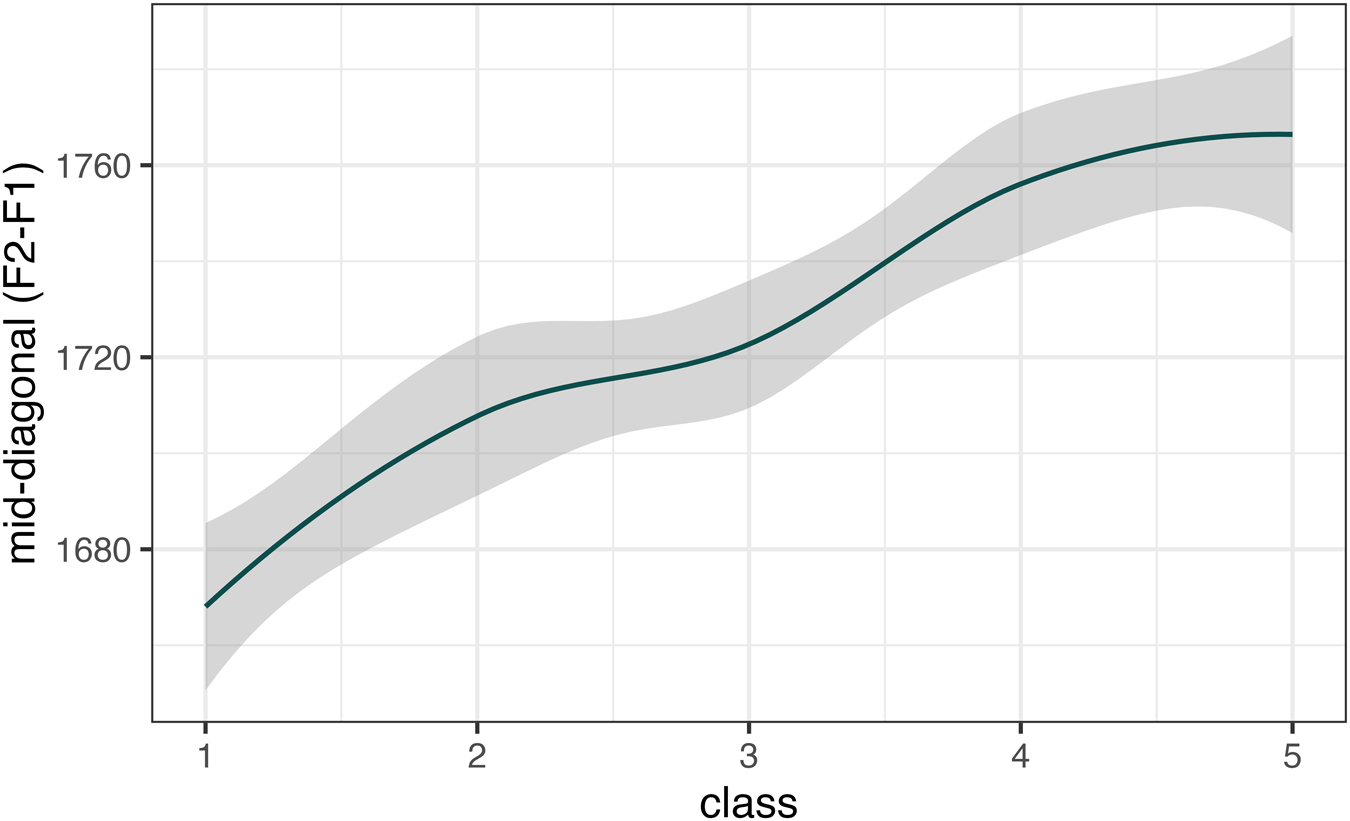
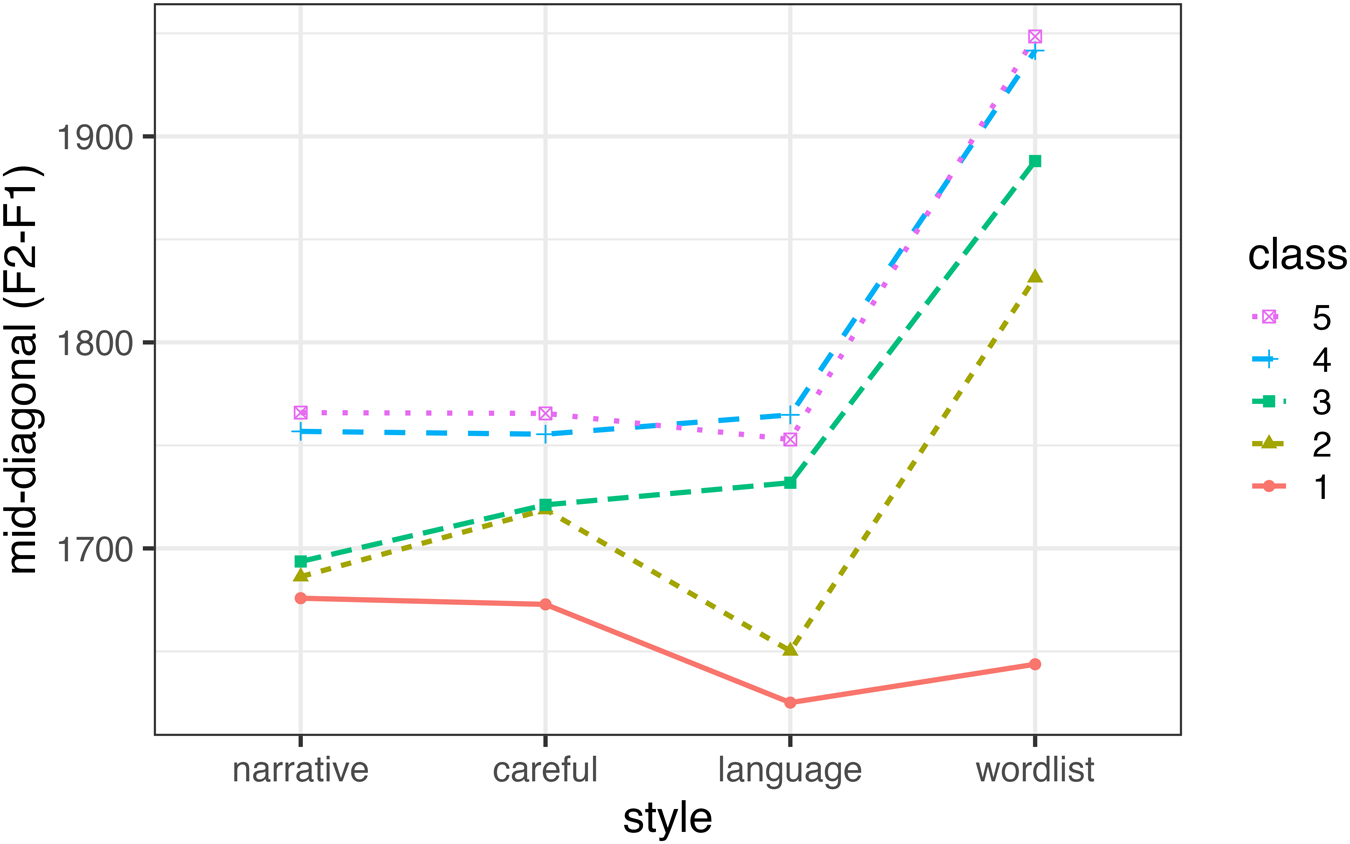
Social class and happy are in a positive near-monotonic relationship: broadly, the higher the social class, the tenser the vowel, and the lower the social class, the laxer the vowel (Fig. 3). This is the pattern we would expect from the existing literature, which associates tenser vowels with higher social classes in English dialects in many areas. For example, comparable class-based differences were also observed by Watts (Reference Watts2005) for Wilmslow, where working- and middle-class speakers showed similar realizations to our findings here. Figure 3 generally confirms this, although, interestingly, the model estimates suggest that the middle-middle class (Class 4) may exhibit more tensing than the upper-middle class. However, when we separate this out by speech style (which is omitted from the spontaneous speech main model in Table 2), as we do in Figure 4, we see a largely monotonic pattern of tenseness, on average, for the spontaneous speech styles. Figure 4 also shows that most social classes see a large jump in tenseness for the word-list style in contrast to the spontaneous speech styles (narrative, careful, language). Although this shift does not reach statistical significance (confirmed by running an additional model of all styles, shown in Appendix B), both as a whole and in individual social classes (which could be due to the relatively low numbers of tokens in the word-list style), it is nevertheless intriguing, as the pattern is consistent for most social classes. One possible interpretation of such style-shifting would be that it is a reflection of the social awareness and evaluation of laxing/tensing in the community, indicating that most speakers in Manchester evaluate the lax variant negatively. If that is the case, however, this would be a somewhat unusual style-shifting pattern in that, at the same time, there is no style-shifting at all between the other, spontaneous speech styles; one might have expected a more linear pattern, with narratives, for instance, showing more laxing than careful speech, as found in the studies of other stable variables from above the level of conscious awareness, such as (ING) and TH-stopping (Labov, Reference Labov2001; Patchell & Berry, Reference Patchell and Berry2024).Footnote 3
F2−F1 of happy by social class (1 = lower working class, 5 = upper middle class).

Figure 3 Long description
A line graph showing the mid-diagonal (F2 minus F1) on the y-axis, ranging from 1680 to 1760, plotted against class on the x-axis, ranging from 1 to 5. The line shows an upward trend, indicating an increase in mid-diagonal values as the class number increases. A shaded area around the line represents variability or confidence intervals.
Mean F2−F1 for happy across style and class (averaged over speaker and word).

Figure 4 Long description
A line graph showing the mid-diagonal (F2 minus F1) values on the y-axis, ranging from 1700 to 1900, across different styles on the x-axis: narrative, careful, language and wordlist. Five classes are represented with different line styles and colors. Class 1 starts at 1700 in narrative and increases slightly in careful, then rises in language and wordlist. Class 2 begins above 1700, dips in careful and rises in language and wordlist. Class 3 starts higher, remains steady in careful and increases in language and wordlist. Class 4 and 5 show similar patterns, starting high and increasing significantly in wordlist. Each class is distinguished by a unique line style and color, with class 5 reaching the highest value in wordlist.
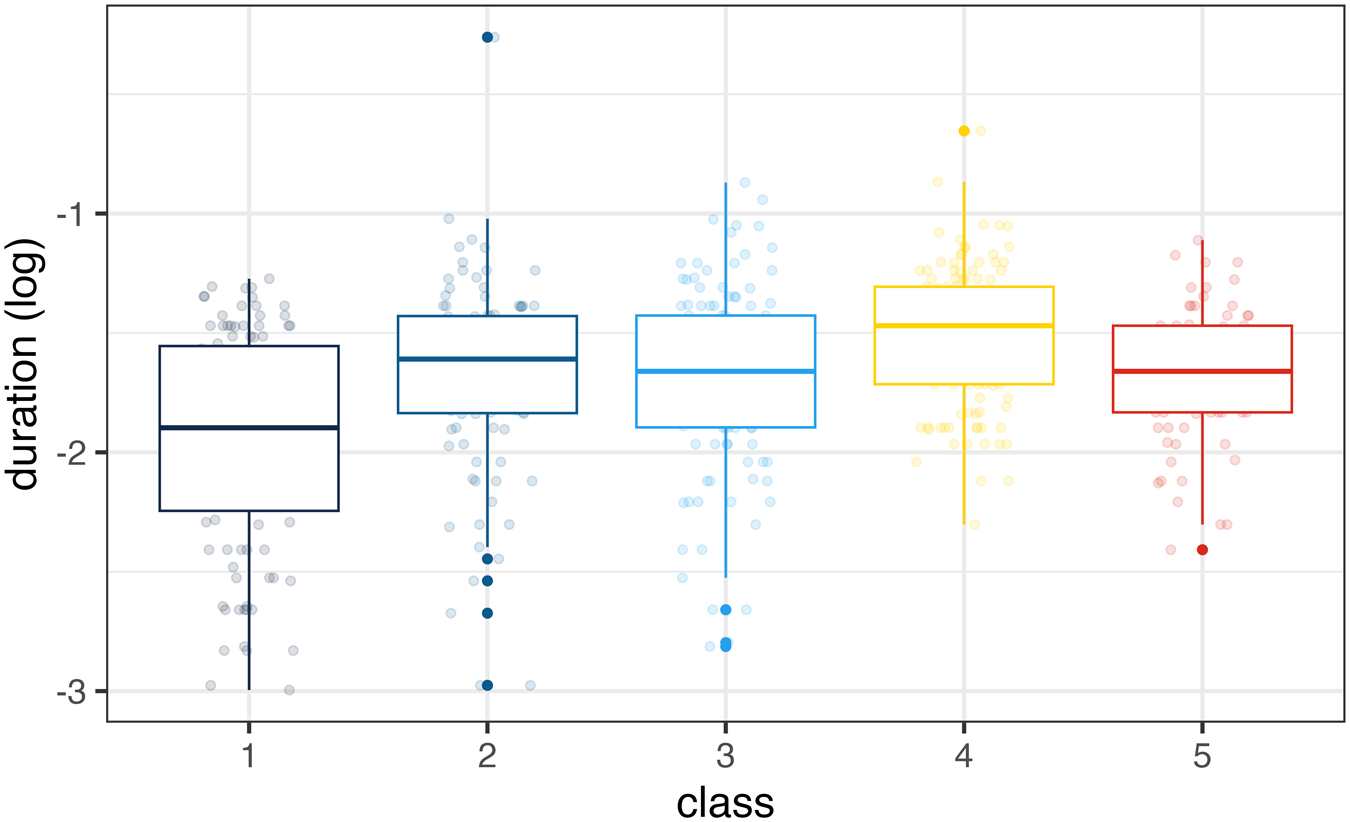
Furthermore, the fact that the only speech style showing a difference is word-list reading, which suggests that the shift shown in Figure 4 is an effect of the word-list task rather than social in nature. Longer vowel duration promotes happy-tensing (Table 2), and the word-list style contains significantly longer vowels (Fig. 9), which together explain the shift toward tensing in word-list reading seen in Figure 4. One might then wonder why the lowest social class doesn’t seem to show a similarly radical rise in tenseness in this style if the effect is not social. While it is quite possible that for the lowest social class, the target is a lax vowel, with no negative evaluation, it is also interesting to note that the lowest working class has significantly shorter vowel durations in word-list reading in comparison with the other social classes, so the apparent style-shifting pattern could be a durational effect. We discuss the effect of vowel duration further on.
Gender
The model in Table 3 shows no significant differences between males’ and females’ happy realization in Manchester. This is potentially surprising as previous studies have found a gender effect in Sheffield (Stoddart et al., Reference Stoddart, Upton, Widdowson, Foulkes and Docherty1999) and Nottingham (Flynn, Reference Flynn2010), and these are the two other cities which have open [ë] as a happy variant. There are no significant interactions of gender with any other variable, although subsetting the data to different ethnic groups does show a gender difference in the Pakistani subset: Women have tenser vowel qualities than men, as discussed in the following section. Each social class considered separately again shows no gender differences reaching significance. Given that the quality of the happy vowel is arguably below the level of conscious awareness in the community, this lack of gender differentiation is not unexpected. The gender differences associated with the well-known stable consonantal variables, such as TH-stopping and (ING), for example, are seen for features above the level of conscious awareness, which may be subject to social evaluation. This does not appear to be the case for happy in Manchester.
Ethnicity
We find a clear effect of ethnicity in the dataset, as Pakistani speakers have tenser variants than Black and White speakers (Table 3 and Fig. 5). Tense happy vowels are associated with Northern British Asian speakers elsewhere, as reported by Kirkham (Reference Kirkham2015) in Sheffield, for example, and are likely due to heritage language influence.
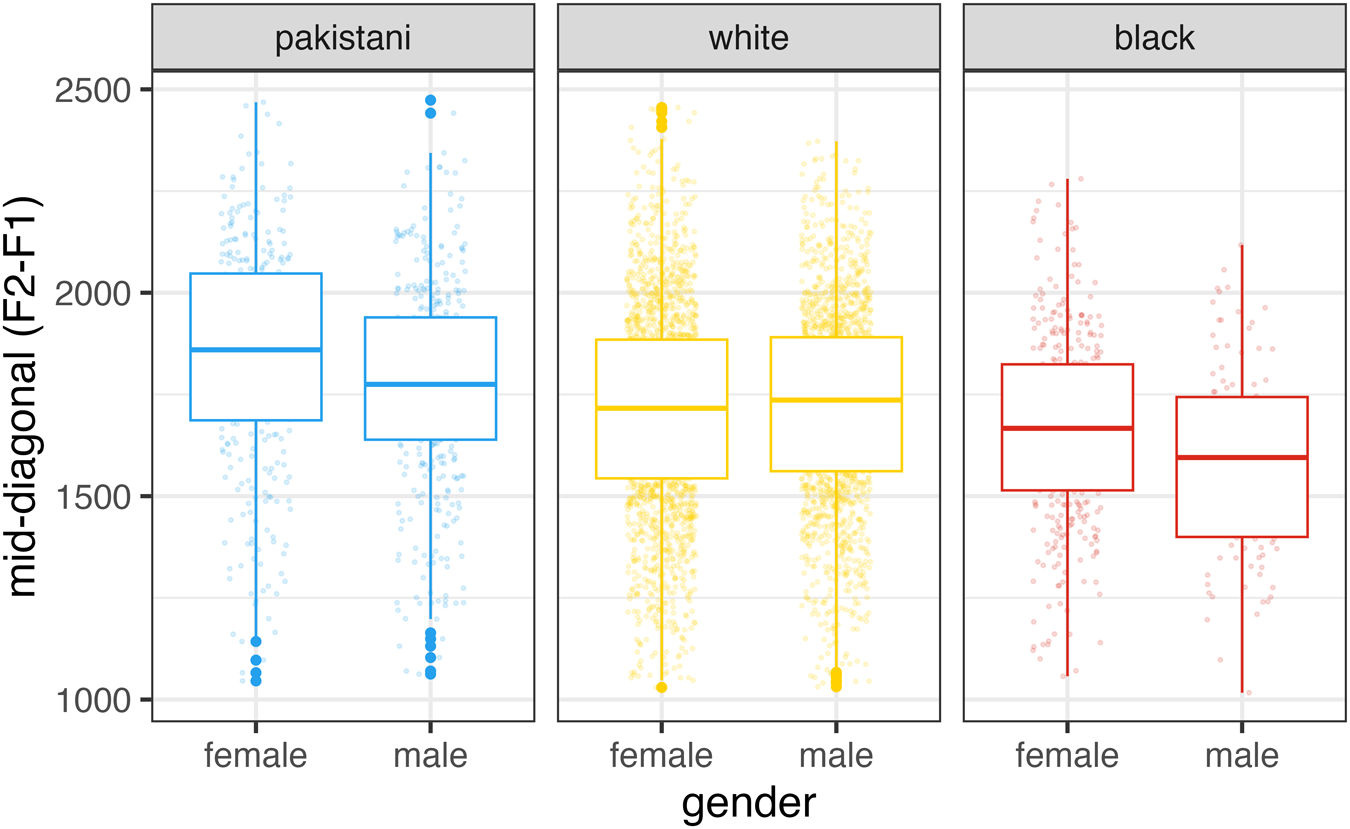
F2−F1 for happy across different ethnic groups and gender, displaying the significant difference between Pakistani females and males, but no overall significant interaction effect.

Figure 5 Long description
Each plot is divided into female and male categories. The x-axis is labeled 'gender' with categories 'female' and 'male'. The y-axis is labeled 'mid-diagonal (F2-F1)' with values ranging from 1000 to 2500. The Pakistani plot shows a noticeable difference between female and male values, while the White and Black plots show less variation between genders. Each plot includes individual data points scattered around the box plots, indicating the distribution of values within each gender and ethnic group.
Although an interaction between ethnicity and gender does not improve the model in Table 3 significantly by likelihood ratio test, we noted earlier that within the Pakistani subset of speakers, women are statistically more tense than men (confirmed by subsetting each ethnic group). This is shown in Figure 5. Also evident from Figure 5 is that Black men seem to have a laxer happy vowel than Black women, but this is not statistically significant in the subset when accounting for all other factors. The fact that these two observations about different ethnic minority groups in Manchester do not reach significance in the larger model could indicate no true difference, but could also be down to the smaller number of speakers we have in these groups (Pakistani Mancunians, 16 speakers, and Black Mancunians, 14 speakers).
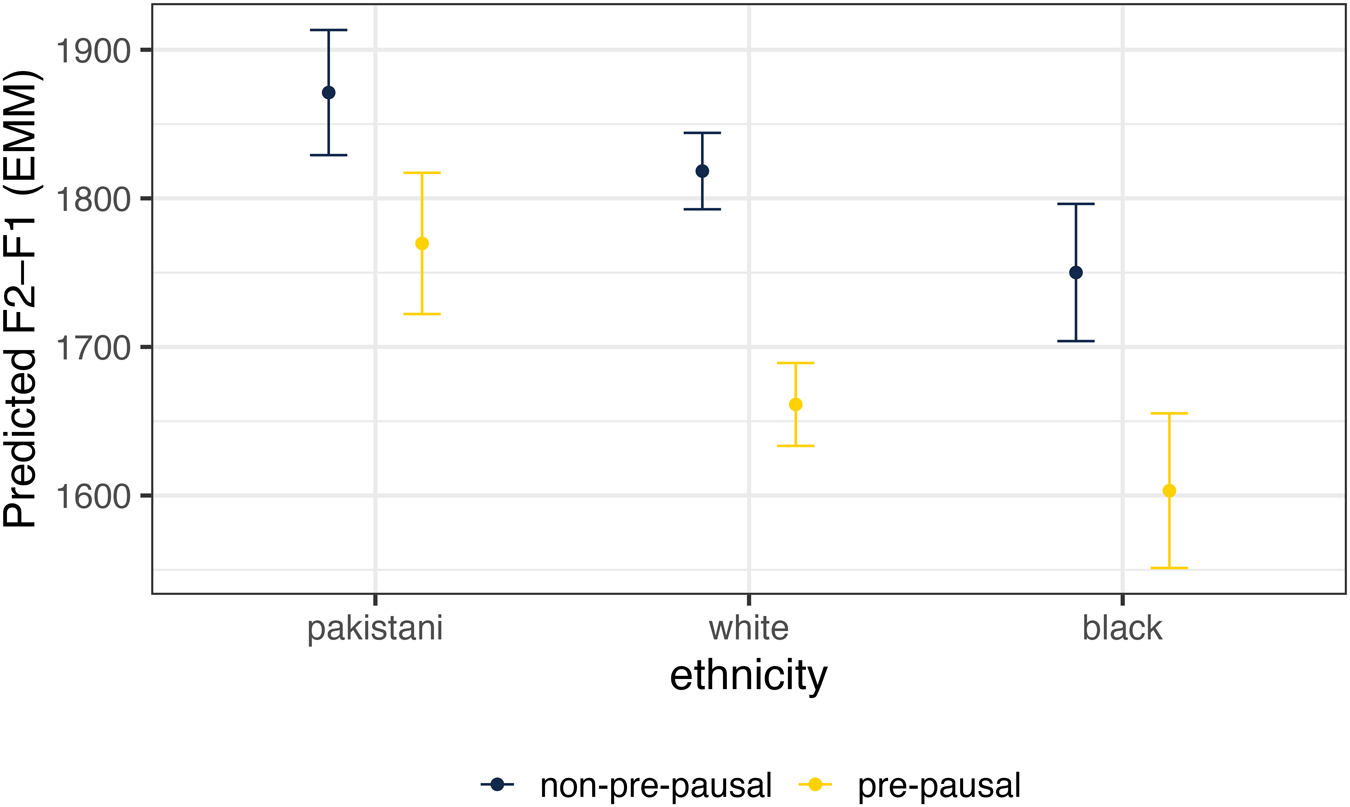
One of the three interaction terms which emerged as significant was between ethnicity and the pre-pausal status of happy. As discussed in the literature review, pre-pausal happy is said to be significantly laxer than happy elsewhere. Although this effect holds for all speakers, for the Pakistani speakers, the difference is statistically smaller (also confirmed by running separate models on each ethnic group), that is, their pre-pausal happy is still very tense in comparison to non-pre-pausal (B = −73 Hz, t = −4.6) compared to Black speakers (B = −119 Hz, t = 6.5) and White speakers (B = −122 Hz, t = 18.9), who have bigger differences between the two contexts. It is worth stressing, however, that while Pakistani speakers are generally tensers (rather than laxers of the vowel), the ordering of the constraint among Pakistani speakers is in the same direction as in the rest of the speech community, with laxer vowels in pre-pausal position.
This significant interaction is visualized in Figure 6, which shows EMMs from the model rather than raw averages. As mentioned in the “Methodology” section, EMMs represent model-adjusted predictions that account for other factors in the model, allowing us to visualize the interaction between pre-pausal position and class without the influence of imbalanced data or additional predictors. This shows that the rule is the same for Pakistani speakers, who are also tensers: The distinction between pre-pausal and non-pre-pausal position is much smaller in this ethnic group. All ethnic groups show the same directional effect, but the magnitude is considerably smaller for Pakistani speakers, which drives the overall interaction.
Estimated marginal means for different ethnic groups across pre-pausal and non-pre-pausal positions.

Figure 6 Long description
The graph shows predicted F2 minus F1 values in estimated marginal means for three ethnic groups: Pakistani, white and black. The x-axis is labeled 'ethnicity' and the y-axis is labeled 'Predicted F2 minus F1 (estimated marginal means)'. Two sets of data points are plotted for each ethnicity, representing non-pre-pausal and pre-pausal positions. Pakistani speakers show higher values in both positions, with non-pre-pausal values around 1900 and pre-pausal values slightly lower. White speakers have non-pre-pausal values around 1800 and pre-pausal values lower. Black speakers show the lowest values, with non-pre-pausal around 1700 and pre-pausal values even lower. Error bars indicate variability within each group.
Linguistic factors
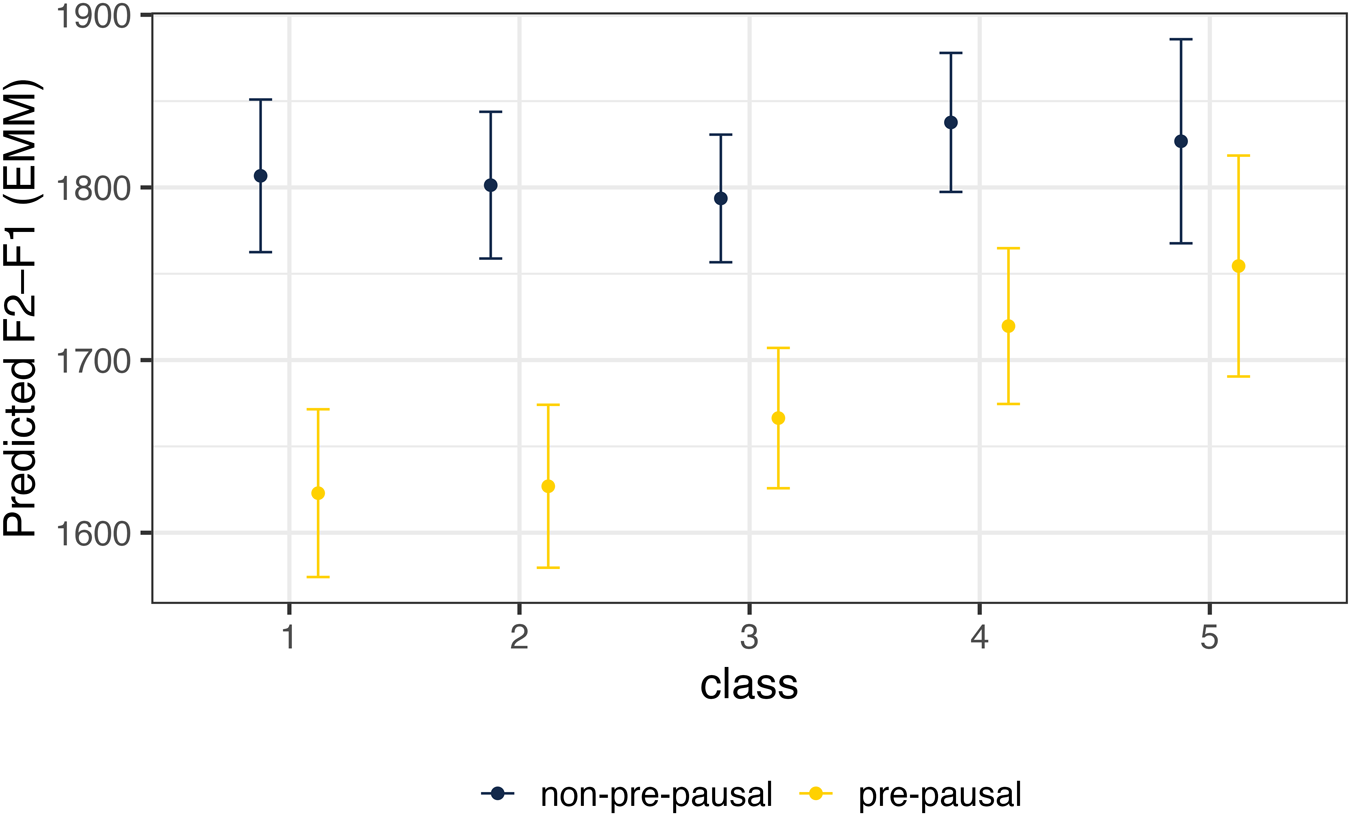
We now turn to the linguistic factors, the main one being the contextual position of happy: The happy laxing effect is much stronger in pre-pausal position, that is, I am happy is much laxer than happy in Manchester. This effect interacts significantly with three other factors: ethnicity, duration (pre-pausal tokens are laxer but longer), and class (the highest classes show a reduced difference compared to the lower three classes). Figure 7 visualizes the significant class interaction with an emmeans plot, showing that the monotonic social class pattern in happy-laxing is most clearly seen in pre-pausal tokensFootnote 4. At the same time, a separate model for non-pre-pausal tokens still confirms the same stratification, albeit less strongly. Importantly, the direction of the pre-pausal effect (more laxing in pre-pausal position) is the same for each social class.
Estimated marginal means for the significant class × pre-pausal interaction. All social classes show the same directional effect, but the magnitude is smaller in the highest social groups that have very little vowel laxing, which drives the overall interaction.

Figure 7 Long description
The graph shows predicted F2 minus F1 values labeled as EMM on the y-axis, ranging from 1600 to 1900. The x-axis is labeled 'class' and includes five classes numbered from 1 to 5. Two sets of data points are plotted: non-pre-pausal, represented by blue markers and pre-pausal, represented by yellow markers. Each class has two data points, one for each condition, with error bars indicating variability. The non-pre-pausal values are consistently higher across all classes compared to pre-pausal values.
Preceding consonant
Table 3 shows that there is a significant effect of preceding consonant: Sounds that have a heightening effect (due to the tongue being raised), such as velars, as in hockey, and palatals, as in pushy, have a tenser vowel, followed by apical sounds, both oral (e.g., daddy) and nasal (e.g., brainy). Preceding /r/, /l/, and /m/, as in Harry, chilly, and mummy, respectively, have the laxest vowels, with everything else falling somewhere in between.
Duration
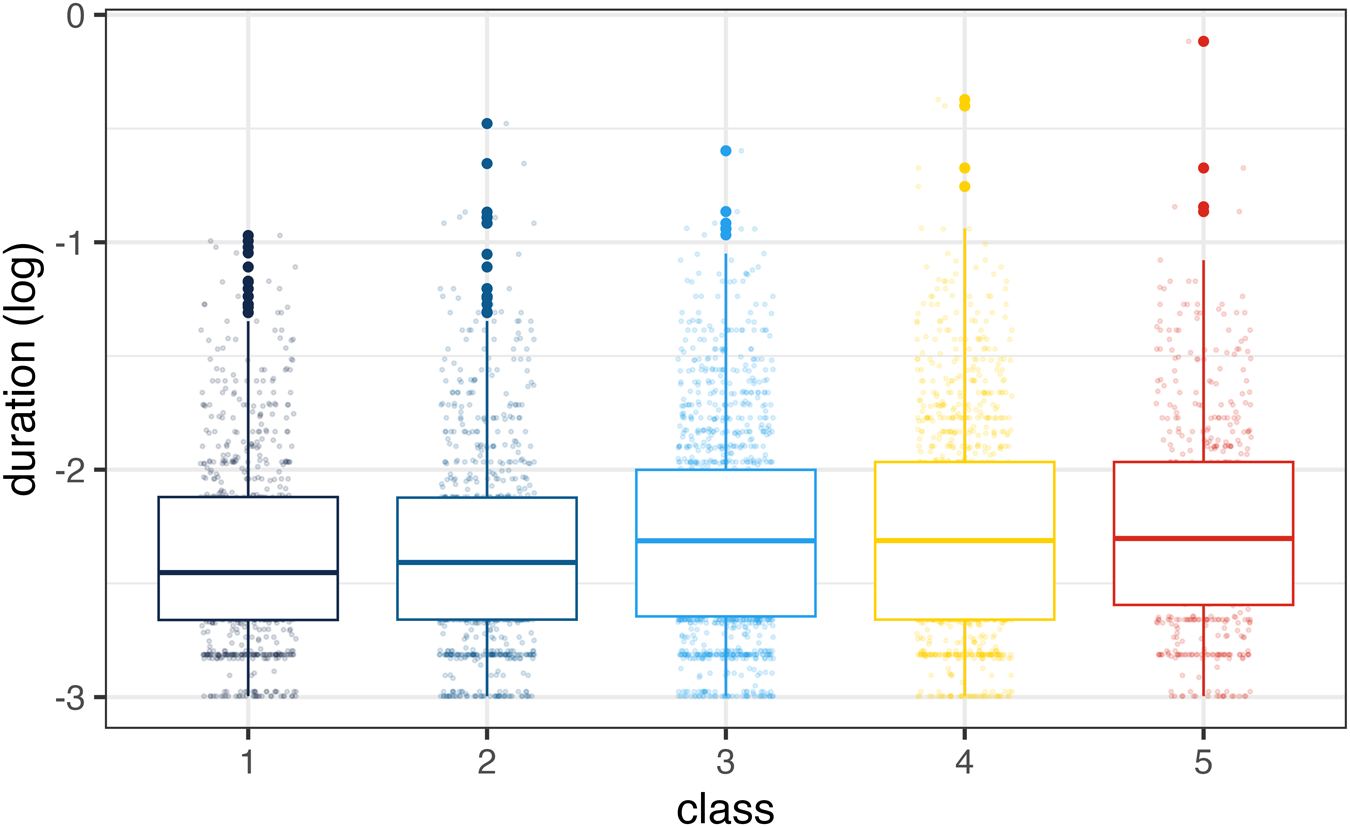
The model in Table 2 shows that vowel duration plays a significant role in happy realization, with longer variants being tenser. This is expected, as tense vowels in English are generally longer than lax vowels. Interestingly, higher classes have longer durations too (Fig. 8). This in itself is not unexpected, as the higher social classes also have tenser vowels (Table 2), and the correlation between longer durations and tense vowels in English is well established. There is an interaction between duration and pre-pausal status. This appears to be driven by distributional differences rather than a qualitative change in the duration-quality relationship. Pre-pausal tokens are overall laxer and more variable, which means a steeper increase in F2−F1 versus duration is observed within the shorter tokens.
Happy log-transformed duration across social classes (lower negative numbers mean shorter vowels).

Figure 8 Long description
A box plot illustrating log-transformed duration across five social classes labeled 1 to 5 on the x-axis. The y-axis represents duration in log scale, ranging from negative 3 to 1. Each class has a box plot with individual data points scattered around it, indicating variability. The boxes show the median, quartiles and range of durations for each class, with some outliers visible above and below the boxes.
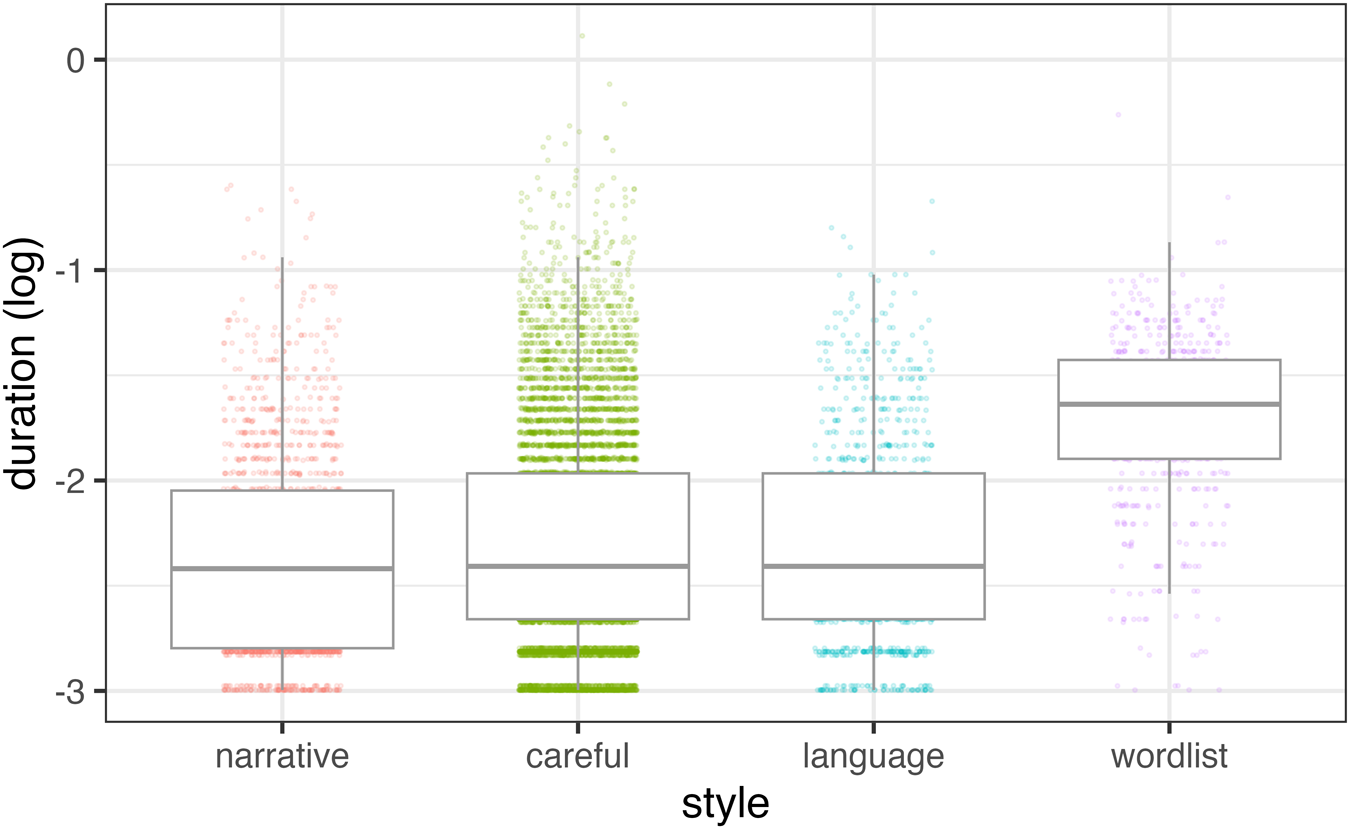
We were also interested in the relationship between duration and style in our dataset. Figure 9 shows that the vowels in more formal styles are, on average, longer, which is unsurprising, as more careful pronunciations are likely to be longer, particularly in emphatic pronunciations, such as word-list reading; the overall effect of duration reported in Table 3 is based on spontaneous speech, which is composed of three styles: narratives, careful, and language. We also noted that the style-shifting effect in Figure 4 is not significant in the additional statistical model including style, and, in fact, the addition of style as a factor does not improve the model (Appendix B), as confirmed by the likelihood ratio test. However, if we remove duration from the model, style becomes significant. This suggests that it is the duration that is doing all the work of the apparent style-shifting seen in Figure 4. Similarly, the somewhat different pattern by the Lower Working Class (Class 1) in word-list reading (Fig. 4) is likely due to their vowels being considerably shorter in this particular style in comparison with other social classes (Fig. 10) rather than to their different evaluation of lax happy. The lack of a significant effect of style in the models, accompanied by the preeminence of duration, would tally with our perception that happy in Manchester is not a salient feature to community insiders, although it is often commented on by outsiders and may be entering social commentary in the community itself just now.
Happy log-transformed duration across styles (lower negative numbers mean shorter vowels).

Figure 9 Long description
A box plot showing log-transformed duration on the y-axis and style on the x-axis. The styles are narrative, careful, language, and wordlist. Each style has a corresponding box plot with data points scattered vertically. The narrative style shows a lower median duration compared to the wordlist style, which has the highest median duration. The careful and language styles have similar median durations, positioned between narrative and wordlist.
Word-list style happy vowel durations by social class.

Figure 10 Long description
A box plot illustrating the distribution of duration (log) across five classes labeled 1 to 5 on the x-axis. The y-axis represents duration (log) values ranging from negative 3 to 2. Each class has a box plot with individual data points scattered around it, indicating variability within each class. The boxes show the median, upper and lower quartiles, while the whiskers extend to the minimum and maximum values within 1.5 times the interquartile range. Outliers are visible as individual points outside the whiskers for each class.
Vowel harmony (preceding vowel quality)
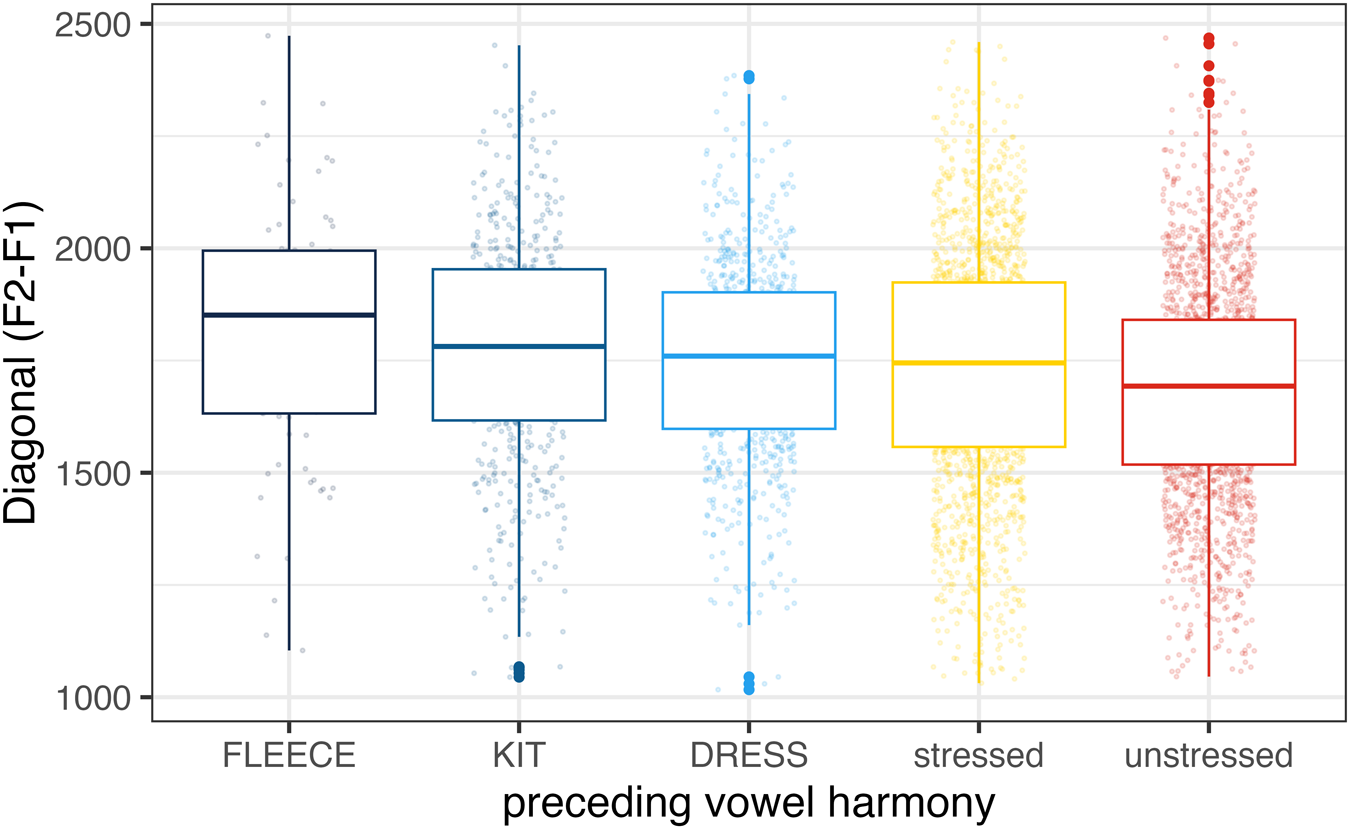
Previous studies (e.g., Kirkham, Reference Kirkham2015; Watts, Reference Watts2005) have explored the effect of vowel harmony on happy laxness or tenseness, and this is a significant addition to our model as well.Footnote 5 As indicated by the values of the estimates in Table 3 and the average values in Figure 11, the trend is in the direction of tenser happy with tenser preceding vowels. In the following words, for example, happy-tensing decreases from the left to the right: Healey > hilly > helly > holly. As expected, preceding unstressed syllables result in a laxer vowel. This is what Watts (Reference Watts2005:237) found for nearby Wilmslow, following previous observations by Local (Reference Local1986) and Windsor-Lewis (Reference Windsor-Lewis and Ramsaran1990), as well as Kirkham (Reference Kirkham2015) in Sheffield, who interpreted it as a gradient coarticulatory effect.
F2−F1 of happy, and preceding vowel harmony and stress.

Figure 11 Long description
A box plot displays the diagonal F2 minus F1 values for different preceding vowel harmonies. The x-axis is labeled 'preceding vowel harmony' with categories: FLEECE, KIT, DRESS, stressed and unstressed. The y-axis is labeled 'Diagonal (F2 minus F1)' with values ranging from 1000 to 2500. Each category has a box plot with individual data points scattered around it, showing the distribution of values for each vowel harmony type.
We also considered rhythm as a potential factor, as in previous studies (Kirkham, Reference Kirkham2015; Local, Reference Local1986), but it was highly correlated with vowel harmony. In our dataset, some vowels occurred almost exclusively in one rhythmic category; for example, fleece vowels are always heavy, while kit and dress are typically light syllables unless before a consonant. The two predictors were, therefore, not statistically independent. Because harmony provided a better model fit by AIC, we retained it in the final analysis as opposed to rhythm. When considering rhythm in isolation, tokens with open preceding syllables showed slightly greater tenseness than those with closed syllables (e.g., open galley versus closed Gatley). However, we did not replicate the broader pattern reported elsewhere of longer preceding vowels being systematically tenser. As this analysis examines rhythm independently rather than within the full model, we treat these effects with caution, interpreting them as residual rather than primary.
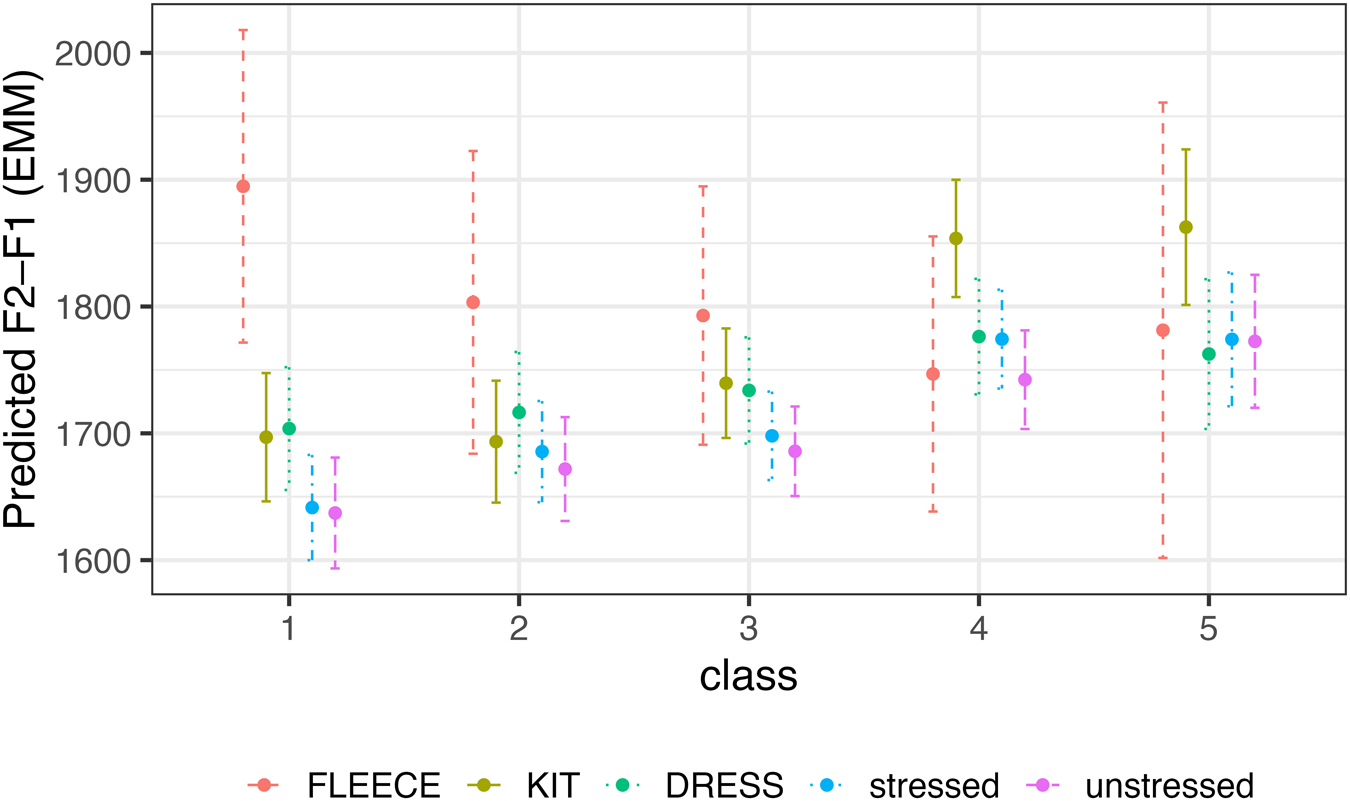
One of the few interactions that reached significance was the interaction between vowel harmony and social class. This interaction is visualized with EMMs in Figure 12. The ordering of this constraint, from tensest to laxest preceding vowel, is seen most clearly for social classes 1-3. The highest social classes show a slightly different configuration from the other groups in that a preceding kit appears to promote tensing more than a preceding fleece. This results in a significant interaction between vowel harmony and social class. However, for the two highest social classes, the difference between fleece and kit is in fact not significant, suggesting that the order of these effects is not reversed but is undetermined. This may be partly due to the small number of tokens of fleece in the dataset (n = 95, see Table 3), and it may interact with other factors, such as rhythm or syllable stress, in ways that are difficult to fully disentangle, which may be the reason for the wide error bars in the two highest classes. The apparent class × harmony interaction reflects reduced contrast in higher classes rather than reversal of constraint ordering, likely exacerbated by low numbers of fleece tokens.
F2−F1 of happy and vowel harmony for each social class.

Figure 12 Long description
The graph shows predicted F2 minus F1 values (estimated marginal means) on the y-axis ranging from 1600 to 2000, plotted against five social classes on the x-axis labeled 1 to 5. Data points are categorized by vowel types: FLEECE, KIT, DRESS, stressed and unstressed, each represented by different markers. Error bars are visible for each data point, indicating variability. The distribution of values varies across classes, with distinct patterns for each vowel type and stress condition.
Discussion and conclusions
The patterns described here provide a coherent picture of the status of the happy vowel in Manchester and allow us to address the research questions posed in the introduction concerning change in progress, the role of social factors, evidence of social evaluation through style-shifting, and the extent to which linguistic constraints operate independently of social ones.
The lack of a significant age effect in the sample, with no interactions between age and other social categories, suggests that the happy vowel in Manchester is a case of a rarely reported stable vocalic variable. Interestingly, the vast majority of attested stable sociolinguistic variables, that is, ones showing social group differences (with the exception of age), are either grammatical ones, such as negative concord or third-person singular -s absence in English, or consonantal ones, including some classic ones such as (ING) and H-dropping in England (Baranowski & Turton, Reference Baranowski, Turton and Hickey2015; Trudgill, Reference Trudgill1974) and TH-stopping in American English (Labov, Reference Labov2001; Patchell & Berry, Reference Patchell and Berry2024).Footnote 6 Vocalic variables, which often show robust effects of social class and gender, for instance, are usually reported to be cases of changes in progress, for example, most of the vowel shifts studied by Labov in New York City (Labov, Reference Labov2006) and Philadelphia (Labov, Reference Labov2001; Labov et al., Reference Labov, Rosenfelder and Fruehwald2013), or the fronting of the back vowels in Charleston, South Carolina (Baranowski, Reference Baranowski2008), and Manchester, England (Baranowski, Reference Baranowski2017). The sizeable and systematic social class differences reported in those cases are the result of particular social groups leading the shifts in those vowels, some of which may be nearly, though not quite, completed.
That is not to say that there are no known cases of stable vocalic variables. Trudgill’s (Reference Trudgill1974:96-97) early study of Norwich described the vowels in words such as name, nail, and plate on the one hand, and cart and bath on the other, as showing social class stratification and no indication of a change in progress. More recently, the fronting of goose before /l/, as in school and pool, while displaying a monotonic pattern of social class stratification, has been reported to be stable in Manchester (Baranowski, Reference Baranowski2017). Similarly, for those Manchester speakers who have no foot-strut distinction, which is the vast majority of Mancunians, there is a robust effect of social class, with higher social classes having lower vowels in strut-class words (Turton & Baranowski, Reference Turton and Baranowski2021a); there is no change in apparent time, so the phonetic realization of strut-class words, and consequently the distance between the foot-strut vowels in Manchester, could be described as a case of stable sociolinguistic variation. Another example might arguably be the tensing and raising of short-a in Philadelphia (and also in New York City), which, being a nearly completed change during Labov’s explorations in the 1970s, showed a female advantage (Labov, Reference Labov2001) and ethnic group differences (Henderson, Reference Henderson1996; Labov, Reference Labov2014), for instance. That said, there is recent evidence suggesting a retreat from the tensing by women in Philadelphia (Labov et al., Reference Labov, Rosenfelder and Fruehwald2013:53) and a change in progress toward a nasal system in both Philadelphia (Labov et al., Reference Labov, Fisher, Duna, Henderson and Sneller2016; Sneller, Reference Sneller2018) and NYC (Becker & Wong, Reference Becker and Wong2009; Haddican et al., Reference Haddican, Newman, Cutler and Tortora2021), so it is not clear whether they can truly be described as stable in those communities.
The happy vowel in Manchester is, on the other hand, a clear case of a stable vocalic variable, showing a monotonic pattern of social class stratification and stability in apparent time, reminiscent of the classic consonantal stable variables, such as (ING) and TH- and DH-stopping. One way in which it differs from those variables slightly is in the social evaluation of its variants in that while those consonantal variables were above the level of conscious awareness, with speakers shifting away from the stigmatized variants in more formal styles (Labov, Reference Labov2006:154-157, Reference Labov2001:95-101), there is little evidence to suggest that lax happy is stigmatized within Manchester. Style does not come out as significant in our models, and the shift toward tensing in word-list reading seen in Figure 4 (if it were to be significant with larger numbers of tokens) could be argued to be a durational effect. This lack of a stylistic effect in our data is consistent with anecdotal evidence suggesting that Mancunians are not usually aware of the lax quality of their happy vowel, though this feature is very salient to outsiders. For the second author of this paper, for example, an outsider to the community, lax happy was the most striking feature of the accent noticed immediately on arrival. On the other hand, the first author, a Mancunian, never noticed it until she became a trained linguist and witnessed comments from outsiders. It is possible, therefore, that contact with outsiders may contribute to a heightening of the awareness of lax happy among the native population in the future.Footnote 7
The monotonic relationship between socioeconomic level and happy-tensing in Manchester—more tensing with higher social classes—is consistent with the tense variant being a Southern form, that is, one commonly used in the south of England. It is not entirely surprising that the higher social classes should have higher levels of the tense variant, as they tend to have more contact and more exposure to Southern speech patterns, either through family connections, education, or travel. A similar correlation between social class and the use of Southern features has been reported for the foot-strut contrast (and the quality of the strut vowel) (Turton & Baranowski, Reference Turton and Baranowski2021a) and in the fronting of the goat vowel in Manchester (Baranowski, Reference Baranowski2017), with the higher social classes displaying higher rates of the Southern variants. Although the lax variant of happy competes with tensing from the south of England, associated with higher socioeconomic classes, it does not seem to be going away. It could represent, as Labov (Reference Labov2001:105) suggested for nonstandard working-class forms, “an alternate form of symbolic capital that carries full value in working class social networks, and serves the needs of members of that society.”
There is a clear effect of ethnicity in that Pakistani speakers have tenser realizations of the happy vowel in comparison with Black Caribbean and White speakers. This is likely a heritage language effect and is in line with previous research of South Asian speakers in the north of England, such as Kirkham (Reference Kirkham2015). At the same time, Black Caribbean speakers have laxer vowels than White Mancunians, though the number of Black speakers in the sample is rather small, so it remains to be seen if future research will confirm this finding with a large sample and better socioeconomic coverage in the Black Caribbean community.
The role of the internal constraints is in line with previous research into happy-tensing, confirming significant effects of the tenseness and amount of stress in the preceding vowel, and of the duration of the happy vowel itself: More tenseness and stress in the preceding vowel promote tenseness in the happy vowel, which is also tenser with increased duration. One question that these results raise is whether they can provide support for the hypothesis that linguistic constraints are generally independent of social ones (Labov, Reference Labov1994:3, Reference Labov2001:103; Weiner & Labov, Reference Weiner and Labov1983). The hypothesis has found considerable support, particularly for stable consonantal variables, such as TD-deletion (Guy, Reference Guy and Labov1980) and (ING), where the grammatical constraints show the same ordering in different social groups (Labov, Reference Labov2001:103). Similarly, the effect of the position in the word on rhoticity (fourth versus floor) in Labov’s department store study was found to be consistent across the three department stores (Labov, Reference Labov2006:48). That said, whether the generalization holds at the level of individuals continues to be a matter of debate (Forrest, Reference Forrest2015; Guy, Reference Guy and Labov1980; Lim & Guy, Reference Lim and Guy2005; Sankoff & Labov, Reference Sankoff and Labov1979).
However, the independence hypothesis, even at the level of groups rather than individuals, is not without apparent counterexamples. One well-known case is the difference in the role of following vowel versus pause in TD-deletion, which is different between Philadelphia and New York City (Guy, Reference Guy and Labov1980). However, those are two different speech communities, so it is not surprising that the linguistic constraints might work differently there; arguably, the independence hypothesis should be assessed within the same speech community. Another counterexample is the different pattern of TD-deletion in Philadelphia for children, in comparison with the parents, for the semiweak category of verbs such as kept and left (Guy, Reference Guy and Labov1980; Labov, Reference Labov1989), though this is developmental: Children will reanalyze this category as they age and will eventually match the adult grammarFootnote 8.
There has been less evidence for stable vocalic variables, so the happy vowel in Manchester provides an opportunity to test the independence of the internal constraints from the social ones further. If they are independent, then different social groups, such as different social classes, would be expected to show the same ranking of the linguistic constraints. This is indeed what we find: Of the 15 possible interactions between the linguistic and social factors in the dataset, there are only 3 which are significant and relevant to the independence hypothesis, and we argue that none constitute actual exceptions. The two interactions involving pre-pausal position—social class and ethnicity—reflect differences in degree rather than differences in constraint ordering. Crucially, even though there are differences in how these different social groups implement the positional effect, it is in the same direction: Non-pre-pausal is always tenser, and significantly so. Therefore, the presence of an interaction does not per se indicate an argument against the relative independence of the internal constraints from the social constraints.
The remaining interaction, between class and vowel harmony, looks like a counterexample at first glance. Although tenser preceding vowels generally result in tenser happy realizations (see Table 3 and Fig. 11), Figure 12 suggests that while fleece is typically the tensest environment overall, for Classes 4 and 5, the pattern changes, with kit producing higher values. However, it should be noted that for these two social classes, the other preceding vowels follow the community pattern, and the difference between preceding fleece and kit is not statistically significant. This indicates that the order of the constraints is not reversed but rather is undetermined, likely due to the small number of tokens of fleece in the dataset and the generally low degree of laxing among the highest social classes. Overall, the results suggest quite strongly that at least at the level of social groups, the linguistic constraints on happy-tensing in Manchester are independent from social ones, such as social class. Future research will address the question of whether the same generalization holds for individual speakers within the speech community.
The relative stability of linguistic constraints across social factors in the Manchester happy vowel is consistent with models of change that promote the transmission of shared community grammars (e.g., Bermúdez-Otero, Reference Bermúdez-Otero2020; Labov, Reference Labov1994). Within these frameworks, social patterning in rates of use arises from the way learners acquire and update community patterns over time in a process of incrementation resulting from the application of an age vector in a way that is largely independent of attitudinal or identity-based factors (see also Baranowski, Reference Baranowski2017). In addition, the independence of linguistic and social factors places a limit on the range of resources available in stylistic practice, that is, in bricolage (Eckert, Reference Eckert2003). That is, particular variables may be employed for stylistic purposes in the form of varying rates of a variant, but the underlying constraints and their ordering do not seem to be subject to “‘tinkering’ in which people recombine things that are already at hand to create something new” (Eckert, Reference Eckert2019:753), in the same way that underlying linguistic structure, such as phonemic distinctions, as opposed to surface phonetic features, for example, does not usually carry social meaning and is not subject to social evaluation (Eckert & Labov, Reference Eckert and Labov2017).
Overall, the Manchester happy vowel provides a rare case study of a stable vocalic variable in sociolinguistics, whose social patterning is clear whilst remaining independent from linguistic constraints. The combination of clear social differentiation, stability in apparent time, minimal stylistic shifting, and consistent constraint ordering across groups demonstrates that by examining the happy vowel more closely, we can gain valuable insight into both the structure of the sociolinguistic system and the organization of stable vocalic variation more generally.
Acknowledgements
We would like to thank Ricardo Bermúdez-Otero for many insightful comments and suggestions, Jen Nycz for pointing out the rarity of stable vocalic variables, Joe Fruehwald for his help with new-fave and the audience at the 7th Northern Englishes Workshop in Edinburgh for their helpful comments and questions. We are also grateful to two anonymous LVC reviewers, whose comments and suggestions challenged and inspired us to produce what we hope is a much better paper in the end.
Financial support.
This research was funded by the UK Economic and Social Research Council (ESRC, grant ES/I009426/1, M.B.: PI).
Appendix A
Model summary with interaction terms

Appendix B
Model including elicited tokens and style


 Open access

