


Introduction
Understanding heterogeneity in trajectories of ageing is critical to design, plan and deliver appropriate care, health and social support services (Temple et al., Reference Temple, Wilson, Taylor, Kelaher and Eades2020, Reference Temple, Wilson, Brijnath, Utomo and McDonald2022). In Australia, through the Aged Care Act and Aged Care Diversity Framework, there is recognition of a diversity in ageing pathways (Department of Health, 2017), with some people experiencing deleterious wellbeing in later life, due to a number of factors including inequalities accumulated over the lifecourse. Yet, data and methodological limitations can and oftentimes do inhibit an accurate evidence base on the ageing experience of minority demographic populations. This is particularly the case for older people who identify as LGBTQI (lesbian, gay, bisexual, transgender, queer and/or intersex).
Indeed, researchers, policy makers and community advocates have called for an amelioration of data collections about LGBTQI people (Department of Health, 2017; Australian Association of Gerontology (AAG), 2019; Wilson et al., Reference Wilson, Temple and Lyons2021; Department of Families, Fairness and Housing, 2022). Despite deficiencies in population-level data collections, over the past decade there has been a growing gerontological evidence base of the unique ageing experience of LGBTQI people. Within Ageing & Society, studies focusing upon LGBTQI ageing have investigated deficiencies and best practices in aged care (Willis et al., Reference Willis, Maegusuku-Hewett, Raithby and Miles2016; Leyerzapf et al., Reference Leyerzapf, Visse, De Beer and Abma2018; Hafford-Letchfield et al., Reference Hafford-Letchfield, Pezzella, Connell, Urek, Jurček, Higgins, Keogh, Van de Vaart, Rabelink, Robotham, Bus, Buitenkamp and Lewis-Brooke2023), use of health and social care services (Kneale et al., Reference Kneale, Henley, Thomas and French2021; Benbow et al., Reference Benbow, Eost-Telling and Kingston2022), social capital and social support (Cronin and King, Reference Cronin and King2014; Hughes, Reference Hughes2016; Hawthorne et al., Reference Hawthorne, Camic and Rimes2020), inequalities, attitudes and discrimination (Simpson et al., Reference Simpson, Almack and Walthery2018; Bécares, Reference Bécares2021; Lyons et al., Reference Lyons, Alba, Waling, Minichiello, Hughes, Barrett, Fredriksen-Goldsen, Edmonds and Blanchard2021), as well as exploring issues of ageing with an LGBTQI identity (Lyons et al., Reference Lyons, Croy, Barrett and Whyte2015; Bower et al., Reference Bower, Lewis, Bermudez and Singh2021; Willis et al., Reference Willis, Raithby, Dobbs, Evans and Bishop2021), including those with specific health conditions such as dementia or HIV (Price, Reference Price2012; Wallach and Brotman, Reference Wallach and Brotman2018). These research priorities mirror themes in LGBTQI ageing more generally (Fredriksen-Goldsen and Muraco, Reference Fredriksen-Goldsen and Muraco2010; Hawthorne et al., Reference Hawthorne, Camic and Rimes2020; Kneale et al., Reference Kneale, Henley, Thomas and French2021). A recent Australian scoping review underscored current themes, including ageing with an LGBTQI identity, mental and physical health, access to health care and care in support and community settings, social and community support, relationships and intimacy, and exposure to discrimination (AAG, 2019).
Although the evidence base on aspects of individual ageing of LGBTQI Australians is growing, there is a dearth of evidence on the macro aspects of ageing: the level, speed and growth of population ageing within the LGBTQI population itself. Specifically, there is very limited understanding of (a) the size and extent of ageing of this population, and (b) population futures of the older LGBTQI population in Australia more generally. The unique contribution of this study is to address this lacuna by harnessing recent advances in demographic modelling alongside new data to understand plausible estimates and futures of the ageing of the LGBQ population in Australia. As we note below, our analysis is limited to the aggregate LGBQ population due to data limitations. The concepts and methodology we outline are transferable to other countries with available data measuring sexual identity. To the authors' knowledge, this study is the first of its kind.
Study concepts: LGBQ population, structural and numerical ageing
For the purposes of this study, the LGBQ population is defined as all those who identify as gay, lesbian, bisexual, pansexual, queer and other identities which are not heterosexual. This is consistent with the definition used in the sexual identity population estimates for 2016 which we use as the starting population for our projections (Wilson et al., Reference Wilson, Temple, Lyons and Shalley2020). Other definitions of sexual orientation are possible, including those based on sexual behaviour or sexual attraction (Durso and Gates, Reference Durso, Gates and Baumle2013). We focus on sexual identity because it is the only population concept for which there are sufficiently robust and up-to-date data available for Australia. It should be noted that this population refers to those who report a sexual identity in statistical instruments. Not everyone who considers themselves to be gay, lesbian, bisexual, queer, etc., or who experiences same-sex sexual attraction or behaviour will do so (Gates, Reference Gates2012). This population definition therefore includes trans people and those with intersex variations if they identify as LGBQ – and not all do (Meyer et al., Reference Meyer, Wilson and O'Neill2021).
To examine the ageing of the LGBQ population, we distinguish between multiple demographic measures of population ageing (Temple et al., Reference Temple, Wilson, Taylor, Kelaher and Eades2020). Specifically, population ageing can be expressed as several facets of demographic change, including: (a) numerical (absolute size), (b) structural (relative size), (c) timing (location in time), and (d) spatial (location in space) aspects. The underlying demographic processes (fertility, mortality and migration) have varying effects on these distinct, yet related concepts of population ageing (structural, timing, numerical and spatial). Due to data limitations at this time, our modelling does not consider spatial aspects. We focus primarily on the numerical and structural aspects of ageing but also consider timing aspects.
Numerical ageing is oftentimes measured by the numerical increase or the numerical growth rate of the older population. Numerical ageing, in the short-to-medium term, is strongly influenced by improved life expectancy. Structural ageing refers to the increasing proportions of the population becoming ‘old’. In our analyses, we follow demographic tradition and utilise age 65+ as the cut-off point to measure levels of structural ageing. Structural ageing is predominantly a function of falling or low fertility. At the national level, increasing life expectancy and migration are generally considered secondary factors that influence structural ageing.
Specific to the LGBQ population, transitions between sexual identity states (i.e. from heterosexual to LGBQ status and vice versa) can also alter the level and speed of both numerical and structural ageing. This issue is considered in the sensitivity analyses outlined below.
Data and methods
Projection model
To produce projections of the population by sexual identity, we draw upon new advances in demographic modelling (Wilson et al., Reference Wilson, Temple and Lyons2021). Specifically, we develop a modified multi-state cohort-component projection model in which the adult population, aged 18 years and above, is divided into sexual identity categories, and the childhood population, aged 0–17, is projected separately and is not categorised by sexual identity. The model was designed according to the principles of movement population accounts (Rees, Reference Rees1984) and is based around a set of population accounting equations. The accounting equation for the childhood population can be expressed as:

while for the adult population the equivalent is:
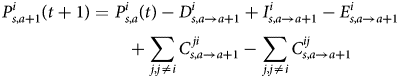
where P = population; t = time; a = age; a → a + 1 = the change in a cohort's age from a to a + 1 between times t and t + 1; s = gender; i, j = sexual identities; D = deaths; I = immigration; E = emigration; and C = identification change between sexual identity categories.
The time reference for demographic components of change in the equations is the projection interval t to t + 1 but labels are omitted for clarity.
Immigration is projected directly as flows because it is less influenced by population sizes and more by policy settings. Deaths, emigration and identification change in both equations are projected by multiplying an occurrence/exposure rate by the population at risk. For example, emigration in Equation 2 is projected as:
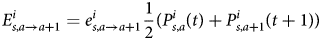
where e = emigration rate.
The population-at-risk of emigration is calculated as the mean of the start-of-interval population at the end-of-interval population. The latter is permitted on the right-hand side of the equation because an iterative calculation scheme is employed whereby the end-of-interval population is updated in successive iterations until convergence is achieved. For the newly born cohort the population-at-risk is defined differently; it is approximated as half the end-of-interval population aged 0, following Willekens and Drewe (Reference Willekens, Drewe, Heide and Willekens1984).
When cohorts in the childhood ages reach the age of 18, they are assumed to adopt a particular sexual identity:
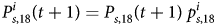
where p = proportion of the population with a specified sexual identity.
This simplification of the more complex reality of developing a sexual identity over many years is necessary due to data limitations.
Births are projected by multiplying ASFRs by the female population at risk in the standard way:
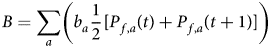
where B = births; b = ASFR; and f = females.
Births are then divided by sex using the sex ratio at birth of 105.5 males per 100 females. Births are not projected separately by sexual identity of women because this output is not required for the purposes of this study; it also avoids the challenge of indirectly estimating fertility rates by sexual identity.
Data sources
The 2016 populations used as the ‘jump-off’ populations for the projections were prepared by disaggregating to single-year age groups the broad age group population estimates by sexual identity created earlier by Wilson et al. (Reference Wilson, Temple, Lyons and Shalley2020). These estimates were sourced using data from three data collections from two representative national household surveys: the General Social Survey (GSS), and Waves 12 and 16 of the Household, Income and Labour Dynamics in Australia (HILDA) Survey. These data are adjusted to be consistent with the official Estimated Resident Population (ERP) of Australia. For further information, see Wilson et al. (Reference Wilson, Temple, Lyons and Shalley2020). Data on the Total Fertility Rate (TFR) and age-specific fertility rates (ASFRs) were obtained from various issues of the Births Australia publication on the Australian Bureau of Statistics (ABS) website (ABS, 2021a). Mortality data for Australia were downloaded from Deaths Australia publications (ABS, 2021b) and the Human Mortality Database (HMD, 2021). A series of historical life tables were calculated using these deaths and population estimates from the HMD and ABS (HMD, 2021; ABS, 2021c). International migration data were obtained from the ABS publication Migration Australia (ABS, 2021d) as well as from customised tables of single year of age immigration and emigration data obtained directly from the ABS. Data on changes to reported sexual identity over time were obtained from the HILDA Survey waves of 2012 and 2016. HILDA is a large panel survey covering about 17,000 private household residents each year (Watson and Wooden, Reference Watson and Wooden2021). Since 2012 it has asked questions on sexual identity every four years.
Projection assumptions
The above model was used to produce projections of Australia's LGBQ population from 2016 to 2041. The formulation of projection assumptions presented a considerable challenge due to the limited coverage and quality of data on sexual identity populations. Just two sexual identity categories in the adult ages, LGBQ and heterosexual, were selected for these projections. The initial jump-off populations for 2016 were created by using the population estimates by gender and broad age group prepared by Wilson et al. (Reference Wilson, Temple, Lyons and Shalley2020) and disaggregating them to single-year age groups. The disaggregation process involved linear interpolation of the proportions of the population identifying as LGBQ from broad ages to single-year age groups, multiplying these proportions by single-year ERPs, and then making final adjustments to ensure single-year age LGBQ populations summed over age to the original broad age groups. For the childhood ages of 0–17, the jump-off populations consisted of ERPs prepared by the ABS (2022).
Fertility assumptions were prepared in terms of the TFR and the age profile of ASFRs. A long-run TFR of 1.65 was selected with a temporary decline over the first few years due to the impacts of COVID-19. The age profile of fertility was assumed to continue shifting gradually to older ages for the first decade of the projection horizon, and then remain constant.
Mortality assumptions were specified in terms of life expectancy at birth, with the same assumptions used for both sexual identity populations due to data limitations. Life expectancy was assumed to continue long-run improvements so that male life expectancy at birth would rise from 80.0 years in 2016–2017 (the first projection period from 1 July 2016 to 30 June 2017) to 86.3 years in 2040–2041, while female life expectancy would increase from 84.9 years in 2016–2017 to 88.8 years by 2040–2041.
Immigration and emigration projections were constrained to total net migration assumptions. Net international migration was assumed to be 225,000 per annum from 2025–2026 onwards, but with a big COVID-related drop in the short run. Due to the lack of migration data by sexual identity, immigration was divided between sexual identity populations according to population size, while the same set of national emigration rates was applied to both populations.
Two projection scenarios were created which differ only in their assumptions on identification change. Because of the limited data environment, we stress that both these scenarios are speculative and involve considerable amounts of judgement. A third scenario assuming zero identification change is also included for illustrative purposes.
For the no identification change scenario, we assumed that as cohorts turned age 18 the proportions adopting a sexual minority identity in the future would be the same as the sexual minority proportions for males and females aged 18–24 in the 2016 population estimates (Wilson et al., Reference Wilson, Temple, Lyons and Shalley2020). Older cohorts were assumed to retain their sexual minority proportions estimated for 2016. Specifically, each person is assumed to age through time with the same sexual identity they reported in 2016. In this scenario, the social and legal environment for sexual minority individuals does not progress any further despite the huge shift in social attitudes and introduction of legal protections associated with sexual orientation in Australia over the last few decades (Campbell et al., Reference Campbell, Perales and Baxter2021). Prejudice, discrimination and stigma – minority stress (Meyer, Reference Meyer2003) – remain constant into the future and result in no further increases in sexual orientation identification by cohort.
For the identification change scenario, we assumed that the proportion of the population assuming a sexual minority identity at age 18 would continue to increase, and that there would be changes to reported sexual identity at all adult ages. In this scenario, progress in social attitudes and legal protections continue, and people are more willing to describe themselves as having sexual minority identities. Younger cohorts experience their formative years and develop their sexual identities in more accepting social environments (Meyer et al., Reference Meyer, Wilson and O'Neill2021), and over time therefore a greater proportion feel comfortable adopting a sexual minority identity. This scenario assumes continuation of the trend observed in the United States of America where younger cohorts are much more likely to identify as LGBQ+ (Jones, Reference Jones2022). The proportion reporting a sexual minority identity at age 18 was assumed to gradually increase over time based on the trend observed between 2012 and 2016 up to a ceiling of 0.1. The limit of 0.1, although arbitrary, was imposed to prevent the proportions becoming very large by the end of the projection horizon due to the uncertainty of extrapolating a change measured over just a four-year period. We calculated identification change rates by age and gender based on reported change in sexual identity between 2012 and 2016 in the HILDA Survey. Due to the small sample size and jagged age schedules of rates, we applied smoothing to the rates using cubic splines (Wilson et al., Reference Wilson, Temple and Lyons2021). Because of the small sample size and uncertainty surrounding these identification change rates by age and gender, they were constrained to a total net identification change number during the calculation of the projections. This number acts as a plausibility constraint on the changes to and from the LGBQ population. The age- and sex-specific flows from the LGBQ population, and flows to it, are proportionally adjusted so that they match the total net identification change assumption. The net identification change assumption for the first year of the projections was derived from the annual average amount of change indicated by the HILDA Survey between 2012 and 2016. We assumed that net gains to the sexual minority population would fall gradually to zero over the next two decades as society becomes more accepting of the sexual diversity.
For illustrative purposes, we created an additional set of projections in which the proportions of the population identifying with a sexual minority identity by age and gender remain constant over time. We refer to this as the fixed propensity scenario. Specifically, the age–sex rates of identification remain constant implying that future cohorts of the older population are attributed with the sexual identification rates of the older population in 2016. Thus, changes to the sexual minority population occur from national population growth alone. This projection is included primarily to advise against using this simple approach, and to emphasise the importance of explicitly modelling the various demographic processes which affect population change (particularly identification change).
Sensitivity analyses
To illustrate the potential impact of identification change on the projections, we undertook a simple sensitivity analysis to demonstrate the effect of different rates of identification change to and from the sexual minority population. Annual age-invariant rates of heterosexual to sexual minority change from 0.0005 to 0.0050 were applied in several increments, and then equivalent rates of sexual minority to heterosexual change from 0.0125 to 0.1250 were applied, also in several increments. The maximum values of these rates approximate twice the annual average identification change rates apparent between 2012 and 2016 for the 40+ population in the HILDA Survey.
We also undertook a sensitivity analysis for mortality given the application of national mortality rates to the sexual minority population. We created projections with life expectancy at birth being varied for both males and females by up to five years either side of the national life expectancy assumption. The variation was applied throughout the projection horizon, and life expectancy was progressively increased and decreased in one-year increments. Life expectancy at five years above or below national life expectancy should be considered an extreme assumption, with a one- or two-year variation being more plausible.
Ethics approval for this project was granted by the Melbourne School of Population and Global Health Human Ethics Advisory Group.
Results
Structural and numerical ageing of the LGBQ population
Table 1 presents projections of numerical and structural ageing of the LGBQ population over the period 2016–2041. In 2016, we estimate approximately 76,000 Australians aged 65 and over reported a LGBQ identity. By 2041, we project approximately 200,000 older Australians with a LGBQ identity, with the figure higher for the identification change scenario (207,000) relative to the no identification scenario (194,995). Even using the unrealistic assumption implied by the fixed propensity scenario, the older LGBQ population is simulated to grow to almost 140,000 people. This population growth amounts to a 171 per cent increase in the 65+ LGBQ population under the identification change scenario and a 154 per cent assuming no identification change.
Numerical and structural ageing of the LGBQ population, 2016–2041
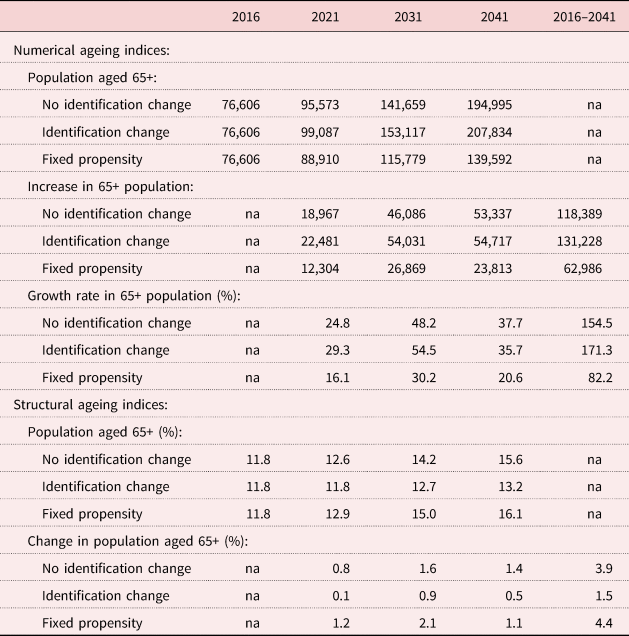
Note: na: not applicable.
Whereas numerical ageing is simulated to grow strongly, the projected levels of structural ageing are more subdued (Table 1). In 2016, we estimate approximately 12 per cent of the LGBQ population are aged 65 or over, with this figure growing to between 13 and 16 per cent by 2041. The identification change scenario leads to a slight rejuvenation effect of the population, due in part to transitions at younger ages. Nonetheless, regardless of the scenario, the LGBQ population ages structurally over the period, but at a lower level and speed as exhibited by the numerical ageing indices.
This disparity between the change in numerical and structural ageing over the period raises the question of the relative levels of ageing in the LGBQ population when compared to the heterosexual population. Results in Figure 1 display the level of structural ageing (65+ as a proportion of each population) and numerical ageing (annualised growth rate in the 65+ population) for the heterosexual and LGBQ population – using the conservative assumption of no identification change. It is clear the current level and projected speed of structural ageing is significantly higher in the heterosexual population, relative to the LGBQ population. In 2016, 20.2 per cent of the heterosexual population is estimated to be aged 65 and over, growing to 26.6 per cent in 2041 – an average annualised changed of 0.27 per cent. The comparative figures for the LGBQ population being 11.6, 13.2 and 0.07 per cent, respectively.
Structural and numerical ageing in the LGBQ and heterosexual (Het.) population, 2016–2041.
Note: No identification change assumption.
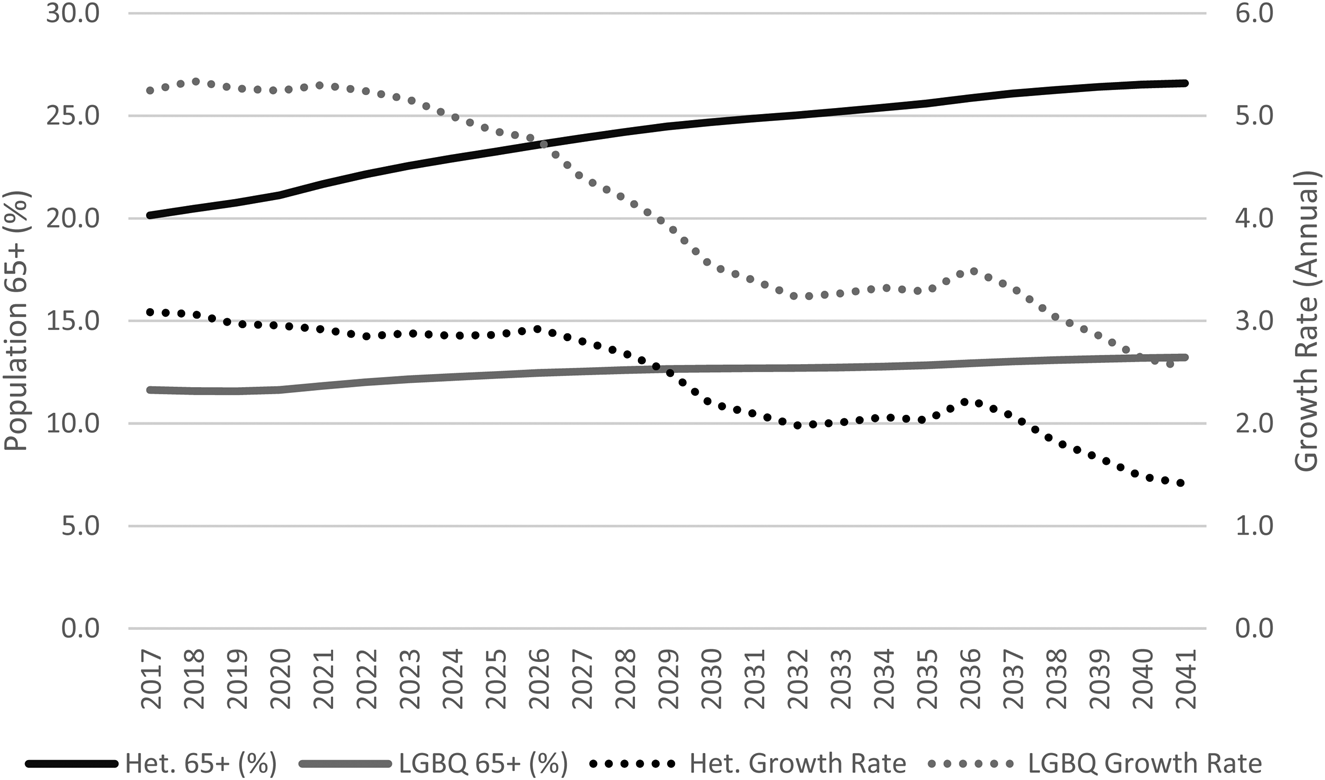
However, of particular interest, numerical ageing (as indicated by percentage growth in the 65+ population) is significantly higher in the LGBQ population relative to the heterosexual population. Over the period 2016–2041, the older LGBQ population grows by 154.5 per cent (Table 1; Figure 1), or by an average annualised rate of 6.2 per cent. The comparative figures for the heterosexual population being 82.1 and 3.3 per cent, respectively.
LGBQ population by gender and age
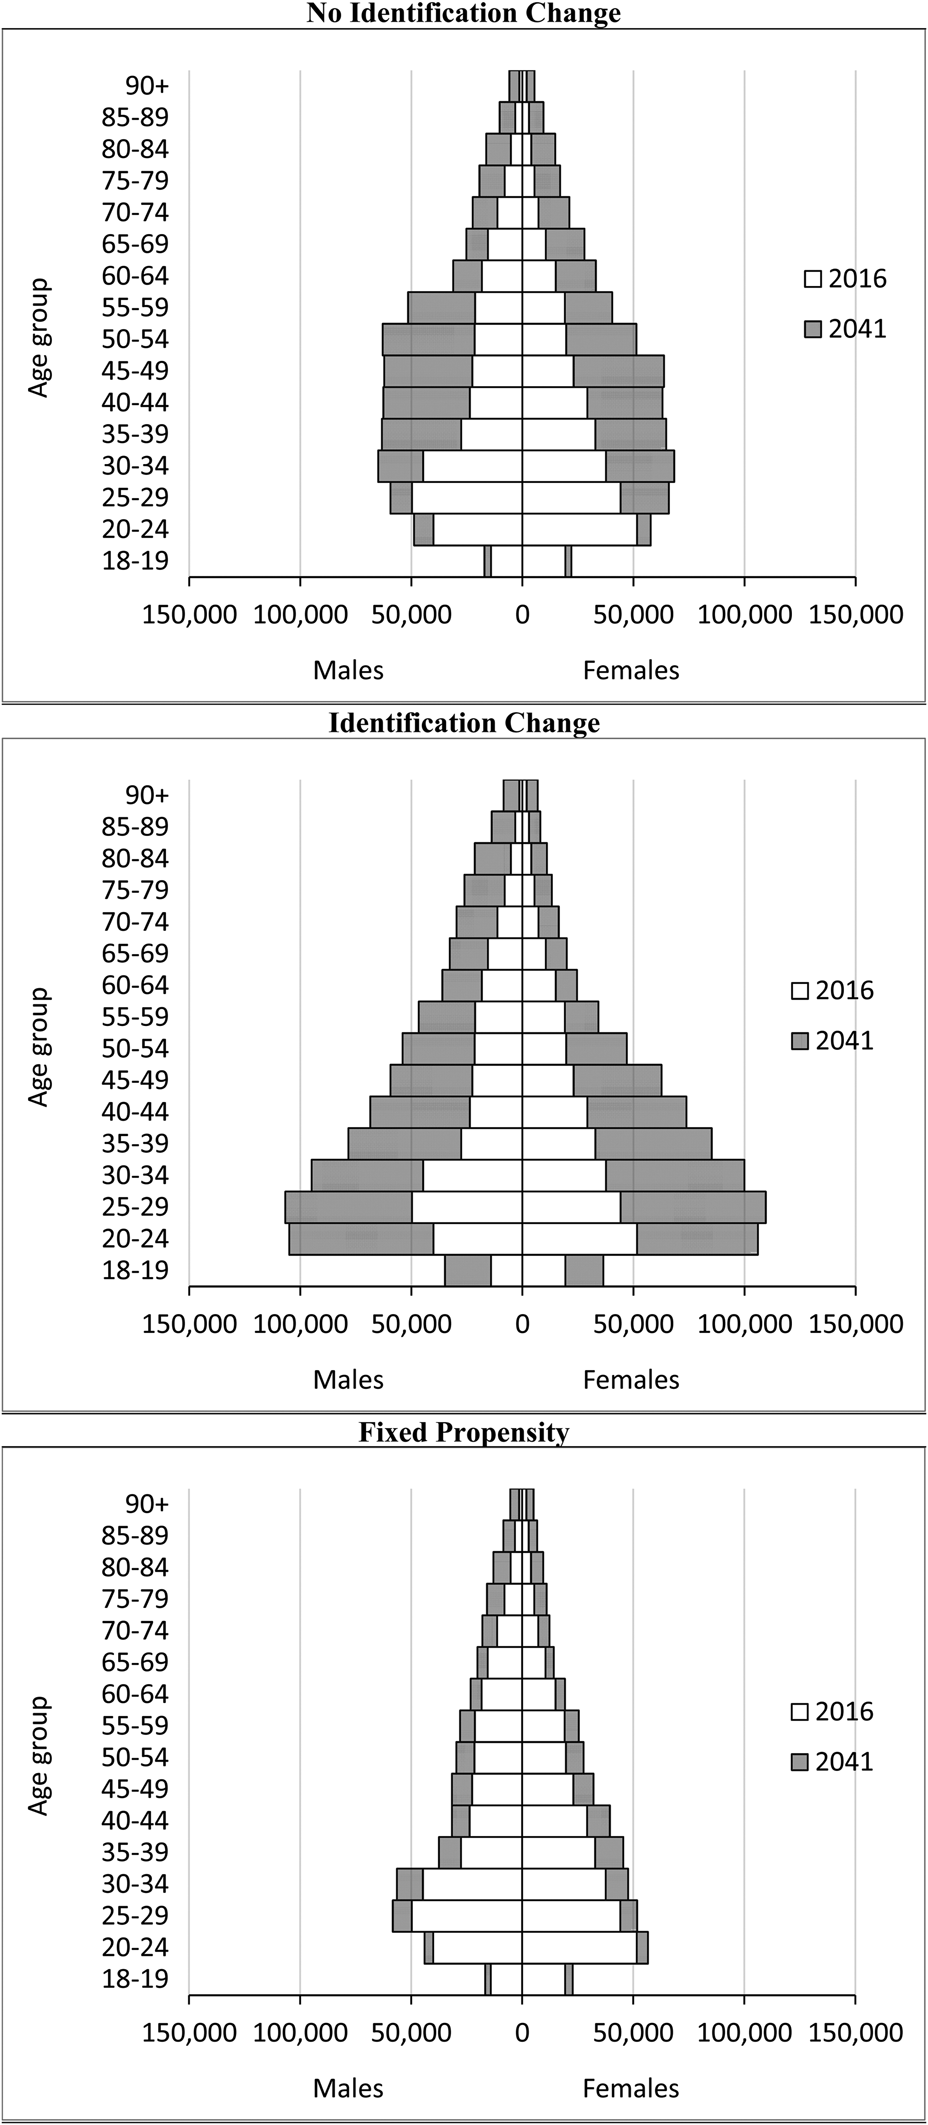
The age–sex distribution of the LGBQ population under each of the scenarios is shown in Figure 2, with the shaded areas indicating the year 2041 and unshaded areas indicating the population at each age and sex in 2016. It is clear from these results that the LGBQ population continues to grow at all ages regardless of the assumptions used, even under the unrealistic fixed propensity assumption. Growth in younger age groups is particularly strong in the no identification change and identification change assumptions, indicating the importance of allowing for cohort shifts in sexual identity propensities. The rejuvenation effect is particularly highlighted in the identification change scenario, highlighting the key driver of identification change in LGBQ population growth. Although numerically, population change at the older ages is lower than the younger age groups, in percentage growth terms, the shift in numerical ageing is very significant, as indicated earlier.
Population pyramids of the LGBQ population by scenario, 2016 (unshaded) and 2041 (shaded).
Sensitivity analysis
These alternative projection scenarios highlight the question of the relative sensitivity of LGBQ population projections with respect to variations in the underlying assumptions. With the 65 and over population, two of the assumptions most likely to impact upon future population trajectories relate to mortality and identification change across the lifecourse.
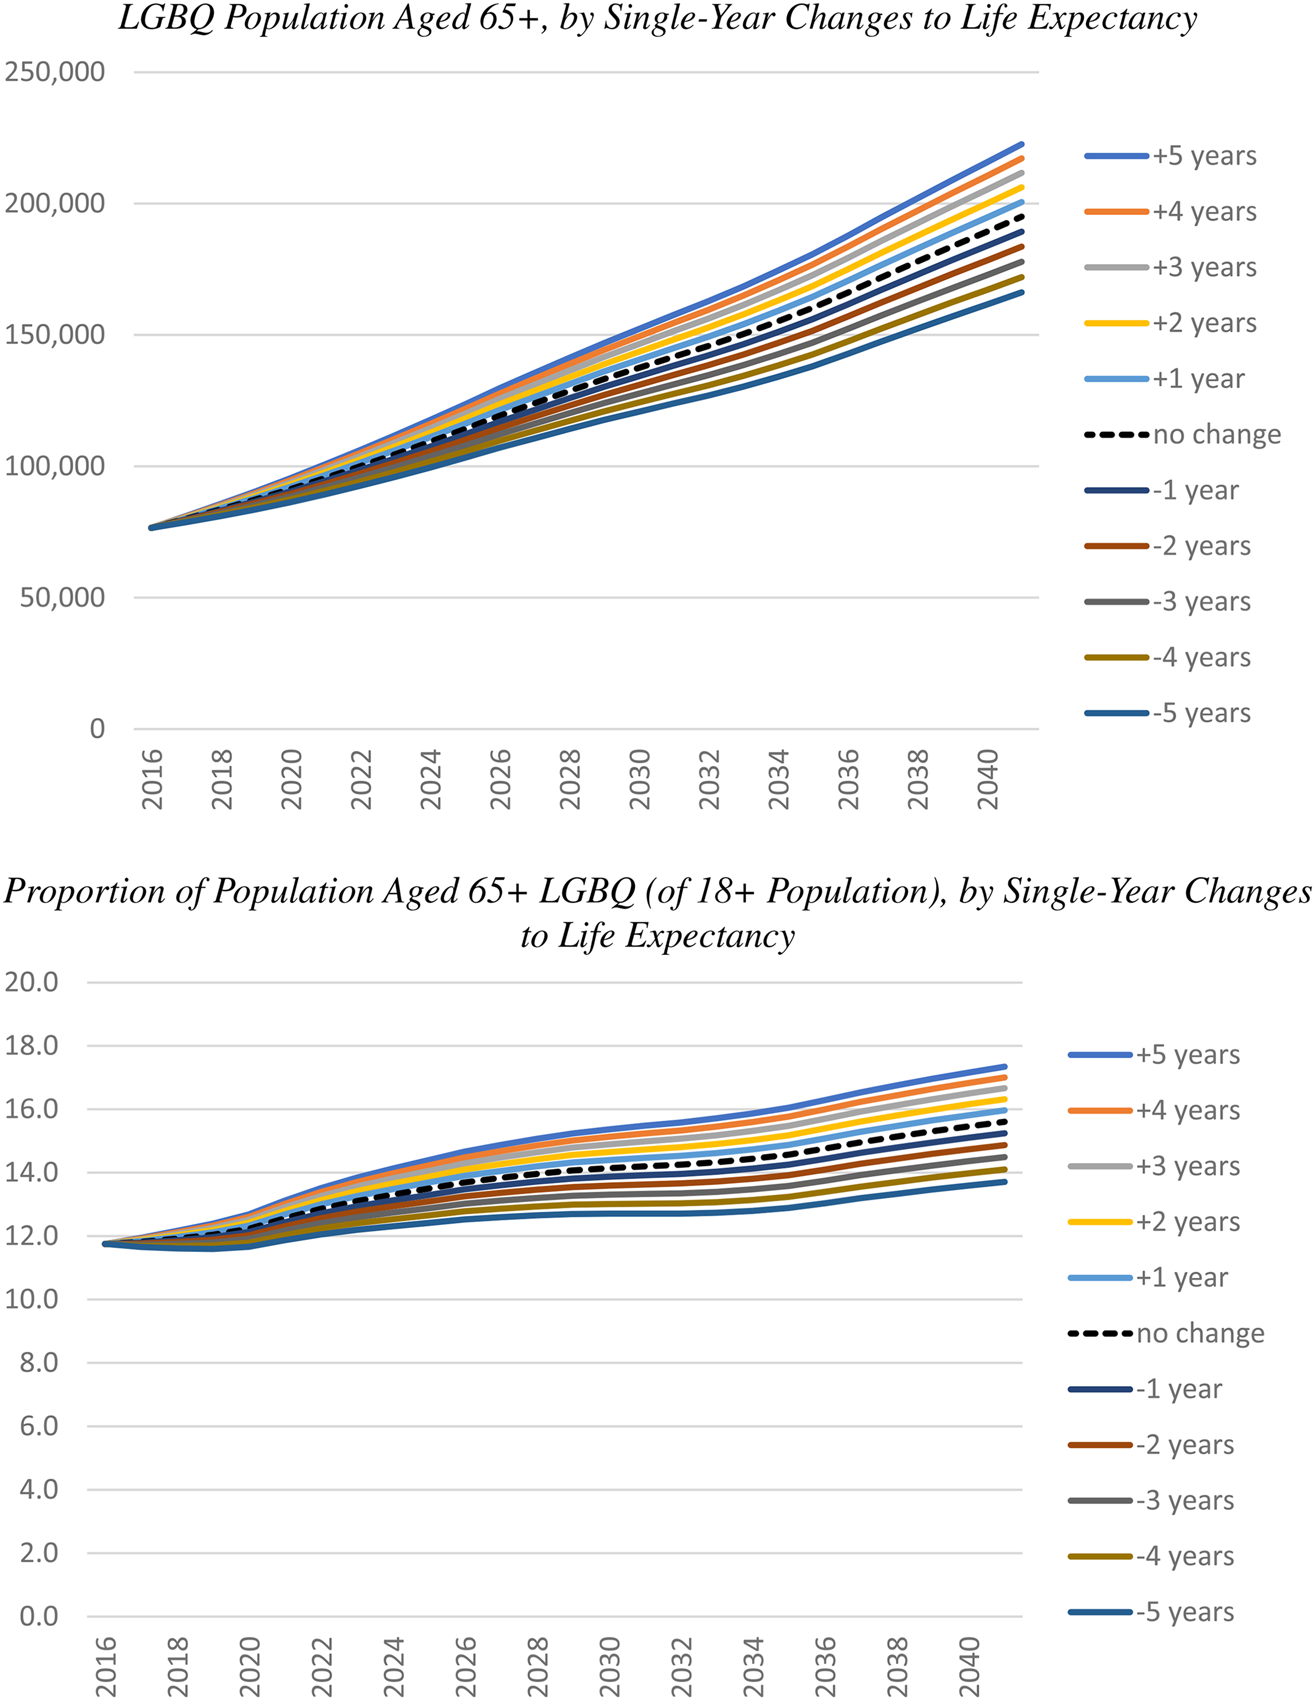
Figure 3 plots numerical and structural ageing in the LGBQ population over the period 2016–2041 by single-year increments and decrements to changes in life expectancy. It is important to note that life expectancy at five years above or below national life expectancy should be considered an extreme assumption, with a one- or two-year variation being more plausible. With this caveat in place, it is clear that a one- or two-year increment or decrement to life expectancy has only a very moderate impact on either numerical or structural ageing.
LGBQ population by single-year increments and decrements to life expectancy, numerical ageing (top panel) and structural ageing (bottom panel).
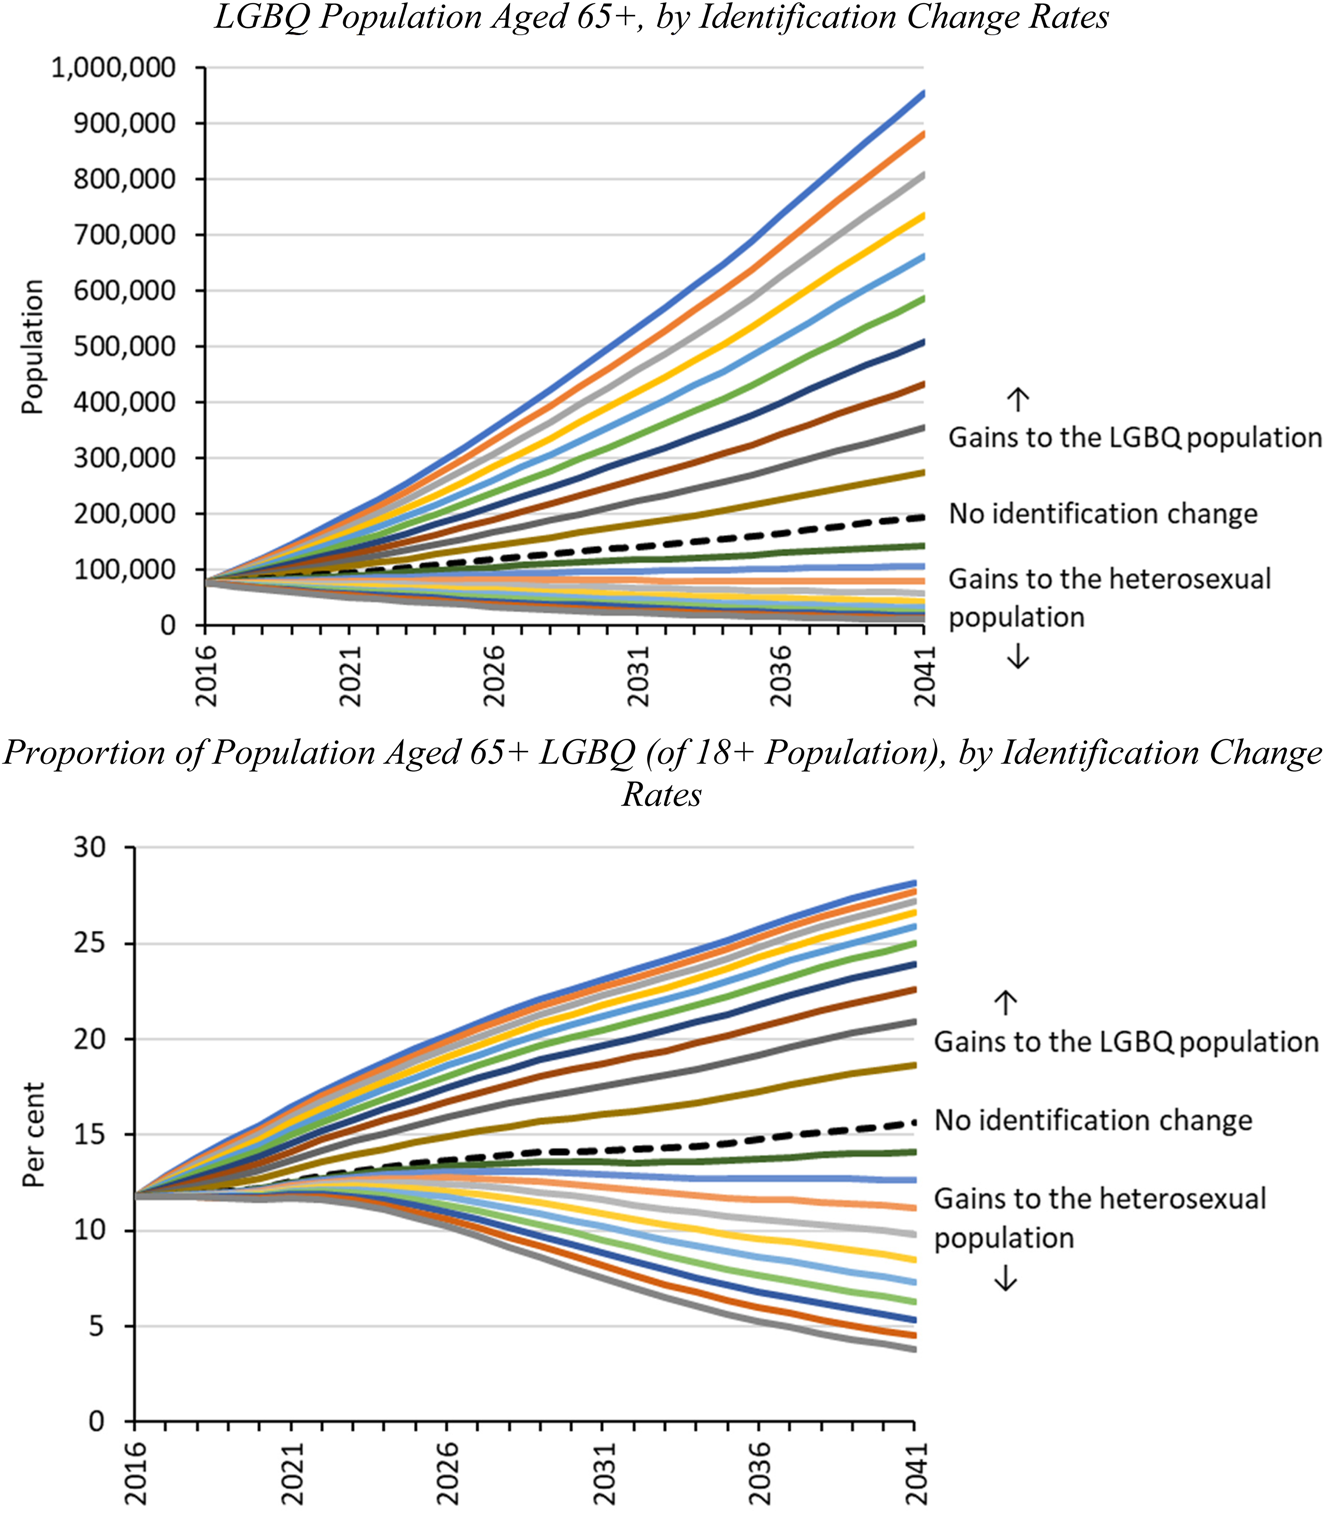
In contrast, plausible variations to identification change can have substantial impacts on both the level of numerical and structural ageing in Australia (Figure 4). For example, a 0.0005 increment to identification change increases the 65+ population by 41 per cent by 2041, and increases the proportion of the 65+ population by 3.1 per cent over the same period. An additional 0.0005 increment to 0.0010 in identification change increases numerical ageing very considerably, to 355,000 by 2041, from a 2016 baseline of 76,606. These scenarios, while not meant to be indicative of reality, indicate the considerable impact of identification change on levels of projected numerical and structural ageing.
LGBQ population by increments and decrements to identification change, numerical ageing (top panel) and structural ageing (bottom panel).
Notes: Sensitivity analysis: identification change and the LGBQ population. Each line above and below the broken line indicates the effect of different rates of identification change to and from the sexual minority population. Annual age-invariant rates of heterosexual to sexual minority change from 0.0005 to 0.0050 were applied in several increments, and then equivalent rates of sexual minority to heterosexual change from 0.0125 to 0.1250 were applied, also in several increments.
Discussion
The primary result of the projections summarised in this paper is that strong numerical ageing of Australia's LGBQ older population can be expected over the next two decades. However, there is relatively modest structural population ageing projected, especially in the identification change scenario. This is due to strong growth at both younger and older ages. This result highlights the importance of distinguishing structural from numerical population ageing. Focusing on structural ageing in isolation may lead to the conclusion that the older LGBQ population is not ageing or is ageing at a lower rate than the heterosexual population. Consequently, focusing on structural ageing alone, one may erroneously conclude that from a demographic perspective, addressing policy issues for this older population specifically is a lower-order priority.
Indeed, for aged care, health and other social services, numerical ageing, rather than structural ageing, is the most relevant growth indicator for planning, budgeting and building inclusive care for the older LGBQ community within mainstream services. That is, the increasing numbers of older people, rather than the proportion of the LGBQ population that is ‘old’, is the relevant measure for service provision. Previous research from the individual ageing literature has highlighted particular problems with current aged care provision for LGBQ people, including, but not limited to, invisibility and discrimination in care, the urgent need for inclusive formal aged care that is responsive to this population, and for improved training and support for home care staff (Willis et al., Reference Willis, Maegusuku-Hewett, Raithby and Miles2016; Simpson et al., Reference Simpson, Horne, Brown, Brown Wilson, Dickinson and Torkington2017, Reference Simpson, Almack and Walthery2018; Leyerzapf et al., Reference Leyerzapf, Visse, De Beer and Abma2018). Indeed, addressing deficiencies and promoting best practices in aged care (Willis et al., Reference Willis, Maegusuku-Hewett, Raithby and Miles2016; Leyerzapf et al., Reference Leyerzapf, Visse, De Beer and Abma2018; Hafford-Letchfield et al., Reference Hafford-Letchfield, Pezzella, Connell, Urek, Jurček, Higgins, Keogh, Van de Vaart, Rabelink, Robotham, Bus, Buitenkamp and Lewis-Brooke2023) is a demographic imperative given that we conservatively estimate population growth of 150–170 per cent of the older LGBQ population by mid-century. More generally, governments, organisations and services that invest in and co-ordinate programmes to support older LGBQ people, such as mental, physical and sexual health programmes, will need to consider options for scaling-up and expansion, as well as greater outreach in connecting people with services.
In terms of demographic modelling, an important contribution of our work is the way in which identification change is treated. We take a multi-state approach (Ledent and Zeng, Reference Ledent, Zeng and Zeng2010) in which identification change is endogenous to the model: gains to one sexual identity population are a function of the sizes of other population groups and identification change rates. Modelling populations which interact with other populations through changes in membership is best achieved with this type of model because it tends to avoid implausible results. If the LGBQ population was to be projected in isolation, identification gains to the population would have to be determined exogenously and would have no connection to the originating population size.
Through sensitivity analyses, we also detailed the important contribution of identification change to the degree of numerical and structural ageing of the LGBQ population. Findings from the literature on LGBQ individual ageing published in Ageing & Society provide some insight into the changes in identification change across time and cohorts. For example, Lyons et al. (Reference Lyons, Croy, Barrett and Whyte2015: 2247) found that over the lifecourse, their sample of older gay men noted a ‘greater public- and self-acceptance of their sexuality and greater freedom to engage in same-sex relationships. However, key challenges emerged, such as age-related stigma within the gay community and, for some men, a sense of loss of community over time’. Upon entry to aged care in particular, identification can change. Simpson et al. (Reference Simpson, Horne, Brown, Brown Wilson, Dickinson and Torkington2017) argue that ageism, by restricting opportunities for not only sexual expression but intimacy more generally, can force many older LGBQ people to ‘deny or disguise their identity’. This is summarised well by Bower et al. (Reference Bower, Lewis, Bermudez and Singh2021: 977) who note ‘the gay men in this study were strongly affected by the cumulative experiences of living in a heteronormative and homophobic society, as well as the trauma of being rejected by their families of origin and disenfranchised by society’. At the same time, with respect to younger age groups, these authors note:
we are in an exceptional time when younger generations are exploring and questioning their sexual and gender identity with more ferocity. As these younger cohorts continue to embrace life's subjective meanings and network with diverse peers through social media platforms, we will no longer be able to box them in, check them off or assign them a socially constructed identity. As demonstrated by these participants, identity is fluid and is externally influenced by politics, relationships and social positioning. (Bower et al., Reference Bower, Lewis, Bermudez and Singh2021: 977)
These qualitative findings highlight the considerable changes across the lifecourse, time and cohorts with respect to identification change. How this dynamism continues into the future will pose important implications for the size of the identifying LGBQ population.
Indeed, the most uncertain aspect of the projections concerns assumptions about identification. The limited extent and quality of data available on how people report their sexual identity over time means that we only have an approximate handle on recent identification change trends. Despite the considerable qualitative evidence outlined above, there is little theory and only recently emerging quantitative evidence to guide the formulation of assumptions on how these trends are likely to develop in future years. Despite these limitations, we believe the broad picture painted by the projections is correct.
In interpreting the results from our study, it is important to recognise further limitations of scope, data and methods. Importantly, the projection scenarios cannot be interpreted as forecasts. Instead, they should be considered as illustrative projections of demographic outcomes if the input data and projection assumptions were to eventuate. The 2016 ‘jump-off’ populations remain uncertain because they were estimated from survey data and not based on a full enumeration of the population, as would be the case if sexual identity was asked in the Australian census. The fertility projection assumptions are not disaggregated by sexual identity and should be as accurate as those in any standard set of population projections. Identical mortality assumptions were applied to both the LGBQ and heterosexual populations, and while this is an approximation, our life expectancy sensitivity analysis showed relatively little sensitivity to any plausible mortality differences. The assumption of proportional distribution of immigration and emigration between LGBQ and heterosexual populations is more uncertain. Again, asking sexual identity in the census would provide valuable information on migration by sexual identity.
The method we have developed provides an opportunity to estimate and project LGBQ populations across the world, with recent availability of census data in the United Kingdom (UK) providing a prime opportunity. In applying this model across nation states, however, the role of socio-political context in LGBQ identification requires careful consideration. Legal barriers, for instance, still exist in many parts of the world that would distort the estimation of prevalence and transition probabilities between sexual identity states. There are approximately 70 countries that criminalise same-sex sexual practices (Carroll and Mendos, Reference Carroll and Mendos2017), with harsh legal penalties of same-sex relationships in many countries, e.g. in Nigeria (Arimoro, Reference Arimoro2019) and Russia (Chandler, Reference Chandler2021). These consequences incite fear of disclosure of sexual identity, thereby making it difficult or impossible to gain accurate information around prevalence.
We also note some conceptual approximations inherent in the projection model, largely due to data limitations. One main limitation is the simplistic adoption of a sexual identity at age 18. In reality, sexual identities emerge across a range of ages, but we have no reliable data on this. A second key limitation is the omission of gender identities other than male or female. Unfortunately, there is no official demographic data on this in Australia at present.
Conclusion
Noting these limitations, this study has been the first to investigate the size and future of numerical and structural ageing in the Australian LGBQ population using new data alongside recent advances in demographic modelling. Our results underscore the importance of (a) endogenising identification change in projections of the LGBQ population, (b) disaggregating numerical from structural ageing, and (c) highlighting the strong level of numerical ageing in the LGBQ population – occurring at almost twice the speed of the heterosexual population. These findings, when taken alongside evidence from the individual ageing literature, highlight important implications for policy, service provision and research.
Our study may be extended in several ways. Firstly, the methods, concepts and materials we outline are transferable to other countries with appropriate population-level measurement of sexual identity (noting the limitations outlined above). With new census data from the UK and Canada available during 2022, this presents a unique opportunity to understand the size and futures of ageing of the LGBQ population, potentially at the sub-national level. New Zealand, too, has indicated that sexual identity will be collected in its 2023 census. Secondly, recent analysis indicates considerable spatial clustering of the LGBTQ population in Australia (Wilson and Temple, Reference Wilson and Temple2022). An understanding of the location of future cohorts of the LGBTQ population could assist with the planning of aged care needs now and in the future. Third, the ability to disaggregate LGBQTI subgroups is critical (Segbedzi et al., Reference Segbedzi, South, Hughes and Malta2020), but this is currently limited by data constraints in the Australian context. Finally, integrating findings from the individual ageing literature with the projections herein can help to better inform transitions between sexual identity states and thereby assist with improved modelling and estimates. More generally, continuing to build the evidence base on aspects of LGBTQ individual and population ageing is critical to ensure not only the visibility of this population, but also to ameliorate future planning for health, care and social service provision that is appropriate and well-funded.
Acknowledgements
This paper uses unit record data from the Household, Income and Labour Dynamics in Australia (HILDA) Survey. The HILDA Project was initiated and is funded by the Australian Government Department of Social Services (DSS) and is managed by the Melbourne Institute of Applied Economic and Social Research (Melbourne Institute). The findings and views reported in this paper, however, are those of the authors and should not be attributed to the DSS or the Melbourne Institute.
Author contributions
The authors jointly contributed to the authorship of the article.
Financial support
This work was supported by the Australian Research Council Centre of Excellence in Population Ageing Research (project number CE1101029).
Competing interests
The authors declare no competing interests.
Ethical standards
Ethics approval for this project was granted by the Melbourne School of Population and Global Health Human Ethics Advisory Group (ID 2056346.1).


 Open access