


Introduction
Sommerville et al. (Reference Sommerville, Jones and Milner-Gulland2009) argued that the use of positive incentives is the guiding philosophy of payments for ecosystem services (PES) and conditionality the means of influencing behaviour. Whilst a variety of incentives have been used in PES schemes, monetary incentives (henceforth payments) are considered to maintain conditionality most directly, as they are amenable to adjustment according to performance (Milne & Niesten, Reference Milne and Niesten2009). However, little empirical work on PES has considered the importance of payments in motivating participation.
In examinations of motivations for participation in PES schemes it has been found that payments often do not cover opportunity costs (Kosoy et al., Reference Kosoy, Martinez-Tuna, Muradian and Martinez-Alier2007; Sommerville et al., Reference Sommerville, Milner-Gulland, Rahajaharison and Jones2010; Van Hecken & Bastiaensen, Reference Van Hecken and Bastiaensen2010). This challenges what Pagiola et al. (Reference Pagiola, Arcenas and Platais2005) call prima facie evidence that voluntary PES schemes are of net monetary benefit to participants. In cases where the payment does not play a decisive role, other factors must be important. In a Madagascan example, behavioural changes were motivated more by fear of sanction than by a desire to increase the community payment (Sommerville et al., Reference Sommerville, Milner-Gulland, Rahajaharison and Jones2010). There is also evidence that perceived non-monetary benefits of PES schemes include improved land tenure security and community organization, and the perception that such schemes will increase the visibility of participants to assistance from government or non-government bodies (Wunder, Reference Wunder2007; Kosoy et al., Reference Kosoy, Corbera and Brown2008). Hence, motivations for involvement in PES schemes do not reduce to a purely monetary rationale and environmental values interplay with other motivations (Kosoy et al., Reference Kosoy, Corbera and Brown2008).
Many authors have highlighted the possibility that intrinsic environmental motivations may be crowded out by incentives (Corbera et al., Reference Corbera, Brown and Adger2007; Sommerville et al., Reference Sommerville, Jones and Milner-Gulland2009; Pattanayak et al., Reference Pattanayak, Wunder and Ferraro2010; Van Hecken & Bastiaensen, Reference Van Hecken and Bastiaensen2010). However, investigating this empirically is constrained by two methodological challenges, which may explain why Vatn (Reference Vatn2010) considers the issue to be under-researched. Firstly, research on crowding out relies on understanding environmental values and motivations in communities that receive payments. Research of this nature is grounded in Western cultural constructs and relies on elicitation methods such as statement ranking, which are challenging to apply across linguistic and cultural settings. The second challenge relates to time-scales. To examine whether PES crowds out other values one would ideally employ a longitudinal research design, including the ability to determine causality of outcomes. Hence, to the extent that the issue of crowding out has been addressed in the literature on PES, it has been through inference from more generic research in psychology and economics on the interaction between extrinsic rewards and intrinsic motivations. In a meta-analysis Deci et al. (Reference Deci, Koestner and Ryan1999) found that rewards typically reduce intrinsic motivations, even when rewarding performance, as they tend to preclude self-regulation. Frey & Jegen (Reference Frey and Jegen2001) drew similar lessons from the economics literature and considered these findings to apply across cultures. Reviewing literature on behavioural economics experiments, Bowles (Reference Bowles2008) found that occasionally rewards complement ethical motives but in many situations rewards erode and displace these. Hence, concerns about PES crowding out pre-existing environmental motivations are founded in empirical work elsewhere.
This possibility of crowding out has important implications for the temporal sustainability of PES schemes and whether payments foster an attitude of ‘no pay, no care’ (in the words of Swart, Reference Swart2003). Engel et al. (Reference Engel, Pagiola and Wunder2008) and Pattanayak et al. (Reference Pattanayak, Wunder and Ferraro2010) found no reason why the service will be provided after payments end, although this assumes that livelihood strategies have not been significantly altered. Payment for ecosystem services targeting carbon sequestration have particular implications in this regard as the permanence criterion requires long contract time-scales, which are challenging for participants to honour (Wunder & Albán, Reference Wunder and Albán2008). Here I address two linked questions: (1) Where do payments feature amongst a range of motivations to participate in PES schemes, and how do motivations interact with environmental values? (2) What implications do motivations for participation have for the temporal sustainability of PES schemes? I examine these questions using a range of social science methods in a case study of PES in western Uganda, where forest-adjacent communities are paid for planting trees for carbon sequestration.
To address the first question I report on the importance of payments in motivating participation, relative to other motivations, including values for trees in the landscape. The research rests on the premise that values are one factor underpinning motivations. Environmental values are understood through a conventional framework of use (direct, indirect and option values) and non-use (bequest, existence and altruistic values). To investigate the second question a profitability analysis is used to consider the flows of benefits from trees over time, complemented by qualitative research on intentions and norms around tree harvesting. This leads to an empirically-based understanding of temporal sustainability in PES schemes.
Case study: Trees for Global Benefit
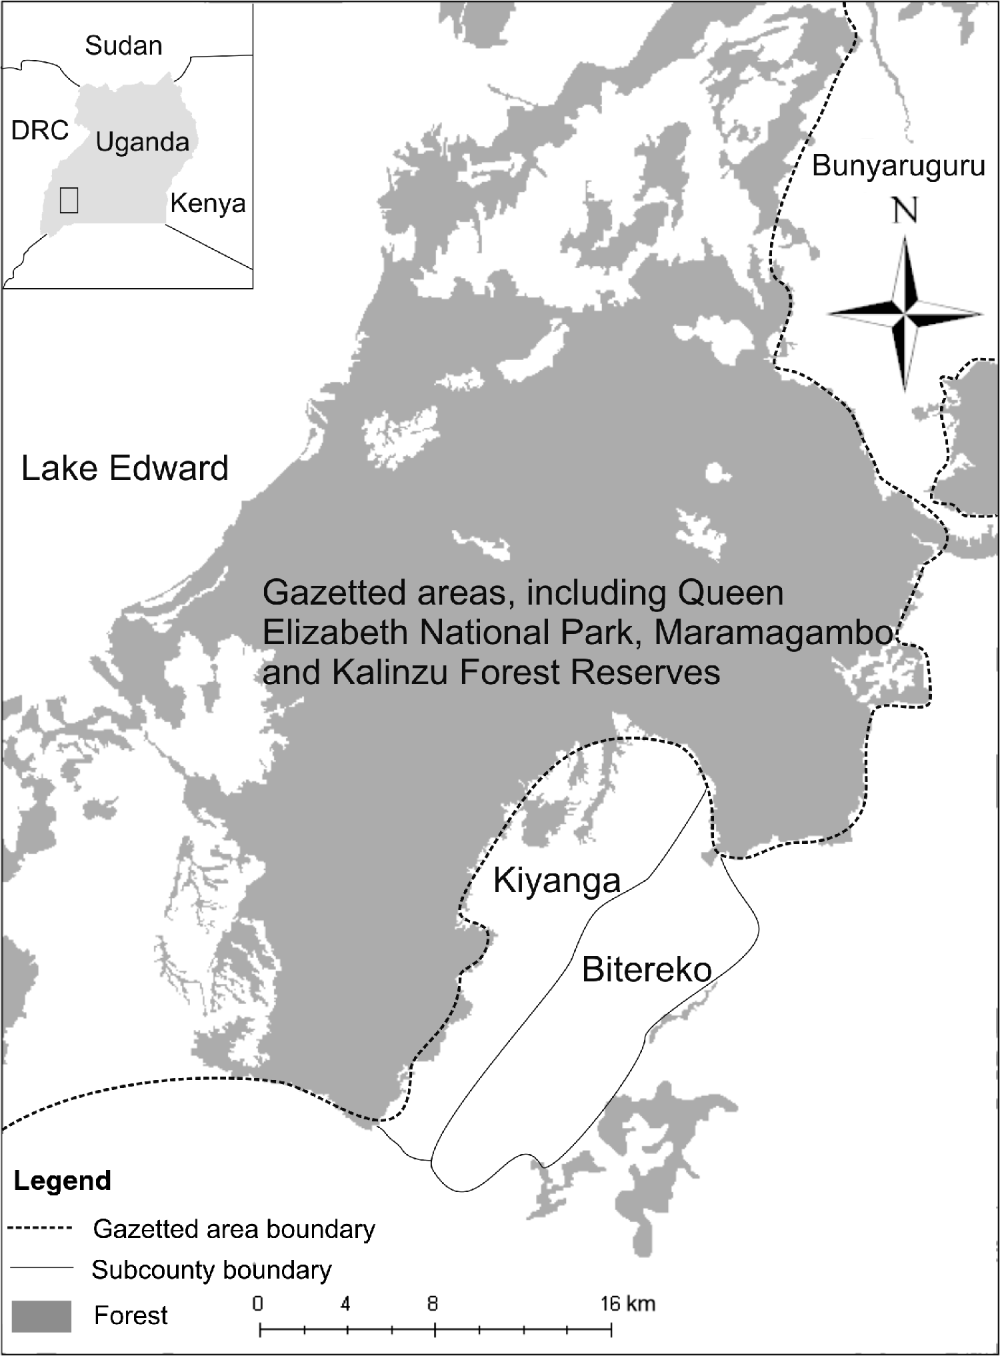
Trees for Global Benefit is a carbon forestry PES scheme in Bushenyi District, western Uganda, in three administrative areas: Bitereko, Kiyanga and Bunyaruguru (Fig. 1). Bushenyi has a relatively high population density, with 208 people per km2 compared to the national average of 124 (Local Government, 2009). In this district typical agricultural land uses are the staple matoke (bananas) and other cash (e.g. coffee, tea, potato) and subsistence crops. Eucalyptus stands are common among the wealthy who tend to have surplus land. Forests comprise 20% of the district area (Local Government, 2009), the majority designated as Central Forest Reserves, managed primarily for conservation. Bunyaruguru borders the access points to Queen Elizabeth National Park, with benefit-sharing arrangements in some communities through the Uganda Wildlife Authority. Although collaborative forest management is being developed in Bunyaruguru, those communities not involved in this have little access to the Park or Forest Reserves, except variable and informal access for collecting firewood. Hence, forests do not play a large part in what are predominantly agricultural livelihoods.
The three administrative areas (Bitereko, Kiyanga and Bunyaruguru) of Bushenyi District where the carbon forestry PES scheme Trees for Global Benefit is taking place, with the location of forests and gazetted areas, including Queen Elizabeth National Park. The rectangle on the inset indicates the location of the main map in western Uganda.
Trees for Global Benefit began in 2002 and is managed by Ecotrust, a Ugandan conservation NGO, using the Plan Vivo system for afforestation carbon (Plan Vivo, 2010a). Participants plant indigenous trees on private land, in woodlots or agroforestry systems. Most non-state land in the region is privately owned, under customary recognition. Intercropping is allowed in early years but not possible after canopy closure. Participants enter into a contract with Ecotrust, also signed by their family. Each participant is allocated a tonnage price of carbon dioxide in USD, from which an administration percentage (typically c. 40%; Ecotrust, 2009) is deducted. Of the remaining sum, a further 10% risk buffer is deducted. Participants are monitored and paid a percentage of the remaining finance according to the targets in Table 1. Project activities are dispersed over a large area and <1% of the resident population participate.
Schedule of percentage payments, and indicative payments in Ugandan Shillings (UGX) and USD, based on a typical 1-ha plantation. Payments are made according to the conditions of the plantation.
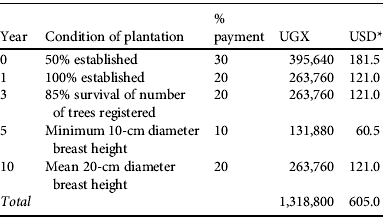
* USD 1=UGX 2,180 (OANDA, 2010)
The project sells ex ante carbon credits that are ‘planned or forecasted but have not yet been achieved’ (Kollmuss et al., Reference Kollmuss, Zink and Polycarp2008; 104). This is common to Plan Vivo projects, the argument being that initial financing is necessary for plantation establishment, and hence necessary for the additionality of the sequestered carbon (Plan Vivo, 2010b). Related to the ex ante arrangements, payments are front-loaded, disbursed in the first 10 years, rather than spread over the contract length of 25 years. At the time of data collection no-one had been participating for >6 years. During the 10-year payment period non-compliance is sanctioned by withholding future payments. Project implementers currently have no plans for sanctioning non-compliance after the 10-year payment period. Timber is the property of the participant. Contracts are heritable and there are examples of land under contract being transacted.
Methods
The research methods used were in-depth interviews, benefit-ranking exercises and economic modelling. The random sample included 81 respondents (43% of total participants), whose characteristics are presented in Table 2. Interviews were conducted with the contract holder, or their spouse in the few cases when the holder was unavailable. A semi-structured interview was used to elicit in-depth perspectives on motivations, environmental values and future perspectives. This means that when proportions of responses are reported, they derive from open questions.
Project participant and research respondent characteristics according to administrative area (Fig. 1) and gender.

* Female contract holders were purposively, rather than randomly, sampled in Kiyanga and Bunyaruguru. As females participate in smaller numbers they would have been poorly represented in a random sample and the research sought to understand gendered dimensions of motivations for participation.
Nearby forests provided a useful basis for asking open questions to elicit expressions of environmental value. Many associations with the forest were similar to those made with trees on farms. Planting trees is also closely associated with environmental stewardship, making perspectives on tree planting a useful entry point to understand values. The research therefore adopted a broad approach to understanding perspectives towards trees in the landscape, in forests and on farms. To understand questions associated with temporal sustainability and the lifespan of trees, interviews incorporated scenario questions about strategies respondents would use if they needed cash urgently.
Ranking exercises were used as a method to derive ordinally ranked quantitative data that could be triangulated against qualitative information to understand the importance of money in relation to other benefits of project participation that accrue to the household. Focus groups were used to establish a list of benefits of participation at the household level: beauty of the environment (partly accruing at the household, partly a public good), ‘carbon money’, control of soil erosion, firewood, fruits, manure (specifically, that leaves of trees contribute nutrients to the soil), medicine, poles, shade, timber and windbreaks.
Respondents were asked to rank cards (in Runyankore, the local language) in response to the instruction ‘please rank these factors according to their importance in why you joined the project’. Each respondent who had received at least one payment (56 in total) completed a benefit-ranking exercise. Some new participants had not received payment because of administrative delays. To investigate the importance of money as a motivation it would not have been legitimate to compare the benefit-ranking exercises of those who had with those who had not been paid. For analysis, these data are disaggregated into groups based on administrative area, gender and wealth (derived from an index based on 12 indicators; Fisher, Reference Fisher2011). To test the significance of the differences in median ranking between respondents grouped on the basis of area, gender and wealth, I used the Kruskal-Wallis test. This test is the non-parametric equivalent of the ANOVA, applicable to data derived from an ordinal ranking exercise.
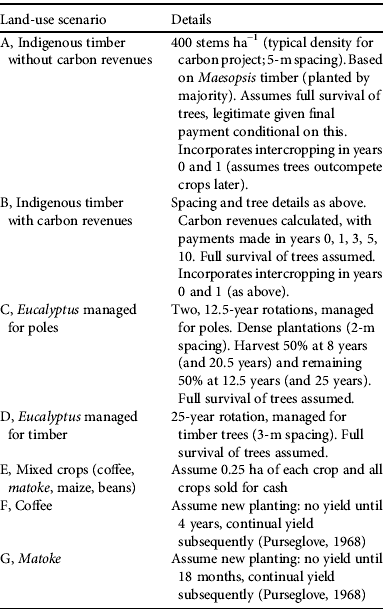
Economic modelling to understand profitability builds on work by Owen (Reference Owen2003) at the inception of the project. Seven typical land-use scenarios are modelled with different combinations of trees and crops, for a hypothetical hectare of land, over 25 years (commensurate with the PES contract). Scenarios are detailed in Table 3. Input costs (variable according to land use) and revenues of harvests were used to model cash flow each year, using Owen's figures, corroborated with data from focus groups. Harvest costs of crops are absorbed by the farmer and that of timber are absorbed by the buyer. Inherent simplifications include no account being taken of variability in yields (e.g. environmental factors) or variability in price (e.g. microeconomic factors). Discount rates (the percentage rate by which the value of a cash flow is reduced for each time period by which it is removed from the present) were applied to cash flow figures to calculate a net present value (NPV) for each land-use scenario. Because discount rates are subjective, and related to wealth (Lumley, Reference Lumley1997), four rates are used (5, 10, 15 and 25%), from which sensitivity to discounting can be established. This modelling exercise is intended to be heuristic, yielding indicative rather than precise values.
Seven land-use scenarios in the profitability modelling exercise, with details of each scenario.
Results
Environmental values and trees in the landscape
In response to open questions eliciting perspectives on trees in the landscape c. 75% of respondents made associations between trees and ecosystem services, particularly rainfall, soil fertility, fresh air and shade. Most commonly, trees are thought to bring localized rain and they are highly valued accordingly. Soil fertility was also highly valued, associated with land bordering the forest, or with indigenous trees on farms. Although not as prevalent as these use values, respondents also expressed non-use existence and bequeath values. A few respondents talked about being enriched near the forest, enjoying seeing trees ‘swaying in the wind’ or charismatic mammals. Some advocated the reservation of a place for nature, separate from humans, or perceived a creation value in nature. Most prevalent amongst expressions of non-use values, however, was the sense that forest protection and trees on farms have bequeath value, to secure Uganda's natural heritage and sufficient rainfall for future generations.
Despite these positive perspectives about trees, a quarter of interviews contained the sense that conditions were worse with higher forest cover, associated with a poorer and more isolated past. Further negative associations were made with crop-raiding, a major source of discontent and loss of livelihood for forest-adjacent communities. These positive and negative, and use and non-use, environmental values provide the context within which motivations for participating in a tree-planting PES scheme can be understood.
Understanding motivations to participate in the project
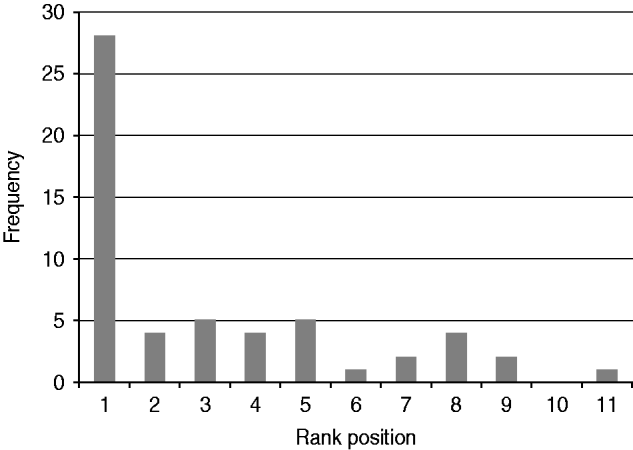
Table 4 shows that payment (carbon money) is the benefit with the highest median ranking and therefore forms the most important direct motivation. Fig. 2 shows that carbon money was ranked first by 28/56 (50%) of respondents who had been paid. Evidence that corroborates the ranking is the fact that few are growing non-fruit indigenous trees other than through involvement in the project, suggesting that without payment growing indigenous trees is financially inviable. Similarly, c. 60% of interviews highlighted the importance of the payment.
Frequency with which carbon money appears in each rank position in the ranking exercise that measures the relative importance of benefits of PES participation (n=56).
Benefits of project participation ranked according to median rank for whole dataset (n=56).
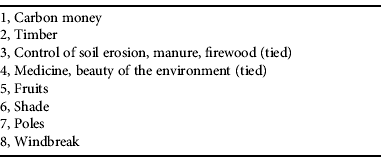
People do have other uses for trees beyond carbon money, and the importance of these varies with differences in local environmental factors and access to the forest. In all communities, to varying extents, there was a shortage of timber and wood products and these were a significant motivation for participants, with timber ranked second overall (Table 4). There were also important motivations in the land improvement benefits of indigenous trees, for soil productivity, structure and to mitigate soil erosion (ranked third).
Social factors also motivate involvement. A legacy of interventions in the area, dating from the colonial era, have encouraged tree planting (Carswell, Reference Carswell, Beinart and McGregor2003). The influence of environmental leadership is also clear; local project advocates are a source of environmental information and encouragement. Participants are also clustered, suggesting that people are prompted by neighbours to change land use. Furthermore, where the project has used existing groups such as women's associations, participation has spread from peer to peer.
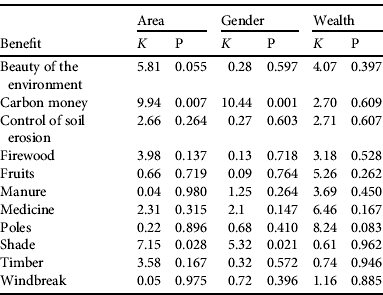
Disaggregrating the ranked data spatially demonstrates differences between Bunyaruguru and the other two administrative areas, in which ranking results were similar (Table 5). Carbon money is ranked lower in Bunyaruguru. The Kruskal–Wallis test (Table 6) shows that this result is statistically significant: people in Bunyaruguru are significantly less motivated by payment. The higher placement of beauty of the environment in Bunyaruguru fell just short of statistical significance. This difference in motivations points to different mediators of environmental value in Bunyaruguru, something also evident in qualitative data: of nine instances of the expression of existence values for trees, eight were from Bunyaruguru.
Benefits of project participation, ranked according to median rank in Bunyaruguru compared with median rank of combined data from Bitereko and Kiyanga.
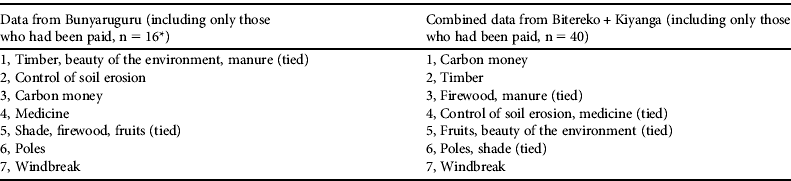
* This is a relatively small sample size, although the Kruskal–Wallis statistical test returns significant results (Table 6). If those who had not been paid are included (n=25) beauty of the environment remains in the same place but carbon money is lower, although still significantly different from comparable data in Bitereko and Kiyanga.
Results of Kruskal–Wallis test (K) for significance of differences between groups based on administrative area, gender and wealth in the ranking of benefits of project participation. K and P refer to the effect of area, gender and wealth on the median rankings for each grouping. In the case of a statistically significant P value (⩽0.05) one infers which group is statistically significantly different from the sample by comparing the median rankings of different groups.
Analysing profitability
Given the importance of money in motivating participation it is of interest to consider how participants assess the monetary costs and benefits of participation, i.e. profitability. To frame the profitability modelling I present firstly some analysis of participants’ economic rationale. Most individuals are neither profit-maximising nor making rigorous calculations about the profitability of land use over time. Only 11% of participants reported calculating the profitability of the carbon strategy compared to other land uses. A much higher percentage (43%) reported that although they hadn't calculated anything, they were motivated by the future benefits of the project, often citing timber. The remainder (46%) said they had made no calculation, just planted. Ecotrust is an established and trusted NGO in these communities and respondents sometimes conveyed the assumption that Trees for Global Benefit is a benevolent development project whose activities are necessarily beneficial.
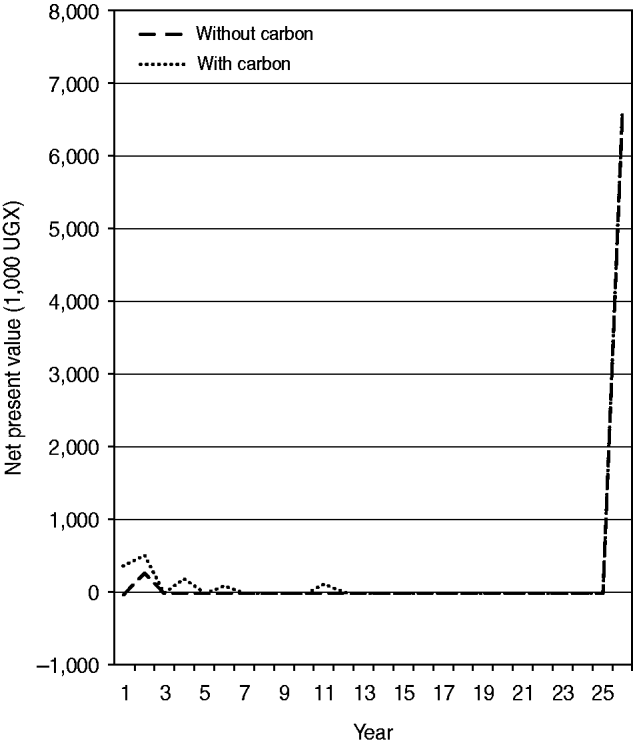
Wider observational and experimental economics evidence (e.g. Frank, Reference Frank1987; Pattanayak et al., Reference Pattanayak, Wunder and Ferraro2010) render untenable the assumption that people act rationally to maximize profit. Given this, and the results reported above, the profitability analysis is not presented here as if it resembles most participants' rationale. Yet it remains one part of understanding motivation, and opens up important questions around benefit flows over time, useful to understand the second research question. I first consider the impact of carbon revenues on planting timber trees. A discount rate of 10% returns a 15% increase in net present value (Table 7); i.e. growing indigenous timber is 15% more profitable with carbon revenues. This is a relatively modest increase, and the minor scale of carbon to timber revenues, even expressed as NPV (timber discounted) is clear from Fig. 3. However, in prioritizing the carbon money many appear to consider that carbon revenue raises the profitability more highly, suggesting they discount the future at a rate exceeding 10%. Table 7 demonstrates a general point that high returns in the distant future make the timber scenarios very sensitive to discounting. Under high discount rates, front-loaded carbon revenues balance favourably against future timber revenues. I reflect below on the relationship between poverty and discounting.
Net present value of indigenous timber scenarios (without and with carbon revenues) with a discount rate of 10% over 25 years.
Profitability (in 1,000s of UGX, where 2,180 UGX=USD 1; OANDA, 2010) of the seven land-use scenarios (Table 3) under discount rates of 5, 10, 15 and 25%. All values are in net present value for 1 ha for a period of 25 years. Numbered ranking in square brackets indicates the descending profitability of the seven land-use scenarios.
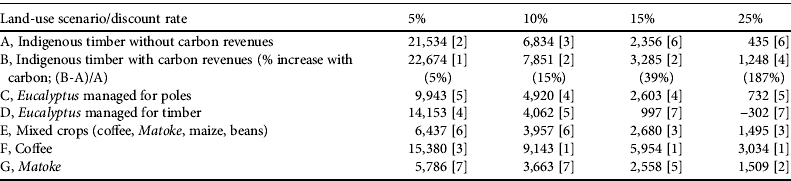
Considering the relative profitability of different land uses, represented by the numbered ranking (square brackets in Table 7), coffee is the most profitable under anything but a 5% discount rate. This is well triangulated with observations that many grow coffee, and a third report coffee as their most profitable land use. Yet in this analysis carbon trees are the most profitable strategy under a very low (5%) discount rate, and are relatively profitable under 10 and 15% rates. Hence, for those who can overcome barriers to entry, and those who do not discount the future too highly, growing trees for carbon sequestration provides a relatively profitable alternative. This alternative is particularly attractive on steep land, or because of crop failure (mentioned by 1/5 of respondents). Clearly, there is also value in diversifying land use and reducing risk exposure.
How do people consider the future?
The profitability analysis raises questions regarding how participants evaluate the future. Indigenous trees are viewed as an investment but nobody grows them other than through involvement in the project. Many reported that the time-scales are too long, and this view is shared by local forestry officials and Owen (Reference Owen2003).
A few respondents object that Trees for Global Benefit governs their land use for 25 years and are concerned about passing contractual obligations to their children. In contrast, 16% of interviews conveyed an appreciation of the way Trees for Global Benefit encourages planning on longer time-scales than other programmes such as agricultural extension. Nearly a third talked unprompted about being motivated partly because they saw future timber revenues as insurance and a valuable inheritance for their children.
When asked how long they intend to keep the trees, most respondents stated c. 25 years but there is confusion about the contract length. Broader community norms give insight into harvesting time-scales. Approximately half report that trees are often harvested prematurely, particularly Eucalyptus, which is seen as a renewable resource. Respondents often associated harvesting with necessity, saying it tended to be prompted by urgent requirements for building materials or money. A fifth reported a community perception that it is foolish to harvest early but there is a strong sense of individual responsibility over private land, which was presented by respondents as overriding community land management norms.
In response to questions about strategies if money is urgently required, participants talked of liquidating livestock or land assets, or loaning money through social networks. They also mentioned harvesting trees, saying these could be liquidized quickly. Despite this being a sensitive matter, which may not be expected to be reported in an interview, two respondents talked of their strategic engagement with the project, planning to break the contract and harvest trees if a more lucrative option became available.
Discussion
I used a diverse and novel combination of methods to consider questions of how motivations for participation in a PES scheme relates to environmental values, and in turn what this means for temporal sustainability of PES schemes. I now review the empirical findings and reflect on their implications, including for implementation. One lesson relates to mismatches between time-scales and payments, and another to the potential advantages of PES within a suite of interventions.
In Bushenyi District most respondents conveyed strong perceived benefits of trees in the landscape, relating to rainfall generation, cooler microclimates, soil fertility and tree products. Some non-use environmental values were also expressed, particularly in Bunyaruguru. All of these provide motivations for participation in a tree-planting PES scheme in addition to social motivations and collective perceived benefits of the presence of a project. However, at the household level, payments are clearly the highest motivation in Bitereko and Kiyanga. This is not a surprising finding. Part of the rationale for PES is the power that payments are likely to have for rural people in the tropics (Ferraro, Reference Ferraro2001). However, payments appear to be particularly appealing when made at a household level; money was apparently less important in cases with collective payments (Kosoy et al., Reference Kosoy, Martinez-Tuna, Muradian and Martinez-Alier2007; Sommerville et al., Reference Sommerville, Milner-Gulland, Rahajaharison and Jones2010; Van Hecken & Bastiaensen, Reference Van Hecken and Bastiaensen2010). Hence, these findings have greatest relevance for PES schemes using individual payments on private lands.
The way in which payments generally dominate other motivations raises questions of temporal sustainability, particularly given that payments last 10 years and contracts 25 years. Many are motivated to participate by a desire to build an inheritance for their children. Yet there is a danger, demonstrated by the economic modelling, that front-loaded payments provide a lure to participate when the contract may not be advantageous if the future is discounted. In particular, poorer participants, with higher discount rates (Lumley, Reference Lumley1997; but see also Moseley, Reference Moseley2001), will tend to prioritize carbon revenues, whether or not time-scales of timber returns are advantageous for them. This is of concern for the 20% of participants who are relatively poor (Fisher, Reference Fisher2011). More broadly, however, front-loading has implications for temporal sustainability. Trees are regularly harvested prematurely in Bushenyi and respondents clearly link tree lifespans to the household asset portfolio. The implementer has limited power of sanction beyond 10 years, and there is a 15-year period in which there are no monetary benefits from the trees and few other benefits. It would therefore seem reasonable to conclude that the age of tree harvest will relate closely to the dynamics of the local timber market as well as household livelihood stability. The uncertainty surrounding the trees is compounded by exogenous drivers of land use and microeconomic change, including the planned exploitation of oil in the Albertine Rift and population growth and associated land shortage. Whilst intangibles such as these could affect any intervention, they highlight particular questions about the wisdom of PES based on ex ante payments and long contracts. In response to questions about the sustainability of the payment/contract mismatch, implementers tend to assume that the money is not a significant motivation for participants (Nantongo, Reference Nantongo2008; Plan Vivo 2010c; JF, unpubl. data). However, this research challenges that assumption.
A clear argument emerges for designing payment systems in synchrony with ecosystem service provision. This also presents to participants a more realistic appraisal of the profitability of the strategy, without front-loaded incentives. This is particularly important given that this, and other research (Kosoy et al., Reference Kosoy, Corbera and Brown2008), show that participants in PES schemes do not necessarily consider the suitability of their involvement and may participate for a variety of reasons, including trust in the implementer. Synchronizing payments with ecosystem service provision would also mean that unrealistic time-scales of obligations are not conferred on participants in areas of the world with relatively high social and environmental dynamism. This is a key challenge for policies designed for reducing emissions from deforestation and degradation.
Whilst payments have been shown to be a very important motivation generally, this is less so in Bunyaruguru. Ranked and qualitative data from Bunyaruguru show that people are less motivated by money and more likely to express non-use environmental values and aesthetic preferences for trees in the landscape. As such, there are indications that project trees may be maintained for longer in Bunyaruguru. These evident differences in Bunyaruguru could be explained by physical or institutional characteristics or average wealth.
Bunyaruguru has a more forested landscape than the other two areas (Fig. 1) and people there are generally closer to forests, especially compared to Bitereko. This could explain why they are more disposed towards trees; perhaps, for example, they see more ecosystem service benefits. In addition, the long-standing presence of Queen Elizabeth National Park may have led to a higher degree of environmental pride in the area, perhaps reinforced by tourism and benefit-sharing. Collaborative forest management is taking place in Bunyaruguru but it would be difficult to argue that this is a major influence as it involves few communities and had been happening for <3 years. However, wider evidence does suggest that collaborative forest management fosters ownership and motivations for protection (Chhatre & Agrawal, Reference Chhatre and Agrawal2009).
It is plausible that wealthier respondents are more likely to express non-use environmental values (Inglehart, Reference Inglehart1995), and possible that wealth differences lie behind results from Bunyaruguru. However, the Kruskal–Wallis test showed no significant effects of wealth on the rankings of any benefit (Table 7). This may well be because there are few comparatively poor project participants. Furthermore, participants in Bunyaruguru are of comparable mean wealth to participants in Bitereko, with both areas wealthier than Kiyanga (Fisher, Reference Fisher2011). Differences between Bunyaruguru and Bitereko could not therefore be explained by wealth. Hence, wealth is tentatively discounted as a factor but it is likely that the explanation lies in the interplay between the proximity of the forest and the institutional arrangements of the Park and collaborative forest management.
This case study therefore suggests that communities with higher non-use environmental values may not prioritize incentives so highly. According to the PES logic of efficiency this means that the incentive is not well targeted, as participants may undertake the activity with less or no payment (cf. Wunder, Reference Wunder2007). However, another implication is that PES within a suite of interventions (e.g. collaborative forest management and engagement with a protected area, as in the case of Bunyaruguru) could lead to a more temporally sustainable set of environmental motivations. Petheram & Campbell (Reference Petheram and Campbell2010) advocated this model of PES within a suite of interventions and Clements et al. (Reference Clements, John, Nielsen, An, Tan and Milner-Gulland2010) showed that integrated PES interventions may be more enduring.
A significant part of the appeal of PES is the potential for sustainable finance, dubbed the ‘Holy Grail’ by Ferraro & Kiss (Reference Ferraro and Kiss2002). Yet, my findings demonstrate empirical evidence for concerns about ‘no pay, no care’ (Swart, Reference Swart2003), showing that PES may be less temporally sustainable than more integrated interventions unless payments are maintained in perpetuity, which is an unrealistic expectation. Discussions of temporal sustainability in PES have thus far remained partial and speculative. By exploring the limitations of payments in a substantive way, I hope this article will stimulate discussion and further research about the legacy of values and motivations that payments leave in their wake.
Acknowledgements
I thank the research participants in Bushenyi District, who welcomed me into their communities and answered many questions, and my hard-working research assistants. The research was completed within the Natural Resources and Environment group, School of International Development at the University of East Anglia, UK, where I am particularly grateful for the help of Professor Katrina Brown and Dr Adrian Martin. This work benefited greatly from the comments of two anonymous referees, and feedback at the International Congress for Conservation Biology, Edmonton, Canada, July 2010. Any errors, omissions and opinions remain my responsibility. This paper draws on research conducted as part of an ESRC Research Studentship (Award No: PTA-031-2006-00168).
Biographical sketch
Janet Fisher is an environmental social scientist with an interest in the interface between conservation, climate change and development. Her recent work focuses on PES in forest ecosystems. She is interested in the use of PES as a way to integrate conservation and development and, in particular, the implications of conditional interventions and monetary incentives.



