


Non-technical Summary
The fossil record provides valuable insight into how plant communities responded to past disturbances. However, it is challenging to use fossil leaves for these reconstructions because there is limited information about how leaves change in plant communities following a disturbance. This includes differences in how plants invest resources in their leaves and in their leaf morphology. Finally, some methods that use fossil leaf morphology to reconstruct ancient climate may be negatively impacted by changes in leaf morphology caused by disturbance.
In this study, we analyzed forests in North Carolina that varied in how long since they had been logged. We analyzed leaf investment strategies, morphology, and chemistry in each forest. We found that trees growing shortly after disturbance, compared with those growing in older forests, had thinner and less dense leaves, typical for plants that prioritize providing resources for photosynthetic machinery. Although these traits cannot be measured in fossil leaves, the petiole metric, which can be measured, related to measures of investment across forest communities. In addition, trees growing shortly after a disturbance more often had toothed leaves and the leaves of the most abundant trees were less often lobed—although determining which trees are most abundant from fossil leaves in a similar manner is difficult. We also found that old-growth forests were more varied in morphology, chemistry, and resource investment strategies across all plant types, which reflects their greater complexity. Among trees, however, these measures varied more in intermediate stages of regrowth, which included a mix of trees typical of early or late stages of regrowth. Changes in leaf morphology did not strongly impact the accuracy of leaf morphology based paleoclimate method. This study highlights leaf characteristics that can help us better understand how forests recover after disturbances, providing useful information for using fossil leaves to interpret ancient ecology and climate.
Introduction
The fossil record offers important examples of how plant communities respond to environmental perturbations ranging from relatively local (e.g., flooding; fire volcanic eruption; Currano et al. Reference Currano, Jacobs, Pan and Tabor2011; Lowe et al. Reference Lowe, Greenwood, West, Galloway, Sudermann and Reichgelt2018) to global disturbances (e.g., mass extinction; Lyson et al. Reference Lyson, Miller, Bercovici, Weissenburger, Fuentes, Clyde and Hagadorn2019; Stiles et al. Reference Stiles, Wilf, Iglesias, Gandolfo and Cúneo2020). Such examples help disentangle the complexity of plant community assembly dynamics and aid in providing more informed predictions of anthropogenic impacts. In addition, understanding successional dynamics of paleovegetation may be important for paleoclimate inference, as certain successional stages (“climax vegetation”) are thought to be in greater equilibrium with macroclimate than others (e.g., Taggart and Cross Reference Taggart, Cross, Lockley and Rice1990; Schiller et al. Reference Schiller, Lowe, Dillhoff, Fields, Taggart, Schmitz and Strömberg2024). Recognizing disturbance as a driving force in paleovegetation dynamics requires an understanding of how disturbance impacts the functional composition and diversity of plant communities in various vegetation and climate types today.
A general model of vegetation succession in non-arid climates posits that high light availability following a disturbance favors the establishment of ecological strategies intolerant of shade that prioritize fast resource acquisition and growth. These strategies are eventually replaced by slower-growing, shade-tolerant competitors (Bazzaz Reference Bazzaz1979; Poorter et al. Reference Poorter, van der Sande, Amissah, Bongers, Hordijk, Kok, Laurance, Martínez‐Ramos, Matsuo and Meave2024). Plant functional traits offer important insights to these ecological strategies by directly influencing plant fitness (Grime Reference Grime2006; Enquist et al. Reference Enquist, Norberg, Bonser, Violle, Webb, Henderson, Sloat, Savage, Pawar, Woodward and Dell2015; Funk et al. Reference Funk, Larson, Ames, Butterfield, Cavender‐Bares, Firn, Laughlin, Sutton‐Grier, Williams and Wright2017), providing important opportunity for paleoecological studies (McElwain et al. Reference McElwain, Matthaeus, Barbosa, Chondrogiannis, O’ Dea, Jackson and Knetge2024). However, many traits linked by plant neo-ecologists to ecological strategy are impossible or difficult to directly measure from fossil plants (e.g., assimilation rates, nitrogen concentrations).
Nevertheless, previous work suggests that traits measurable in the fossil plant record can be reflective of ecological strategy and successional dynamics, including leaf morphology, leaf carbon isotopes, leaf mass per area (LMA) (through proxy reconstruction), plant diversity, and leaf herbivore damage (e.g., Currano et al. Reference Currano, Jacobs, Pan and Tabor2011; Resco et al. Reference Resco, Ferrio, Carreira, Calvo, Casals, Ferrero-Serrano and Marcos2011). For example, early successional communities in wet tropical forests have been shown to have a greater proportion of species with toothed and lobed leaves compared with late succession (Kappelle and Leal Reference Kappelle and Leal1996), and toothed leaves are associated with lower LMA than untoothed leaves (Royer et al. Reference Royer, Peppe, Wheeler and Niinemets2012), suggesting links between leaf teeth/lobes and rapid growth strategies. However, there is a dearth of empirical evidence across succession in other vegetation types, including temperate deciduous forests, particularly at the community scale (Currano et al. Reference Currano, Jacobs, Pan and Tabor2011). Successional patterns of quantitative leaf morphology traits have not been well explored, including the size and frequency of teeth, leaf circularity, and leaf area. Understanding whether leaf morphology does in fact vary across succession is important not just for tracking ecological strategies, but also to assess to what extent disturbance confounds relationships of leaf morphology and climate that form the basis for paleoclimate proxies such as digital leaf physiognomy (Peppe et al. Reference Peppe, Royer, Cariglino, Oliver, Newman, Leight and Enikolopov2011). This potential impact of disturbance on paleoclimate estimates has been minimally tested.
In addition to morphological traits, leaf carbon stable isotopic ratios (δ13C) can be measured on fossil leaf compressions and cuticle and may provide insight to ecological strategy during succession (Resco et al. Reference Resco, Ferrio, Carreira, Calvo, Casals, Ferrero-Serrano and Marcos2011). Leaf δ13C reflects the ratio of intercellular to ambient CO2 concentrations (c i/c a) and the δ13C of ambient CO2 surrounding the leaf (Farquhar et al. Reference Farquhar, O’Leary and Berry1982). For example, relative to shaded understory leaves, sunlit and upper canopy leaves typically have higher δ13C, as higher photosynthetic rates draw down c i/c a with higher water use efficiency, and ambient CO2 is influenced less by the lower δ13C of soil-respired CO2 (Da Silveira et al. Reference Da Silveira, Sternberg, Mulkey and Wright1989; Graham et al. Reference Graham, Patzkowsky, Wing, Parker, Fogel and Freeman2014; Cheesman et al. Reference Cheesman, Duff, Hill, Cernusak and McInerney2020; Milligan et al. Reference Milligan, Flynn, Wagner, Kouwenberg, Barclay, Byars, Dunn, White, Zechmann and Peppe2021). As a result, stronger vertical gradients of leaf δ13C characterize more structurally complex and closed forests. Thus, variation in photosynthetic rates and forest structure throughout succession may drive variation in the mean and variance of leaf δ13C in a plant community (e.g., Garten and Taylor Reference Garten and Taylor1992; Graham et al. Reference Graham, Patzkowsky, Wing, Parker, Fogel and Freeman2014; Cheesman et al. Reference Cheesman, Duff, Hill, Cernusak and McInerney2020; Milligan et al. Reference Milligan, Flynn, Wagner, Kouwenberg, Barclay, Byars, Dunn, White, Zechmann and Peppe2021) and provide important opportunity for reconstructions of successional status.
LMA has also been suggested as a useful trait in characterizing ecological strategy across succession (Currano et al. Reference Currano, Jacobs, Pan and Tabor2011; Lichstein et al. Reference Lichstein, Peterson, Langebrake and McKinley2021). Although LMA cannot be measured directly on fossil leaves, it can be reconstructed for woody non-monocot angiosperms (WNMAs) at the species and community scale using its relationship with the petiole metric (PM = petiole width2/leaf area) (Royer et al. Reference Royer, Sack, Wilf, Lusk, Jordan, Niinemets and Wright2007, Reference Royer, Miller, Peppe and Hickey2010; Lowe et al. Reference Lowe, Royer, Wieczynski, Butrim, Reichgelt, Azevedo-Schmidt, Peppe, Enquist and Strömberg2025). LMA is a component of the leaf economic spectrum (LES), which describes covariation of leaf traits relating to resource acquisition and investment (Wright et al. Reference Wright, Reich, Westoby, Ackerly, Baruch, Bongers and Cavender-Bares2004; Reich Reference Reich2014; Onoda et al. Reference Onoda, Wright, Evans, Hikosaka, Kitajima, Niinemets, Poorter, Tosens and Westoby2017). The LES is hypothesized to play a role in successional dynamics, with, for example, early successional shade-intolerant plants having traits that confer fast resource acquisition through greater investment in low-density photosynthetic enzymes and lower resistance to within-leaf CO2 flux (e.g., low LMA, high nitrogen concentration). In contrast, late successional plants are characterized by traits that confer shade tolerance and resource retention (e.g., high LMA, low nitrogen concentration) (Wright et al. Reference Wright, Reich, Westoby, Ackerly, Baruch, Bongers and Cavender-Bares2004; Poorter and Bongers Reference Poorter and Bongers2006; Onoda et al. Reference Onoda, Wright, Evans, Hikosaka, Kitajima, Niinemets, Poorter, Tosens and Westoby2017; Falster et al. Reference Falster, Duursma and FitzJohn2018; Lichstein et al. Reference Lichstein, Peterson, Langebrake and McKinley2021; Poorter et al. Reference Poorter, van der Sande, Amissah, Bongers, Hordijk, Kok, Laurance, Martínez‐Ramos, Matsuo and Meave2024).
However, the role of the LES in successional dynamics of deciduous-dominated humid forests is unclear, as shade-tolerant deciduous trees have repeatedly been shown to have lower LMA than shade-intolerant trees (Niinemets and Kull Reference Niinemets and Kull1994; Niinemets et al. Reference Niinemets, Kull and Tenhunen1998; Aranda et al. Reference Aranda, Pardo, Gil and Pardos2004; Hallik et al. Reference Hallik, Niinemets and Wright2009). This uncertainty may be explained by the complicating influence of leaf thickness—shade tolerance can be conferred by constructing large but thin leaves that maximize light interception and prevent within-leaf intracellular shading (Niinemets and Kull Reference Niinemets and Kull1994; Green and Kruger Reference Green and Kruger2001). In addition, the covariation of traits defining the LES is less pronounced among deciduous species (Wright et al. Reference Wright, Reich, Westoby, Ackerly, Baruch, Bongers and Cavender-Bares2004), due in part to low variation in their leaf life span. Thus, resolving whether the LES and reconstructions of LMA are useful in reconstructing successional dynamics in deciduous-dominated forests requires direct testing using data on leaf traits related to the LES (e.g., LMA, leaf thickness and density, C:N) measured in situ for plant communities across successional gradients.
Finally, much work has addressed patterns of plant diversity across succession. Often, species and functional diversity increase across succession as stronger filtering that selects for a narrow set of pioneer species gives way to greater structural and abiotic complexity and niche differentiation (Currano et al. Reference Currano, Jacobs, Pan and Tabor2011; Poorter et al. Reference Poorter, van der Sande, Amissah, Bongers, Hordijk, Kok, Laurance, Martínez‐Ramos, Matsuo and Meave2024). However, alternative patterns are possible, including that diversity is highest in mid-succession where varying ecological strategies coexist (e.g., Connell Reference Connell1978) or that late successional forests are dominated by just a few strongly competitive tree species (Doyle Reference Doyle, West, Shugart and Botkin1981; Keddy and Drummond Reference Keddy and Drummond1996). As discussed earlier, traits incorporated into measures of functional diversity by neo-ecologists are often not available in the fossil record. Leaf morphological diversity has been assessed in fossil leaf assemblages (e.g., Stiles et al. Reference Stiles, Wilf, Iglesias, Gandolfo and Cúneo2020), and while its relationship to climate has been explored (Butrim et al. Reference Butrim, Lowe and Currano2024a; Roth-Nebelsick and Traiser Reference Roth-Nebelsick and Traiser2024), its relationship to functional diversity (assessed using neo-ecological traits) and species diversity has not been greatly explored.
To aid in more reliable interpretations of ecological strategy and successional dynamics from fossil leaf assemblages sourced from temperate deciduous forests, we analyze in situ, community-scale, WNMA leaf traits across a successional gradient in western North Carolina, USA. We utilize a chronosequence (i.e., space-for-time substitution) spanning various stages of secondary succession following disturbance by logging. This study is the first, to our knowledge, to provide quantitative morphological measures of leaves sampled in situ and at the community scale across a local chronosequence. Specifically, we test:
-
1. The role of the LES across succession in temperate deciduous forests. We hypothesize that LMA will increase through succession and that there will be a stronger correlation of LMA with leaf density (approximated by leaf dry matter content [LDMC]) and carbon and nitrogen investment (C:N) than with leaf thickness. We also test for changes in species composition and their reported shade tolerance.
-
2. Whether and how leaf morphology, δ13C, and diversity change across succession. We hypothesize that the PM will follow patterns in LMA and that early succession will be characterized by more species with toothed and lobed leaves, consistent with patterns shown in tropical wet forests. We also hypothesize that species, functional, and morphological diversity will increase through succession, as strong filtering gives way to niche differentiation, and that high photosynthetic rates in early succession lead to lower c i/c a and thus higher δ13C. Furthermore, we test for patterns in several additional quantitative leaf morphological traits, including the size and frequency of teeth, leaf circularity, and leaf area.
-
3. Whether disturbance constitutes a confounding effect in paleoclimate reconstructions by comparing mean annual temperature (MAT) and precipitation (MAP) estimates to true site climate across the chronosequence using the digital leaf physiognomy proxy.
Materials and Methods
As a clarification of terminology in this study, “sites” occur at the regional-landscape scale, “stands” occur within sites at the patch scale and represent various successional stages, and “plots” are measurable units of the stand (e.g., Poorter et al. Reference Poorter, van der Sande, Amissah, Bongers, Hordijk, Kok, Laurance, Martínez‐Ramos, Matsuo and Meave2024).
Study Site
The study site is in western North Carolina, USA, in the Nantahala National Forest, and is in a region of mixed cove hardwood (i.e., mixed mesophytic), northern hardwood, oak, and oak–pine communities (Miniat et al. Reference Miniat, Oishi, Bolstad, Jackson, Liu, Love, Pringle, Solomon and Wurzburger2021). We incorporated four of the five chronosequence stands studied by Brantley et al. (Reference Brantley, Miniat and Bolstad2019), which were selected based on similar climate, soil, and local setting, with the greatest distance between any stand being ~30 km. At the time of sampling in 2021, these stands were 21, 44, and 94 years old (YO) following known logging activity, with a previously unharvested old-growth stand with many trees >200 YO. Due to access issues, we replaced the youngest stand of Brantley et al. (Reference Brantley, Miniat and Bolstad2019) with a separate 4 YO stand. The 4 YO stand was clear-cut, the 21 YO stand represents shelterwood harvest, the 44 YO stand was clear-cut, and the 94 YO stand was stump-cut, removing all merchantable timber (Elliott and Swank Reference Elliott and Swank2008), all of which impart secondary succession. The site is characterized by a humid temperate climate, with MAT ranging from 12.8°C at lower elevations (~700 m asl) to 10.8°C at the slightly higher-elevation old-growth stand (~1150 m asl), and MAP from ~180 to ~260 cm/yr depending on elevation (Miniat et al. Reference Miniat, Oishi, Bolstad, Jackson, Liu, Love, Pringle, Solomon and Wurzburger2021).
Plot Census and Leaf Sampling
Plots were established by prior work (see Miniat et al. Reference Miniat, Oishi, Bolstad, Jackson, Liu, Love, Pringle, Solomon and Wurzburger2021), including two 20 × 40 m plots (0.16 ha total) at each of the 21 YO, 44 YO, and old-growth (>200 YO) stands, and four 25 × 25 m plots at the 94 YO stand (0.25 ha total) (plot images in Supplementary Appendix 1). Previous work in 2012 had identified every tree (≥10 cm diameter at breast height [DBH]) in each plot to species (Brantley et al. Reference Brantley, Miniat and Bolstad2019), with one exception being trees identified to Carya spp. During the time of sampling in 2021, tree DBH was remeasured, incorporating new individuals that had since grown into the ≥10 cm DBH size class, and species identifications were confirmed and, in rare cases, revised. Given the very thick undergrowth at the 4 YO stand, sampling was not done within a defined plot dimension, although the area covered was ~0.1 ha. At the 4 YO stand, no individuals had ≥10 cm DBH; instead, every woody plant species encountered was sampled (dominant plants were Liriodendron tulipifera and Robinia pseudoacacia, which were ~2.5 m in height and <3 cm DBH).
Leaves were sampled from all WNMA tree species ≥10 cm DBH in each stand. In addition, prominent woody species restricted to the understory (as judged by careful observation) were sampled at each stand. One individual was sampled for each species–stand pair. To represent traits of the individual most successful in acquiring resources and assimilating biomass, we targeted the largest individual (greatest DBH), but successively smaller individuals were considered if sampling the largest was not possible. In several cases, we did not identify understory plants to species, but instead to leaf morphotypes (Ellis et al. Reference Ellis, Daly, Hickey, Johnson, Mitchell, Wilf and Wing2009), which were compared carefully across stands. Sunlit leaves were sampled from canopy trees and shaded leaves from understory plants using either an arborist throw-line launcher (Youngentob et al. Reference Youngentob, Zdenek and van Gorsel2016) or telescopic branch cutters (see Supplementary Appendix 2 for additional details).
Trait Measurements
Trait measurements for species are stand specific. LMA, LDMC, and leaf thickness were measured according to standardized protocols (Perez-Harguindeguy et al. Reference Perez-Harguindeguy, Diaz, Garnier, Laboral, Poorter, Jaureguiberry, Bret-Harte, Cornwell, Craine and Gurvich2013) on 8–14 leaves per individual of all species. The δ13C and C:N were measured on three leaves per species for 91% of species–stand pairs (two leaves for 8% and one leaf for 1% of species), including all tree species (≥10 cm DBH), at stable isotope facilities at the University of Washington (see Supplementary Appendix 2 for additional details).
Leaf morphology was digitally measured from scanned images of fresh leaves on 5–17 leaves per species (76% of species have n ≥ 10). To make morphological measurements comparable to paleobotanical approaches, we followed the digital leaf physiognomy approach originally devised as a paleoclimate proxy (Peppe et al. Reference Peppe, Royer, Cariglino, Oliver, Newman, Leight and Enikolopov2011; Lowe et al. Reference Lowe, Flynn, Butrim, Baumgartner, Royer and Peppe2024). This method measures morphological variables such as leaf area, blade circularity (via Feret diameter ratio [FDR]), margin complexity (via shape factor), blade toothiness, and the PM (Table 1). For several leaves (n = 17) of Quercus alba and Quercus velutina, the lobe geometry was such that they qualified as very large teeth (i.e., were incised less than 25% the distance to the major vein; Royer et al. Reference Royer, Wilf, Janesko, Kowalski and Dilcher2005; Lowe et al. Reference Lowe, Flynn, Butrim, Baumgartner, Royer and Peppe2024). We found that these outliers skewed stand-scale results and instead prepared these leaves using a “isolated tooth” protocol, which effectively decreases the amount of leaf area held within each tooth (see Supplementary Appendix 3 for further details). To replicate the approach taken in paleoecology studies, we used the PM to reconstruct community-scale LMA mean and variance using the equations of Lowe et al. (Reference Lowe, Royer, Wieczynski, Butrim, Reichgelt, Azevedo-Schmidt, Peppe, Enquist and Strömberg2025). For all leaf trait measurements, leaflets of compound leaves were treated as leaves.
Leaf traits measured in this study. Measurements were made on fresh leaves (before drying), unless stated otherwise

Analyses
All analyses were performed using R (v. 4.3.2; R Core Team Reference Team2023). Species averages were first calculated for all traits. Species with toothed leaves were assigned a margin state of 0, untoothed leaves a 1, and species with both types of leaves a 0.5. Stand-scale mean and variance were calculated from species averages. Untoothed species were not included in calculating stand-level toothed variables, but untoothed leaves for mixed-margined species were included in the calculation of species averages by setting their tooth frequency and area to 0 and perimeter ratio to 1. Stand mean and variance were calculated both in a species-weighted (each species contributes equally) and abundance-weighted approach (each species contributes proportionally to its total stem basal area [SBA; calculated from DBH] in the stand; e.g., Enquist et al. Reference Enquist, Norberg, Bonser, Violle, Webb, Henderson, Sloat, Savage, Pawar, Woodward and Dell2015). Abundance weighting better reflects ecosystem-scale processes and the most successful trait values (i.e., those associated with the greatest plant biomass) (Grime Reference Grime1998; Enquist et al. Reference Enquist, Norberg, Bonser, Violle, Webb, Henderson, Sloat, Savage, Pawar, Woodward and Dell2015) but excludes species with individuals <10 cm DBH, including the entire 4 YO stand. Paleoecological studies most often use a species-weighted approach, because quantitative inference of original abundance is difficult to obtain from fossil records (but see Soh et al. Reference Soh, Wright, Bacon, Lenz, Steinthorsdottir, Parnell and McElwain2017). For the species-weighted approach, we consider both the entire WNMA community and only tree species (defined in this study as species with individuals ≥10 cm DBH in the stand) to better understand understory controls on WNMA traits and because trees are overrepresented in fossil leaf assemblages sourced from forests (Greenwood Reference Greenwood2005).
Multivariate morphological diversity was assessed using the R package FD (Laliberté et al. Reference Laliberté, Legendre and Shipley2014), in which individual traits standardized to mean 0 and unit variance were included in a principal coordinate analysis (Laliberté and Legendre Reference Laliberté and Legendre2010). Of the diversity indices produced by FD, we included morphological richness, evenness, and dispersion, because they are intuitive measures of diversity. Richness represents the amount of morphological space filled by the community, evenness represents how evenly species are distributed within that morphological space, and dispersion represents how dispersed species are from the centroid of morphological space (Laliberté and Legendre Reference Laliberté and Legendre2010). Both species- and abundance-weighted (by total SBA) analyses were performed for evenness and dispersion, but abundance weighting is not possible for calculations of richness (Laliberté and Legendre Reference Laliberté and Legendre2010).
To consider how leaf trait variation reflects taxonomic composition, the similarity of taxonomic composition, in terms of presence/absence and abundance (by total SBA), was assessed across stands using nonmetric multidimensional scaling. The SBA of each species was first relativized by its proportion of total stand SBA for the abundance-weighted analysis, and 2D solutions were produced using Bray-Curtis dissimilarity matrices with metaMDS() in the vegan package (Oksanen et al. Reference Oksanen, Simpson, Blanchet, Kindt, Legendre, Minchin and O’Hara2022).
We explored structural influences on LMA (leaf thickness, LDMC, and C:N), using the lm() function (R Core Team Reference Team2023). Because their values exhibited a right-skewed distribution across species, PM, LMA, and leaf area were log10 transformed before regression analyses. To assess the correlation of PM and LMA, we defined linear relationships of log10-transformed values using the lm() function (R Core Team Reference Team2023).
To test whether succession confounds paleoclimate reconstructions, we produced stand-scale reconstructions of MAT and MAP using the digital leaf physiognomy (DiLP) proxy method (Peppe et al. Reference Peppe, Royer, Cariglino, Oliver, Newman, Leight and Enikolopov2011). This method employs multiple linear regression models, including margin state, leaf circularity (FDR), and tooth count:internal perimeter (TC:IP) for MAT, and leaf area, ln(TC:IP), and ln(perimeter ratio) for MAP (Royer et al. Reference Royer, Sack, Wilf, Lusk, Jordan, Niinemets and Wright2007; Peppe et al. Reference Peppe, Royer, Cariglino, Oliver, Newman, Leight and Enikolopov2011) (Table 1). We used the R package dilp to process data and produce climate reconstructions (Butrim et al. Reference Butrim, Lowe, Flynn, Baumgartner, Peppe and Royer2024b; Lowe et al. Reference Lowe, Flynn, Butrim, Baumgartner, Royer and Peppe2024).
Results
Species Composition, LMA, C:N, LDMC, and Leaf Thickness
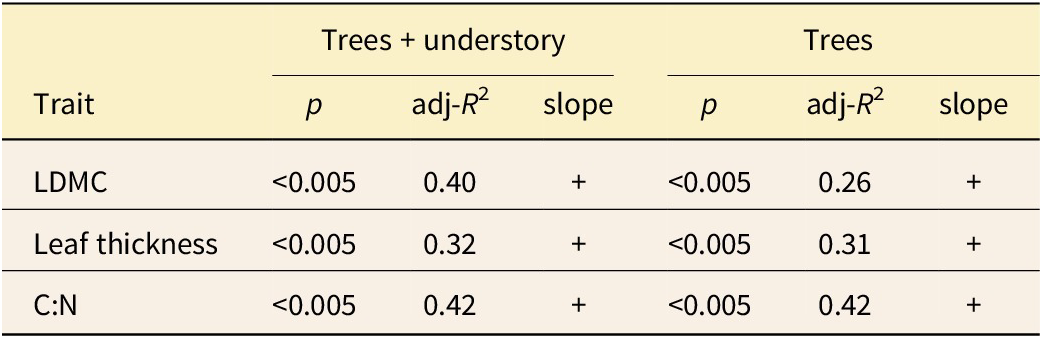
Species composition varied across succession, with Carya spp., Betula lenta, and Robinia pseudoacacia more abundant in early succession and Liriodendron tulipifera, Quercus alba, Quercus rubra, and Acer rubrum more abundant in late succession (Fig. 1A,B; Supplementary Appendix 4). There was a general increase in mean LMA and C:N mean across succession for trees using both species- and abundance-weighted approaches (Fig. 2). The increase in species-weighted tree LMA mean was strongly influenced by the occurrence of two high-LMA species of evergreen woody understory shrubs, Rhododendron maximum and Kalmia latifolia—when these two taxa are excluded, LMA still increases, but to a lesser extent (i.e., by 8.2 g/m2; Supplementary Appendix 5). For the entire WNMA community, LMA peaked at mid-succession, and then decreased to late succession (Fig. 2), alongside an increased richness of species restricted to the understory (Supplementary Appendix 6). LMA mean was positively correlated with both LDMC and leaf thickness at similar levels for the entire WNMA community (adj-R 2 = 0.40 and 0.32, respectively) and for trees (adj-R 2 = 0.26 and 0.31, respectively; Table 2). A slightly stronger correlation was found between LMA and C:N (adj-R 2 = 0.42 for both all WNMA and trees; Table 2).
Changes in taxonomic composition (A, B) and leaf morphology across (C) different-aged stands. A, Nonmetric multidimensional scaling (NMDS) plot with species weighted by relative abundance (i.e., proportion of total stem basal area [SBA]), with the top five most-abundant species listed. B, NMDS analysis including only taxon presence/absence. C, Scanned leaf images of the top five most-abundant leaves in each stand, excluding the 4 YO stand, where stem basal area was not measured, arranged in order of abundance. Leaf sizes are scaled to the 3 cm scale bar.

Changes in community leaf traits across ecological succession, including those related to ecological strategy, leaf δ13C, leaf size and shape, and leaf toothiness. Leaf traits are analyzed using three different approaches. Rec. LMA, reconstructed leaf mass per area; other abbreviations follow Table 1.

The strength and significance of linear relationships between leaf mass per area (LMA) and traits considered to influence LMA directly, including leaf dry matter content (LDMC), which approximates leaf density, leaf thickness, and carbon/nitrogen ratio (C:N). A plus sign (+) signifies a positive slope

Species-weighted LMA variance increased through succession among trees but peaked in mid-succession for the entire WNMA community. Patterns among trees were again strongly influenced by the high-LMA evergreen species, R. maximum and K. latifolia (Supplementary Appendix 5). Abundance-weighted LMA variance peaked at mid-succession (Fig. 2) and was not influenced by R. maximum and K. latifolia, because those species contribute minimally to stand total SBA.
Leaf Morphology and δ13C
Several aspects of leaf morphology varied across succession (Figs. 1C, 2). PM, and thus reconstructed LMA, increased across succession following the trend of measured LMA (Fig. 2). In fact, reconstructed LMA mean correlated strongly and positively with measured LMA mean at the stand scale for trees (adj-R 2 = 0.90), although the correlation was nonsignificant when understory plants were included, and weak at the species scale for both trees and the entire WNMA community (adj-R 2 = 0.17 and 0.11, respectively; Fig. 3). In most cases, values fall below the 1:1 line, indicating that LMA reconstructions from PM often overestimated measured LMA.
The relationships between reconstructed and measured leaf mass per area (LMA) across different-aged stands (shown by point color) compared with a 1:1 relationship (dashed line). A–C, Analyses including trees and understory plants for (A) species mean, (B) stand mean, and (C) stand variance. D–F, Analyses limited to trees for (D) species mean, (E) stand mean, and (F) stand variance.

The proportion of untoothed species increased through succession among trees but was relatively invariable for the entire WNMA community. Among toothed species, tooth frequency (TC:IP) varied little among trees but was highest at the old-growth (>200 YO) site for the entire WNMA community. Tooth size (tooth area/blade area [TA:BA]) showed no notable trend across succession for trees or the entire WNMA community. Leaf margin complexity increased (shape factor decreased) across succession only when weighted by abundance (Fig. 2) and did not vary appreciably for species-weighted measurements. Leaf circularity (FDR) generally decreased across succession for both species-weighted approaches, although only subtly, encompassing ~16% of total variation across the species of this study. When abundance weighted, leaf circularity spiked at the 44 YO stand, but did not vary otherwise (Fig. 2).
The δ13C mean showed mixed patterns, being relatively invariable across succession among trees when species weighted, spiking at mid-succession (44 YO stand) when trees were abundance weighted, and peaked at mid-succession for the entire WNMA community (Fig. 2). The δ13C variance also showed mixed patterns, with trees having low variance at mid- to late succession when species weighted, generally decreasing variance when abundance weighted, and with maximum variance in the old-growth (>200 YO) stand for the entire WNMA community (Fig. 2).
Leaf morphological richness peaked at mid-succession among trees and increased through succession for the entire WNMA community (Fig. 4A). This pattern mirrored trends in species richness (Fig. 4B). Patterns of morphological evenness were variable, peaking at mid-succession for the entire WNMA community, fluctuating for trees when species weighted, and decreasing across succession when trees were abundance weighted (Fig. 4D). Morphological dispersion peaked in mid-succession for the entire WNMA community but was variable for trees when species and abundance weighted (Fig. 4G). Species evenness had a fluctuating trend across succession (Fig. 4E).
Diversity indices for different-aged stands, including those related to leaf morphological diversity (A, D, G), species diversity (B, E), and the diversity of leaf economic spectrum (LES) strategies assessed by both (C) measured and (F) reconstructed (rec.) leaf mass per area (LMA). Leaf traits are analyzed using three different approaches. Species richness represents all taxa censused in the plot, including those not sampled (see Supplementary Appendix 4).

Climate Reconstructions
The multivariate morphological space of each stand, and the combined stands, falls within the DiLP calibration space, allowing reliable climate reconstructions (Peppe et al. Reference Peppe, Royer, Cariglino, Oliver, Newman, Leight and Enikolopov2011; Lowe et al. Reference Lowe, Flynn, Butrim, Baumgartner, Royer and Peppe2024; Supplementary Appendix 7). Reconstructions of MAT varied from 10.1°C to 15.3°C and matched well with true MAT (10.8°C–12.8°C) (Fig. 5A). The average error was 1.1°C across all stands, but lower for the two oldest stands (0.4°C) than the three youngest (1.8°C). When data were combined across all stands (i.e., site scale), the reconstructed MAT was 12.8°C. Reconstructions of MAP ranged from 149.6 to 173.4 cm/yr, and 165.7 cm/yr for the combined data, all similar to but less than the true range of MAP (180–206 cm/yr) (Fig. 5B).
Estimated climatic variables using the digital leaf physiognomy (DiLP) proxy across different-aged stands and by combining data across all stands (i.e., site level; “combined”). Estimations are done for both trees only and trees and understory plants combined. The gold bar marks the true climate variable. A, Estimated mean annual temperature (MAT), with true site temperature at the old-growth stand adjusted to reflect its slightly higher elevation, and (B) mean annual precipitation (MAP), with the bar width capturing values across all stands.

Discussion
LMA and the Role of the LES
Across a successional gradient (i.e., chronosequence) in an eastern U.S. temperate deciduous forest, LMA mean increased across succession among trees when species and abundance weighted, providing some support for the role of the LES across succession (Fig. 2). Increasing LMA is accompanied by shifts in taxonomic composition among deciduous canopy dominants, with greatest dissimilarity between the 21 YO stand and those older (Fig. 1A). Compositional changes reflect, in part, differing shade tolerance strategies, with 21 YO stand dominants Robinia pseudoacacia, Carya spp., Quercus velutina, and Betula lenta having low–intermediate tolerance of shade, while older stand dominants Quercus rubra, Quercus alba, and Acer rubrum have an intermediate–high tolerance of shade (Burns and Honkala Reference Burns and Honkala1990).
The increase of species-weighted LMA among trees is primarily driven by the growth of high-LMA evergreen species Rhododendron maximum and Kalmia latifolia, which are absent from the two youngest stands and present but <10 cm DBH at the 44 YO stand (Supplementary Appendix 5). Both species mature as small shade-tolerant woody shrubs in forest understories (Monk et al. Reference Monk, McGinty and Day1985) and have increased in abundance regionally in response to suppressed disturbance (e.g., fire and grazing; McGee and Smith Reference McGee and Smith1967; Elliott et al. Reference Elliott, Boring, Swank and Haines1997). Increases in the prevalence of evergreen, over deciduous, WNMAs across succession has also been reported from subtropical forests of China (Wang et al. Reference Wang, Kent and Fang2007; Kröber et al. Reference Kröber, Böhnke, Welk, Wirth and Bruelheide2012). These points suggest that increasing LMA resulting from a greater prevalence of evergreen tree species across succession may apply to both subtropical and temperate humid forests.
When species restricted to the understory (i.e., <10 cm DBH) are included for all stands, the LMA increase is reversed from mid- to late succession (Fig. 2), as low-LMA deciduous understory elements become more diverse (Supplementary Appendix 6), reflecting the greater structural complexity of the old-growth stand. This outcome highlights the sensitivity of community-scale interpretations to the extent to which understory elements are considered, as understory elements can have lower LMA than canopy trees in temperate humid forests (e.g., Nomura et al. Reference Nomura, Matsuo, Ichie, Kitayama and Onoda2023).
In contrast to the LES model of succession, previous work has found that shade-tolerant tree species, which prevail in late successional environments, have lower LMA, driven in part by large and thin leaves that maximize light interception for a given investment (Niinemets and Kull Reference Niinemets and Kull1994; Niinemets et al. Reference Niinemets, Kull and Tenhunen1998; Aranda et al. Reference Aranda, Pardo, Gil and Pardos2004; Hallik et al. Reference Hallik, Niinemets and Wright2009). We find that leaf thickness across succession in this study did not drive variation in LMA considerably more than leaf density, as approximated by LDMC (Garnier and Laurent Reference Garnier and Laurent1994; Perez-Harguindeguy et al. Reference Perez-Harguindeguy, Diaz, Garnier, Laboral, Poorter, Jaureguiberry, Bret-Harte, Cornwell, Craine and Gurvich2013), although correlations were never very strong (adj-R 2 ≤ 0.40; Table 2). Instead, resource allocation patterns, as assessed by C:N, correlated most strongly with LMA (adj-R 2 = 0.42; Table 2). This pattern suggests that complicated influences of both leaf thickness and leaf density drive LMA variation across succession in this temperate deciduous forest.
Previous reports of negative LMA–shade tolerance relationships in deciduous taxa were mainly assessed at the species scale (Niinemets and Kull Reference Niinemets and Kull1994; Niinemets et al. Reference Niinemets, Kull and Tenhunen1998; Aranda et al. Reference Aranda, Pardo, Gil and Pardos2004; Hallik et al. Reference Hallik, Niinemets and Wright2009). However, one study assessing abundance-weighted LMA mean at the community scale found it to be lower for tree species growing in previously clear-cut areas relative to unmanaged old-growth in temperate forests of Japan (Nomura et al. Reference Nomura, Matsuo, Ichie, Kitayama and Onoda2023), supporting our results. Nevertheless, our findings may not be applicable in all contexts. For example, species of Fagus, which have low LMA and thin leaves relative to other deciduous species (Aranda et al. Reference Aranda, Pardo, Gil and Pardos2004; Legner et al. Reference Legner, Fleck and Leuschner2014) are often canopy dominants of old-growth temperate deciduous forests (Braun Reference Braun1964; Burns and Honkala Reference Burns and Honkala1990), but were not in the late successional stands of this study. Therefore, this study provides some support for the LES model of succession in temperate deciduous forests, but further documentation of LMA at the community scale—a scale that best captures how ecological strategies are filtered and assemble within forest stands—will aid in understanding the universality of these results.
Leaf Morphology and δ13C as Indicators of Ecology and Succession
Petiole Metric.
The PM, which was used to reconstruct LMA following established paleoecological methods (Royer et al. Reference Royer, Sack, Wilf, Lusk, Jordan, Niinemets and Wright2007; Lowe et al. Reference Lowe, Royer, Wieczynski, Butrim, Reichgelt, Azevedo-Schmidt, Peppe, Enquist and Strömberg2025), increased across succession for mean and variance. This pattern mirrors trends in measured LMA, particularly for trees (Figs. 2–4), in support of our hypothesis. Our results further corroborate the utility of PM in reconstructing LES strategies at the community scale (Royer et al. Reference Royer, Sack, Wilf, Lusk, Jordan, Niinemets and Wright2007; Peppe et al. Reference Peppe, Baumgartner, Flynn, Blonder, Croft, Simpson and Su2018; Butrim et al. Reference Butrim, Lowe and Currano2024a; Lowe et al. Reference Lowe, Royer, Wieczynski, Butrim, Reichgelt, Azevedo-Schmidt, Peppe, Enquist and Strömberg2025). In contrast, reconstructed (from PM) and measured LMA corresponded less at the species scale (Fig. 3A,D), and correlations were weaker than those seen in previous work integrating across larger spatial scales (Royer et al. Reference Royer, Sack, Wilf, Lusk, Jordan, Niinemets and Wright2007, Reference Royer, Miller, Peppe and Hickey2010). The greater correspondence for community mean, relative to species mean, of this study results from a predominant influence of just a few high-LMA evergreen species. When evergreen species R. maximum and K. latifolia are removed from the analysis, the community-scale relationship is weaker (adj-R 2 = 0.30 vs. 0.90) and insignificant (Student’s t-test; p > 0.05). Such an outcome suggests that comparisons of reconstructed LMA among deciduous species in temperate humid forests should be made with caution and highlights open questions about the scales and contexts at which PM–LMA relationships are strongest.
Toothiness.
In support of our hypothesis, a greater proportion of tree species with toothed leaves comprised early successional stands (Fig. 2), following the pattern documented in a tropical wet forest (Kappelle and Leal Reference Kappelle and Leal1996). This pattern also corroborates previous work suggesting that leaf teeth may help confer rapid growth strategies in high-light and disturbed environments (Kowalski and Dilcher Reference Kowalski and Dilcher2003; Greenwood Reference Greenwood2005; Royer and Wilf Reference Royer and Wilf2006; Royer et al. Reference Royer, Kooyman, Little and Wilf2009, Reference Royer, Peppe, Wheeler and Niinemets2012). The link between leaf teeth, growth strategy, and early succession may result from enhanced early-season transpiration and photosynthesis (Baker-Brosh and Peet Reference Baker-Brosh and Peet1997; Royer and Wilf Reference Royer and Wilf2006) and efficient packing of leaves in overwintering buds (Edwards et al. Reference Edwards, Spriggs, Chatelet and Donoghue2016). There is no correspondence between the proportion of untoothed species and the (small) differences in elevation and temperature of our stands, contrary to predictions of established MAT–leaf margin relationships (e.g., Royer et al. Reference Royer, Kooyman, Little and Wilf2009; Peppe et al. Reference Peppe, Royer, Cariglino, Oliver, Newman, Leight and Enikolopov2011), suggesting little confounding effect on leaf morphological patterns (Supplementary Appendix 8).
Species growing only in the understory of early successional environments were disproportionately untoothed, and their inclusion in analyses tempers the increasing trend of untoothed species (Fig. 2). However, trees better showcase strategies that are most successful in growing to occupy the early successional canopy and thus better reflect successful ecological strategies in terms of biomass. Among trees, there was no clear pattern in the number or size of teeth across succession (Fig. 2), suggesting these characters may be less functional at a local scale compared with a continental or global scale across gradients of climate (Royer et al. Reference Royer, Wilf, Janesko, Kowalski and Dilcher2005; Peppe et al. Reference Peppe, Royer, Cariglino, Oliver, Newman, Leight and Enikolopov2011).
Leaf Margin Complexity.
In contrast to our hypothesis and the pattern documented in a tropical wet forest (Kappelle and Leal Reference Kappelle and Leal1996), abundance-weighted leaf margin complexity increased, rather than decreased, across succession (Fig. 2). This reflects the increased dominance of lobed-leaved Acer rubrum, a shade-tolerant species, and species of Quercus classified as mid-tolerant (Barnes et al. Reference Barnes, Zak, Denton and Spurr1998). Lobed leaves, through efficient bud packing and heightened early-season photosynthetic and transpiration rates (Baker-Brosh and Peet Reference Baker-Brosh and Peet1997; Edwards et al. Reference Edwards, Spriggs, Chatelet and Donoghue2016), may help confer shade tolerance to juvenile understory trees that leaf out early to intercept high irradiance before the canopy closes—a behavior known in shade-tolerant species of Acer (Seiwa Reference Seiwa1999; Augspurger and Bartlett Reference Augspurger and Bartlett2003; Richardson and O’Keefe Reference Richardson, O’Keefe and Noormets2009). Alternatively, or in addition, lobed leaves may help an understory plant ramp up growth during canopy gap formation (Abrams Reference Abrams1998) by increasing hydraulic efficiency (Sisó et al. Reference Sisó, Camarero and Gil-Pelegrín2001) and countering the influence of low wind speed in forest understories on increased boundary layer resistance (Givnish Reference Givnish, Solbrig, Jain, Johnson and Raven1979; Leigh et al. Reference Leigh, Sevanto, Close and Nicotra2017). Many understory plants in tropical environments have leaves with dissected margins (Givnish Reference Givnish, Solbrig, Jain, Johnson and Raven1979), suggesting a potential link between margin complexity and shade tolerance. In addition, complex margins are associated with colder and more seasonal temperatures in North America (Royer et al. Reference Royer, Wilf, Janesko, Kowalski and Dilcher2005), where rapid growth during a short growing season is advantageous (Lowe et al. Reference Lowe, Royer, Wieczynski, Butrim, Reichgelt, Azevedo-Schmidt, Peppe, Enquist and Strömberg2025). However, increasing margin complexity among tree dominants alongside a greater prevalence of untoothed tree species is difficult to reconcile given the similar effects of teeth and lobes in reducing boundary layer thickness (Baker-Brosh and Peet Reference Baker-Brosh and Peet1997). In addition, several other shade-tolerant species that are prevalent in old-growth temperate deciduous forests do not have lobed leaves (e.g., species of Fagus and Tilia; Burns and Honkala Reference Burns and Honkala1990), complicating links drawn between margin complexity and shade tolerance. Finally, species-weighted margin complexity was less variable among trees, complicating its application to the fossil record.
Diversity.
Morphological richness varied across succession alongside other measures of diversity, providing some insight into its functional significance (Fig. 4). Trends of morphological and species richness, and of δ13C and LMA variance, often differed depending on whether the entire WNMA community or just trees were considered. For the entire WNMA community, the old-growth stand showed the highest morphological and species richness (Fig. 4) and the highest δ13C variance (Fig. 2) and was among the highest LMA variances. The old-growth stand also had the greatest richness of species restricted to the understory aside from the 4 YO stand. Thus, we interpret an increase in structural complexity and available niche space in our old-growth stand to have influenced a higher diversity of species displaying a greater range of leaf morphologies and resource acquisition strategies (Currano et al. Reference Currano, Jacobs, Pan and Tabor2011; Graham et al. Reference Graham, Patzkowsky, Wing, Parker, Fogel and Freeman2014; Poorter et al. Reference Poorter, van der Sande, Amissah, Bongers, Hordijk, Kok, Laurance, Martínez‐Ramos, Matsuo and Meave2024) and a greater range of photosynthetic rates and water use efficiency strategies in response to more complex light environments (e.g., Graham et al. Reference Graham, Patzkowsky, Wing, Parker, Fogel and Freeman2014; Cheesman et al. Reference Cheesman, Duff, Hill, Cernusak and McInerney2020). These results corroborate suggested potential links between morphological and functional diversity (Roth-Nebelsick and Traiser Reference Roth-Nebelsick and Traiser2024).
Among trees, morphological and species richness was lowest in the youngest (21 YO) stand, but peaked at mid-succession (Fig. 4A,B). Abundance-weighted LMA variance also peaked at mid-succession (Fig. 4C), showcasing patterns among tree dominants. When understories are not included, structural complexity is a less important factor; instead, a mix of shade-tolerance strategies among canopy trees in mid-succession likely drives patterns in tree richness (e.g., Connell Reference Connell1978). In contrast, abundance-weighted δ13C variance decreased through succession (Fig. 2), suggesting potentially greater convergence in water use efficiency strategies among canopy dominants (Cernusak Reference Cernusak2020).
Additional Traits.
Several additional traits had subtle or complicated patterns across succession that are difficult to tie to function and apply to the fossil record. For example, leaf area was largest among saplings in the 4 YO stand (Fig. 2), including a very large-leafed and invasive Paulownia tomentosa (avg. leaf area = 727 cm2), and generally decreased through mid- to late succession. However, the trend was not apparent for abundance-weighted area (Fig. 2), and it contradicts previous work finding that shade-tolerant deciduous species are typically characterized by larger leaves that maximize light interception (Niinemets and Kull Reference Niinemets and Kull1994; Niinemets et al. Reference Niinemets, Kull and Tenhunen1998). Leaf circularity decreased slightly across succession for species-weighted values, but sharply increased at the 44 YO stand when abundance weighted (Fig. 2), reflecting the dominance of Liriodendron tulipifera (70% of total stand SBA; Fig. 1), whose leaves are relatively circular (Supplementary Appendix 7)—it is unclear whether this pattern relates to function. Discordant patterns among morphological evenness, species evenness, and morphological dispersion are difficult to reconcile. There was little change in δ13C mean through succession among trees (Fig. 2), contrary to our hypothesis, which is potentially a result of our targeted sampling of sunlit canopy leaves (e.g., Cheesman et al. Reference Cheesman, Duff, Hill, Cernusak and McInerney2020). However, a spike in abundance-weighted δ13C occurs at the 44 YO stand, reflecting the strong dominance of L. tulipifera, which had relatively high δ13C. A large drawdown of c i relative to c a, indicative of rapid photosynthesis and a high water use efficiency, may have helped confer rapid growth known to characterize this shade-intolerant and isohydric species (Burns and Honkala Reference Burns and Honkala1990; Benson et al. Reference Benson, Miniat, Oishi, Denham, Domec, Johnson, Missik, Phillips, Wood and Novick2022) and help explain its strong dominance in the canopy of this mid-successional stand.
Application to Reconstructing Successional Dynamics in the Fossil Record
Results of this study offer utility for some leaf morphological traits in reconstructing successional dynamics in ancient temperate deciduous forests, corroborating work in other vegetation types (Kappelle and Leal Reference Kappelle and Leal1996; Currano et al. Reference Currano, Jacobs, Pan and Tabor2011; Table 3). We place emphasis on leaf trait patterns among tree species, rather than the entire WNMA community, given their overrepresentation in fossil leaf assemblages sourced from forests. For example, leaf abundance in humid temperate forest leaf litter best correlates with a species total SBA (Burnham et al. Reference Burnham, Wing and Parker1992; Steart et al. Reference Steart, Greenwood and Boon2005), demonstrating a lower probability of understory plants with lower SBA becoming fossilized. However, this probability increases with fossil sample size, and several prior studies do report fossil taxa inferred as shrubs or small trees from ancient forested environments (e.g., Chaney and Axelrod Reference Chaney and Axelrod1959; Wolfe and Wehr Reference Wolfe and Wehr1987; Kvacek Reference Kvacek2004). Thus, in some cases, patterns of the entire WNMA community may be more applicable (e.g., very well sampled assemblages).
Results of this study that are most relevant to application in the fossil record. Successional patterns are described for trees only. LMA, leaf mass per area; LES, leaf economic spectrum; PM, petiole metric; WNMA, woody non-monocot angiosperm

Leaf trait patterns across succession suggest that disturbed stands in temperate deciduous forests may contain tree species with more toothed leaves and lower reconstructed LMA compared with late successional and old-growth stands (Table 3). LMA variance increases across succession following increases in evergreen WNMA abundance (Supplementary Appendix 4). The fact that the presence of high-LMA evergreen outliers was an important driving factor in patterns of community-scale LMA and PM should be considered when interpreting fossil records (e.g., Lowe et al. Reference Lowe, Royer, Wieczynski, Butrim, Reichgelt, Azevedo-Schmidt, Peppe, Enquist and Strömberg2025). Morphological richness may be expected to reflect species richness, and both can peak when pooling ecological strategies typical of early and late succession, including in mid-succession (Fig. 4; Table 3), when low-severity disturbances occur frequently (Connell Reference Connell1978; Miller et al. Reference Miller, Roxburgh and Shea2011), or when integrating across an area where disturbance occurs in a patchy manner (White and Pickett Reference White, Pickett, Pickett and White1985).
The increase in margin complexity among dominant trees is likely not applicable to the fossil record, as the same trend was not apparent for trees when using a species-weighted approach, which is most utilized in paleoecological studies. In fact, patterns of several leaf traits differed depending on whether calculations were abundance weighted (by total SBA) or species weighted (Figs. 2, 4), demonstrating diverging trends among dominant versus subordinate tree species. While such divergence is a common result in modern ecological studies, and the reason neo-ecologists place emphasis on abundance-weighted values (e.g., Enquist et al. Reference Enquist, Norberg, Bonser, Violle, Webb, Henderson, Sloat, Savage, Pawar, Woodward and Dell2015), it complicates applications to the fossil record. For example, although total SBA and leaf abundance in forest floor litter are correlated, rank abundance as determined by SBA and leaf litter counts do not correspond 1:1 (e.g., Burnham et al. Reference Burnham, Wing and Parker1992; Steart et al. Reference Steart, Greenwood and Boon2005).Thus, it is unclear how abundance weighting by censused fossil leaf counts (e.g., Soh et al. Reference Soh, Wright, Bacon, Lenz, Steinthorsdottir, Parnell and McElwain2017) correlates to abundance weighting by SBA, and whether weighting by leaf counts provides more informative data than species-weighted approaches. In summary, we consider species-weighted values of trees in this study most applicable to the fossil record via comparison to species-weighted calculations of fossil leaf assemblages.
Succession has both predictable and unpredictable components (Poorter et al. Reference Poorter, van der Sande, Amissah, Bongers, Hordijk, Kok, Laurance, Martínez‐Ramos, Matsuo and Meave2024), and the universality of successional patterns of this study relies on mechanistic links between traits and fitness. Patterns of PM and leaf margin across succession in this study agree with independent lines of evidence linking leaf traits to function and fitness (Table 3). However, additional traits are known to be important in conferring ecological strategies across succession, including those related to seed production and dispersal, physiological traits influencing photosynthetic rates, respiration rates, photosynthetic saturation, and expressions of phenotypic plasticity (Woods and Turner Reference Woods and Turner1971; Abrams Reference Abrams1998; Oguchi et al. Reference Oguchi, Hikosaka and Hirose2005; Wilfahrt et al. Reference Wilfahrt, Collins and White2014; Poorter et al. Reference Poorter, van der Sande, Amissah, Bongers, Hordijk, Kok, Laurance, Martínez‐Ramos, Matsuo and Meave2024). Patterns are also likely to differ depending on the forest type. For example, in tropical dry forests, high irradiance in early succession increases soil water limitation and may favor drought resistance traits and strategies (e.g., Fonseca et al. Reference Fonseca, Silva, Falcão, Dupin, Melo and Espírito-Santo2018).
Natural disturbances act on various spatial and temporal scales, from tree-fall gaps to volcanic eruptions, or even asteroid impacts (Poorter et al. Reference Poorter, van der Sande, Amissah, Bongers, Hordijk, Kok, Laurance, Martínez‐Ramos, Matsuo and Meave2024), and varying depositional environments and fossil sampling methodologies differ in their spatial and temporal resolution (Wing and DiMichele Reference Wing and DiMichele1995). For example, if disturbances are infrequent with low severity, they may be difficult to detect, because even narrow ranges of stratigraphy can average across hundreds or thousands of years—exceptions being instantaneous events such as thick volcanic ash burying vegetation in situ (e.g., Wing et al. Reference Wing, Strömberg, Hickey, Tiver, Willis, Burnham and Behrensmeyer2012). Larger-scale disturbances (e.g., high-severity volcanic processes, large-scale crown fires, large-scale herbivory or pathogen outbreak) and/or disturbances that occur at high frequency (e.g., frequent fire regime, volcanically active or flood-prone landscapes) are instead those most detectable in most fossil records (e.g., Currano et al. Reference Currano, Jacobs, Pan and Tabor2011; Lowe et al. Reference Lowe, Greenwood, West, Galloway, Sudermann and Reichgelt2018).
The Influence of Disturbance on Paleoclimate Reconstructions
Variation in leaf morphology across succession has the potential to confound leaf physiognomy–based paleoclimate proxies, which rely on macroclimate as a predominant correlate. In our study, we found that the effect of successional stage was minimal using the DiLP proxy, as the average error of reconstructed MAT and MAP was consistently low, averaging 1.1°C and 15.3 cm/yr, respectively, all within the uncertainty bands of the estimates (Fig. 5). In addition, we reconstructed climate at the site scale by combining stands to simulate the spatial and temporal averaging that may occur in some fossil assemblages. These combined reconstructions also helped increase species richness to the minimum number (~15 WNMAs) suggested by previous work (Wolfe Reference Wolfe1993; Lowe et al. Reference Lowe, Flynn, Butrim, Baumgartner, Royer and Peppe2024), as only the 44 YO stand had ≥15 tree species. MAT and MAP reconstructions were similarly accurate for combined stands compared with individual stands (Fig. 5). These results suggest that MAT and MAP reconstructions made using the DiLP proxy on fossil macrofloras from analogous paleovegetation types may be relatively robust to successional status or degrees of spatial averaging, more so than what has been proposed by previous work using pollen assemblages (e.g., Taggart and Cross Reference Taggart, Cross, Lockley and Rice1990; Schiller et al. Reference Schiller, Lowe, Dillhoff, Fields, Taggart, Schmitz and Strömberg2024).
Patterns of MAT estimates do not directly correspond to patterns in the proportion of untoothed species, known to be an important influence on the leaf morphology–MAT relationship. For example, among trees, reconstructed MAT is most similar between the 21 YO and >200 YO stands (11.1°C vs. 10.8°C, respectively) where the proportion of untoothed species is most dissimilar (19% and 30%, respectively). This outcome reflects the influence of other variables in the regression, including leaf circularity (FDR) and tooth frequency (TC:IP), and suggests that the DiLP proxy may be less sensitive to confounding effects of disturbance than univariate proxies that rely on leaf margin alone (i.e., leaf margin analysis; Wing and Greenwood Reference Wing and Greenwood1993).
Conclusions
Using a community-scale dataset of in situ leaf traits sampled across a chronosequence in temperate deciduous forests of North Carolina, USA, we aimed to (1) test the role of the LES in this forest type, with the prediction that lower LMA leaves with higher nutrient concentrations have greater prevalence in early succession; (2) test for links between leaf morphology and plant ecological strategies across succession and provide tools for reconstructing successional dynamics in the fossil record; and (3) consider how disturbance may impact paleoclimate estimates using the digital leaf physiognomy proxy.
The role of the LES across succession was partly supported in our study, as trees had higher LMA in older stands composed of a greater number of shade-tolerant species, and leaf thickness did not drive LMA variation more than leaf density (approximated by LDMC) or relative nitrogen concentration (C:N). However, LMA did not increase appreciably when considering the entire WNMA community due to increased richness of low-LMA understory plants.
Leaf morphology and δ13C patterns across succession highlight the utility of leaf teeth, PM, and leaf morphological diversity in inferring community-scale ecological strategy and successional status. Patterns among trees in closed-canopy forests may be most applicable to the fossil record given the relationships of leaf abundance in litter and SBA (Burnham et al. Reference Burnham, Wing and Parker1992). PM and measured LMA both increased across succession among trees for community mean and variance. A greater prevalence of toothed tree species in early succession is consistent with the previously proposed links of leaf teeth and faster growth strategies. Species of Acer and Quercus with high leaf margin complexity came to dominate late successional stands, suggesting a relationship between margin complexity and shade-intolerance strategies. However, the pattern has limited application to the fossil record, because species-weighted measures, which are most utilized in paleoecological studies, were much less variable. Structural diversity and a species-rich understory in the old-growth stand influenced high morphological and species richness for the entire WNMA community, as well as high LMA and δ13C variance, highlighting the importance of the increased niche space promoted in late succession. In contrast, when trees were considered alone and structural complexity was less of a factor, species and morphological richness, as well as LMA variance among tree dominants, was highest in mid-succession, likely a result of mixing shade tolerance and ecological strategies. Other traits, such as leaf area, circularity, δ13C, and the number and size of teeth, as well as morphological evenness and dispersion, had complicated or subtle trends across succession that were difficult to reconcile.
Changes in leaf morphology across succession did not strongly confound the accuracy of paleoclimate reconstructions using digital leaf physiognomy. In summary, this study provides important insight into ties between leaf morphology and ecological strategy that can be applied to the fossil record to infer successional dynamics in ancient temperate deciduous forests.
Acknowledgments
We thank the University of Washington Team Leaf (year 2021) for performing leaf morphological measurements, C. Miniat for help in project inception and technical assistance, and C. Sobek and J. Scott at Coweeta Hydrological Laboratory for technical assistance in the field. Funding for initial research plot establishment was supported by U.S. Department of Agriculture (USDA) National Institute of Food and Agriculture (NIFA), Agriculture and Food Research Initiative Competitive Grant 2012-67019-19484. Further funding supported fieldwork and research expenses from NSF EAR-1924390 to C.A.E.S. and the American Philosophical Society Lewis and Clark Grant, the Paleontological Society Student Research Grant, and the University of Washington Department of Biology Margo and Tom Wyckoff award to A.J.L. We thank A. Schauer and G. Holtgrieve (University of Washington) for their assistance with stable isotope analyses. The findings and conclusions in this publication are those of the authors and should not be construed to represent an official USDA, Forest Service, or U.S. Government determination or policy. We thank D. Peppe and one anonymous reviewer, whose feedback improved the quality of this article.
Competing Interests
The authors confirm that there are no conflicts of interest.
Data Availability Statement
Data used in this study are available from the Dryad Digital Repository: https://doi.org/10.5061/dryad.3r2280gtq. Supplementary Appendices 1–8 are available from the Zenodo Digital Repository https://doi.org/10.5281/zenodo.15830404.


 Open access