More than half of the world’s population is overweight or obese, a prevalence that is estimated to continue increasing(1). Obesity is characterised by excessive and pathological expansion of adipose tissue, with adipocytes hyperplasia and hypertrophy inducing several adipose tissue alterations(Reference Liu, Fox and Hickson2). One of them is the decline in mitochondrial mass, structure and function impairing energy metabolism(Reference Cummins, Holden and Sansbury3). Strategies that aim to reduce energy intake for the prevention and treatment of obesity have shown its limited long-term effectiveness(Reference Curioni and Lourenco4). Therefore, new therapeutic approaches targeting adipose tissue function and favouring energy expenditure have become increasingly important(Reference Kusminski, Bickel and Scherer5). In this sense, brown adipose tissue (BAT), characterised by having multilocular adipocytes with numerous mitochondria, can dissipate energy as heat to maintain body temperature (non-shivering thermogenesis)(Reference Pfeifer and Hoffmann6). Greater BAT activity results in higher energy expenditure and is associated with less central obesity(Reference Green, Bagci and Hussein7). Cold has been described as the main thermogenic factor(Reference Saito, Yoneshiro and Matsushita8). Nevertheless, some bioactive compounds, such as polyphenols, have shown to activate non-shivering thermogenesis in BAT, favouring mitochondrial function and energy expenditure(Reference Concha, Prado and Quezada9).
Pomegranate (Punica granatum) is a fruit that belongs to the family Punicaceae, whose global production amounts to two million tonnes(Reference Kalaycıoğlu and Erim10). It is frequently used for juice production, leaving peels and seeds as a by-product of processing in a proportion of 73 and 27 %, respectively(Reference Wang, Pan and Ma11). Agro-industrial residues are currently an economic and environmental problem whose handling is a pending issue in developing countries, making the by-products’ revalorisation highly necessary(12). Pomegranate peel could be a worthy residue since it has a high polyphenol content(Reference Derakhshan, Ferrante and Tadi13,Reference Russo, Fanali and Tripodo14) . The most abundant compounds in pomegranate peel are ellagitannins, specifically punicalagin and ellagic acid(Reference Russo, Fanali and Tripodo14).
Several studies have been conducted on the effectiveness of pomegranate peel extract (PPE) and its bioactive compounds in the prevention and treatment of obesity and associated comorbidities(Reference Cao, Xu and Pu15,Reference Park, Kim and Kim16) . PPE, its phenolic compounds and their metabolites generated by gut microbiota have shown to favour biogenesis and mitochondrial function among other beneficial metabolic effects in obesity models(Reference Cao, Xu and Pu15,Reference Andreux, Blanco-Bose and Ryu17,Reference Sun, Yan and Frost18) . Thus, there is a growing interest in functional foods development incorporating bioactive compounds from PPE(Reference Çam, Erdoğan and İçyer19,Reference Topkaya and Isik20) . However, a significant limitation is polyphenols’ stability that can be affected by environmental conditions such as oxygen, light and temperature(Reference Đorđević, Balanč and Belščak-Cvitanović21). Also, the bioavailablity of ellagitannins is very low and can be influenced by various factors such as the dietary matrix, gut microbiota and digestive enzymes activity(Reference Kasote, Jayaprakasha and Patil22). Moreover, tannins lend PPE a high astringency which could affect its acceptability(Reference Akhtar, Ismail and Fraternale23). One strategy to cope with these limitations is microencapsulation. In this process, solid, gaseous or liquid substances are surrounded by a wall material, resulting in stable particles in microscale that can be incorporated into various matrices(Reference Kasote, Jayaprakasha and Patil22). The microencapsulation method and wall material selection depend on the compound to be encapsulated and the expected characteristics of microparticles(Reference McClements24). Spray drying is the most common microencapsulation technique used in the food industry, mainly because it is economical, simple and feasible to scale(Reference Piñón-Balderrama, Leyva-Porras and Terán-Figueroa25). The polymer selected for wall material will determine the release behaviour of the encapsulated compound(Reference McClements24). Inulin (IN) has been described as a colonic delivery biopolymer since it remains intact through the gastrointestinal tract, releasing its content in the colon(Reference Rajpurohit, Sharma and Sharma26), which is the anatomical site where ellagitannins are metabolised(Reference Kang, Buckner and Shay27).
PPE microparticles (MPPE) have been studied as ingredients for developing functional foods(Reference Çam, Erdoğan and İçyer19,Reference Topkaya and Isik20) , but studies of their metabolic effects, especially in obesity models, are lacking. Therefore, this study aims to evaluate the effect of MPPE on BAT mitochondrial structure and function and metabolic alterations related to obesity in mice fed a high-fat diet (HFD).
Methods
Pomegranate peel extract microencapsulation
The PPE was obtained from dried and ground pomegranate peel (var. Wonderful, Maule Region, Chile) under optimal conditions by solid–liquid extraction using ethanol–water as solvents (Cea I. and García P., unpublished results). It was then microencapsulated by spray drying using IN ORAFTI GR™ with a polymerisation degree in the range of 2–60 (ALFA® Group) as the wall material. The resulting solution was fed into a mini Spray Dryer B-290 equipment (Büchi) with optimal experimental conditions determined in preliminary assays: PPE/IN ratio, 1:2·1; inlet air temperature, 166°C; air flow rate, 600 litres/h; aspiration percentage, 100 % and feed flow, 5 %. The encapsulation efficiency (EE) was determined, for which the superficial total polyphenols (TP) content was evaluated as follows: 2 ml of methanol was added to 200 mg of MPPE and centrifuged at 2700 g for 6 min. For the total experimental TP content, 1·6 ml of distilled water was added to 200 mg of MPPE and subjected to a thermoregulated bath (60°C, 1 min). Then, it was sonicated for 10 min to dissolve the microparticle completely. Subsequently, 0·4 ml of methanol was added and sonicated for 10 min. Finally, the solution was centrifuged at 2700 g for 6 min at 30°C. EE for TP was calculated according to the equation:
 $${\rm{EE}}\,\left( \% \right) = \left(\left({\rm{total}}\ {\rm{TP}} - {\rm{superficial}}\ {\rm{TP}}\right)/{\rm {100}}\right) \times {\rm{total}}\ {\rm{TP}}$$
Chemical characterisation of pomegranate peel extract and microparticles of pomegranate peel extract
Total polyphenols and punicalagin content
The TP content of PPE and MPPE was determined by using the Folin–Ciocalteu method(Reference Singleton and Rossi28). The sample’s absorbance was measured spectrophotometrically at 765 nm in a 10 mm optical path cuvette and determined by using the Lambda 25 software (Perkin-Elmer®). The results were expressed as mg of gallic acid equivalents (GAE) per g according to a calibration curve. Punicalagin was determined by using a punicalagin standard (≥98 % HPLC, Sigma-Aldrich) by HPLC-DAD, as described elsewhere(Reference Qu, Breksa and Pan29), and expressed as mg/g. For MPPE, polyphenols were extracted from microparticles before the determination of punicalagin and TP as described above for EE.
Antioxidant capacity
The antioxidant capacity was determined by using three methods: oxygen radical absorption capacity (ORAC), ferric reducing antioxidant power (FRAP), and the free radical 2,2-diphenyl-1-picrilhydrazil (DPPH) method. (i) ORAC: a standard curve was performed with different concentrations of the standard (0, 12·5, 25, 50, 100 µm Trolox). The measurement was carried out with a spectrofluorometer at 37°C, with an excitation λ of 493 nm and an emission λ of 515 nm. The results were expressed as µmol of Trolox equivalents/g(Reference Cao, Alessio and Cutler30,Reference Thaipong, Boonprakob and Crosby31) . (ii) FRAP: a 10:1:1 FRAP solution was prepared with 300 mmol/l acetate buffer pH 3·6, tripyridyltriazine reagent and 20 mmol/l aqueous solution of ferric chloride hexahydrate. Absorbance was measured at 593 nm in a 10 mm optical glass cuvette by using the software Lambda 25 (Perkin-Elmer®). The results were expressed as mg Trolox equivalents/g according to a calibration curve(Reference Benzie and Strain32). (iii) DPPH: known concentrations of the DPPH reagent dissolved in methanol (0·035 and 0·20 mm) were used. The sample’s absorbance was measured in a UV absorption spectrophotometer at 517 nm in a 10 mm optical glass cuvette. The results were expressed as mg/g(Reference Bondet, Brand-Williams and Berset33). Before MPPE antioxidant capacity assays, TP was extracted from the microparticles as described above for EE determination.
Physical characterisation of microparticles of pomegranate peel extract
Morphology and particle size
The morphology of MPPE was studied by high-resolution scanning electron microscopy, using an INSPECT-F50 microscope (Thermo Fisher Scientific) operated at 3·00 kV. The samples were coated with gold/palladium in a 108 manual sputter coater (Ted Pella Inc.) coupled to an MTM-20 thickness controller (Ted Pella Inc.). The particle size was determined by laser light scattering in a Mastersizer X (Malvern Instruments). The microparticles were dispersed in isopropyl alcohol (1:7 w/w) at room temperature with constant stirring. The instrument was operated with a 2 mW He–Ne laser beam (k = 633 nm) and a 45-mm lens (size range 0·05–80 µm), considering a pumping level of 80, 50 % agitation, 100 % laser power and obscuration of at least 20 %. The average particle size was expressed as the Sauter mean diameter (D[3,2]).
Moisture and water activity
The moisture content of MPPE was determined according to the AOAC 930.15 method (1996). Water activity (aw) was determined at 20°C by using the WAM-1 aw meter (MRC Ltd).
Animals and diets
Eight-week-old male C57BL/6J mice (from the Departamento de Nutricion Animal Facility, Universidad de Chile) were randomly distributed into five experimental groups (n 8 per group): (a) control diet (CD); (b) HFD; (c) HFD + IN; (d) HFD + IN + PPE (HFD + PPE) and (e) HFD + MPPE. Animals (two per cage) were housed in a temperature-controlled room with a 12-h light/dark cycle and allowed free access to drinking water and diet: CD (D12328; 11 % energy as fat) or HFD (D12330; 58 % energy as fat), Research Diets Inc. The detailed nutritional composition of the diets is presented in Table 1. PPE or MPPE supplementation was given through diet in doses of 50 mg/kg per d of TP. This dose is based on previous studies(Reference Soto-Covasich, Reyes-Farias and Torres34) and is equivalent to 4·1 mg/kg per d in humans(Reference Nair and Jacob35), which is safe and achievable in the human population(Reference Chiva-Blanch and Badimon36). Supplemented diets were prepared weekly and kept at −20°C. Diet preparation consisted of mixing the HFD with PPE or MPPE, in sufficient amounts to reach the TP dose according to the TP content of PPE and MPPE previously determined by the Folin–Ciocalteu method, and also in accordance with the daily dietary intake record. IN was added according to the IN content of MPPE. HFD and reformulated diets did not significantly differ in energy content. Treatment was conducted for 14 weeks. Weekly control of body weight and diet intake was performed throughout the whole period. The energy efficiency of body weight was calculated as the total weight gained (mg)/kJ consumed. In the 14th week, the animals were fasted (6–8 h), anaesthetised with ketamine (91 mg/kg) and xylazine (9 mg/kg) and euthanised. Blood samples were obtained by cardiac puncture for further determinations. Also, epidydimal white adipose tissue and interscapular BAT were obtained. All animal procedures in this study were conducted according to ARRIVE Guidelines for Reporting Animal Research(Reference Kilkenny, Browne and Cuthill37). This protocol (CBA #1070) was approved by the institutional Bioethics Committee for Research in Animals (Facultad de Medicina, Universidad de Chile).
Nutritional composition of diets
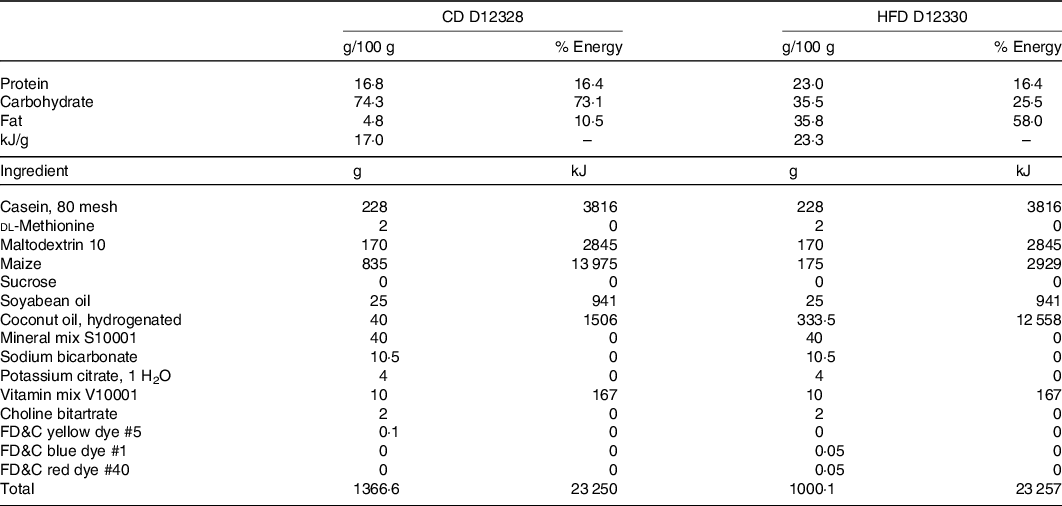
CD, control diet; HFD, high-fat diet.
Intraperitoneal glucose tolerance test
In week 10, mice were fasted (6 h) and injected intraperitoneally with a glucose load (1·5 g/kg in 0·9 % NaCl). They were locally anaesthetised in the tail with lidocaine, and a blood sample was taken at 0, 15, 30, 60 and 120 min after glucose administration(Reference Hira, Ikee and Kishimoto38). Glycaemia (mmol/l) values were obtained with a glucometer (Roche Diagnostics).
Indirect calorimetry
In week 12, four animals per group were submitted to an indirect calorimetry test. Each animal was placed in a different acrylic chamber (259 (depth), 234 (width), 209 (height) mm), without food or water. Levels of O2 and CO2 both inside and outside the chamber were measured in sampling periods of 3 min for 6 h by using the OxyLetPro System PhysioCage (Harvard Apparatus). The respiratory quotient was obtained, and energy expenditure was calculated according to the equations:
 $${\rm{Respiratory}}\,{\rm{quotient}} = {{{\rm{C}}{{\rm{O}}_{\rm{2}}}\ {\rm{production}}} \over {{{\rm{O}}_{\rm{2}}}\ {\rm{consumption}}}}$$
 $$\displaylines{
{\rm{Energy}}\;{\rm{expenditure}}{\mkern 1mu} ({\rm{kcal}}/{\rm{d}}{\mkern 1mu} {\rm{per}}{\mkern 1mu} {\rm{kg}}{\mkern 1mu} {\rm{body}}{\mkern 1mu} {\rm{weigh}}{{\rm{t}}^{3/4}}) \cr
= (3\cdot815 + (1\cdot232 \times {\rm{respiratory}}{\mkern 1mu} {\rm{quotient}})) \cr
\times {{\rm{O}}_2}{\mkern 1mu} {\rm{consumption}} \times {\rm{1}}\cdot44 \cr} $$
$$\displaylines{
{\rm{Energy}}\;{\rm{expenditure}}{\mkern 1mu} ({\rm{kcal}}/{\rm{d}}{\mkern 1mu} {\rm{per}}{\mkern 1mu} {\rm{kg}}{\mkern 1mu} {\rm{body}}{\mkern 1mu} {\rm{weigh}}{{\rm{t}}^{3/4}}) \cr
= (3\cdot815 + (1\cdot232 \times {\rm{respiratory}}{\mkern 1mu} {\rm{quotient}})) \cr
\times {{\rm{O}}_2}{\mkern 1mu} {\rm{consumption}} \times {\rm{1}}\cdot44 \cr} $$
Serum parameters
Before euthanasia and after a 6-h fast, blood was drawn from the tail veins of the animals to obtain glycaemia by using a glucometer (Roche Diagnostics). Insulin levels in serum were determined with an ELISA (Thermo Scientific™) according to the manufacturer’s instructions. Insulin resistance was evaluated through the homoeostasis model assessment index(Reference Parks, Sallam and Mehrabian39). Total cholesterol (TC), HDL-cholesterol and TAG serum levels were determined by using colorimetric kits (FUJIFILM Wako Diagnostics) according to the manufacturer’s instructions. Serum levels of aspartate transaminase and alanine transaminase (ALT) were also determined by using spectrophotometric kits (Wiener Lab.).
Mitochondrial complex IV and citrate synthase activities
Mitochondria were isolated from a BAT pool (three mice per group) by homogenisation and differential centrifugation, according to Cannon and Nedergaard(Reference Cannon and Nedergaard40). Briefly, the tissue was homogenised in a 0·25 m sucrose solution and centrifuged at 8500 g at 4°C for 10 min. The lipid layer was removed and the pellet was resuspended in a sucrose solution with 2 % fatty acid-free bovine serum albumin and centrifuged at 800 g at 4°C for 10 min. The supernatant was centrifuged three consecutive times at 8500 g at 4°C for 10 min, discarding the supernatant and resuspending the pellet in sucrose solution with 2 % fatty acid-free bovine serum albumin. The final sample was resuspended in 100 µl of the buffer. Isolated mitochondria were used to assess mitochondrial function. Complex IV and citrate synthase activities were determined by using MitoCheck® kits 700990 and 701040, respectively (Cayman Chemical), according to the manufacturer’s instructions.
Electron microscopy
Fixed BAT (2·5 % glutaraldehyde) was dissected into bundles of fibres, washed four times with 0·1 m sodium cacodylate buffer and stained with 2 % osmium tetroxide in 0·1 m sodium cacodylate buffer for 2 h. Samples were then washed with water and stained with 1 % uranyl acetate for 2 h. Stained samples were dehydrated on an acetone dilution series and embedded in Epon resin. Finally, 80-nm sections were cut, mounted on electron microscopy grids and examined on a Tecnai G2 T12 transmission electron microscope operated at 80 kV (Philips-FEI). The mitochondrial size was calculated as the mean area of each organelle(Reference Castro-Sepulveda, Jannas-Vela and Fernández-Verdejo41). Mitochondria cristae parameters were evaluated manually by trained personnel, as previously described(Reference Sood, Jeyaraju and Prudent42). Classification of mitochondria cristae was determined as indicated in previous work(Reference Bartsakoulia, Pyle and Troncoso-Chandía43). Morphometric analyses were performed by using ImageJ software(Reference Castro-Sepulveda, Jannas-Vela and Fernández-Verdejo41).
Statistical analysis
Five experimental groups were considered in this protocol design: treated group (HFD + MPPE), negative control (CD), positive control (HFD), wall material control (HFD + IN) and encapsulation control (HFD + PPE). The sample size was calculated considering body weight as the critical variable, statistical power of 80 % and a significance level of 0·05, resulting in n 8 animals per group(Reference Fernández44). PPE and MPPE characterisation results were presented as mean values and standard deviations. Results regarding the animal model were expressed as medians and interquartile ranges. Data were analysed by a Kruskal–Wallis followed by Dunn’s post hoc test. All statistics were performed by using Graphpad Prism 6.07 software.
Results
Microparticles of pomegranate peel extract presented a high encapsulation efficiency and regular spherical shapes
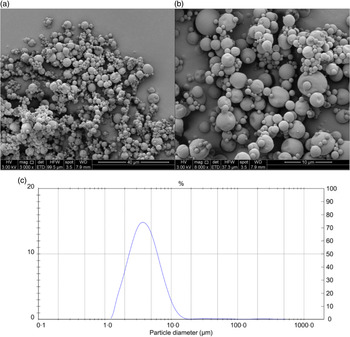
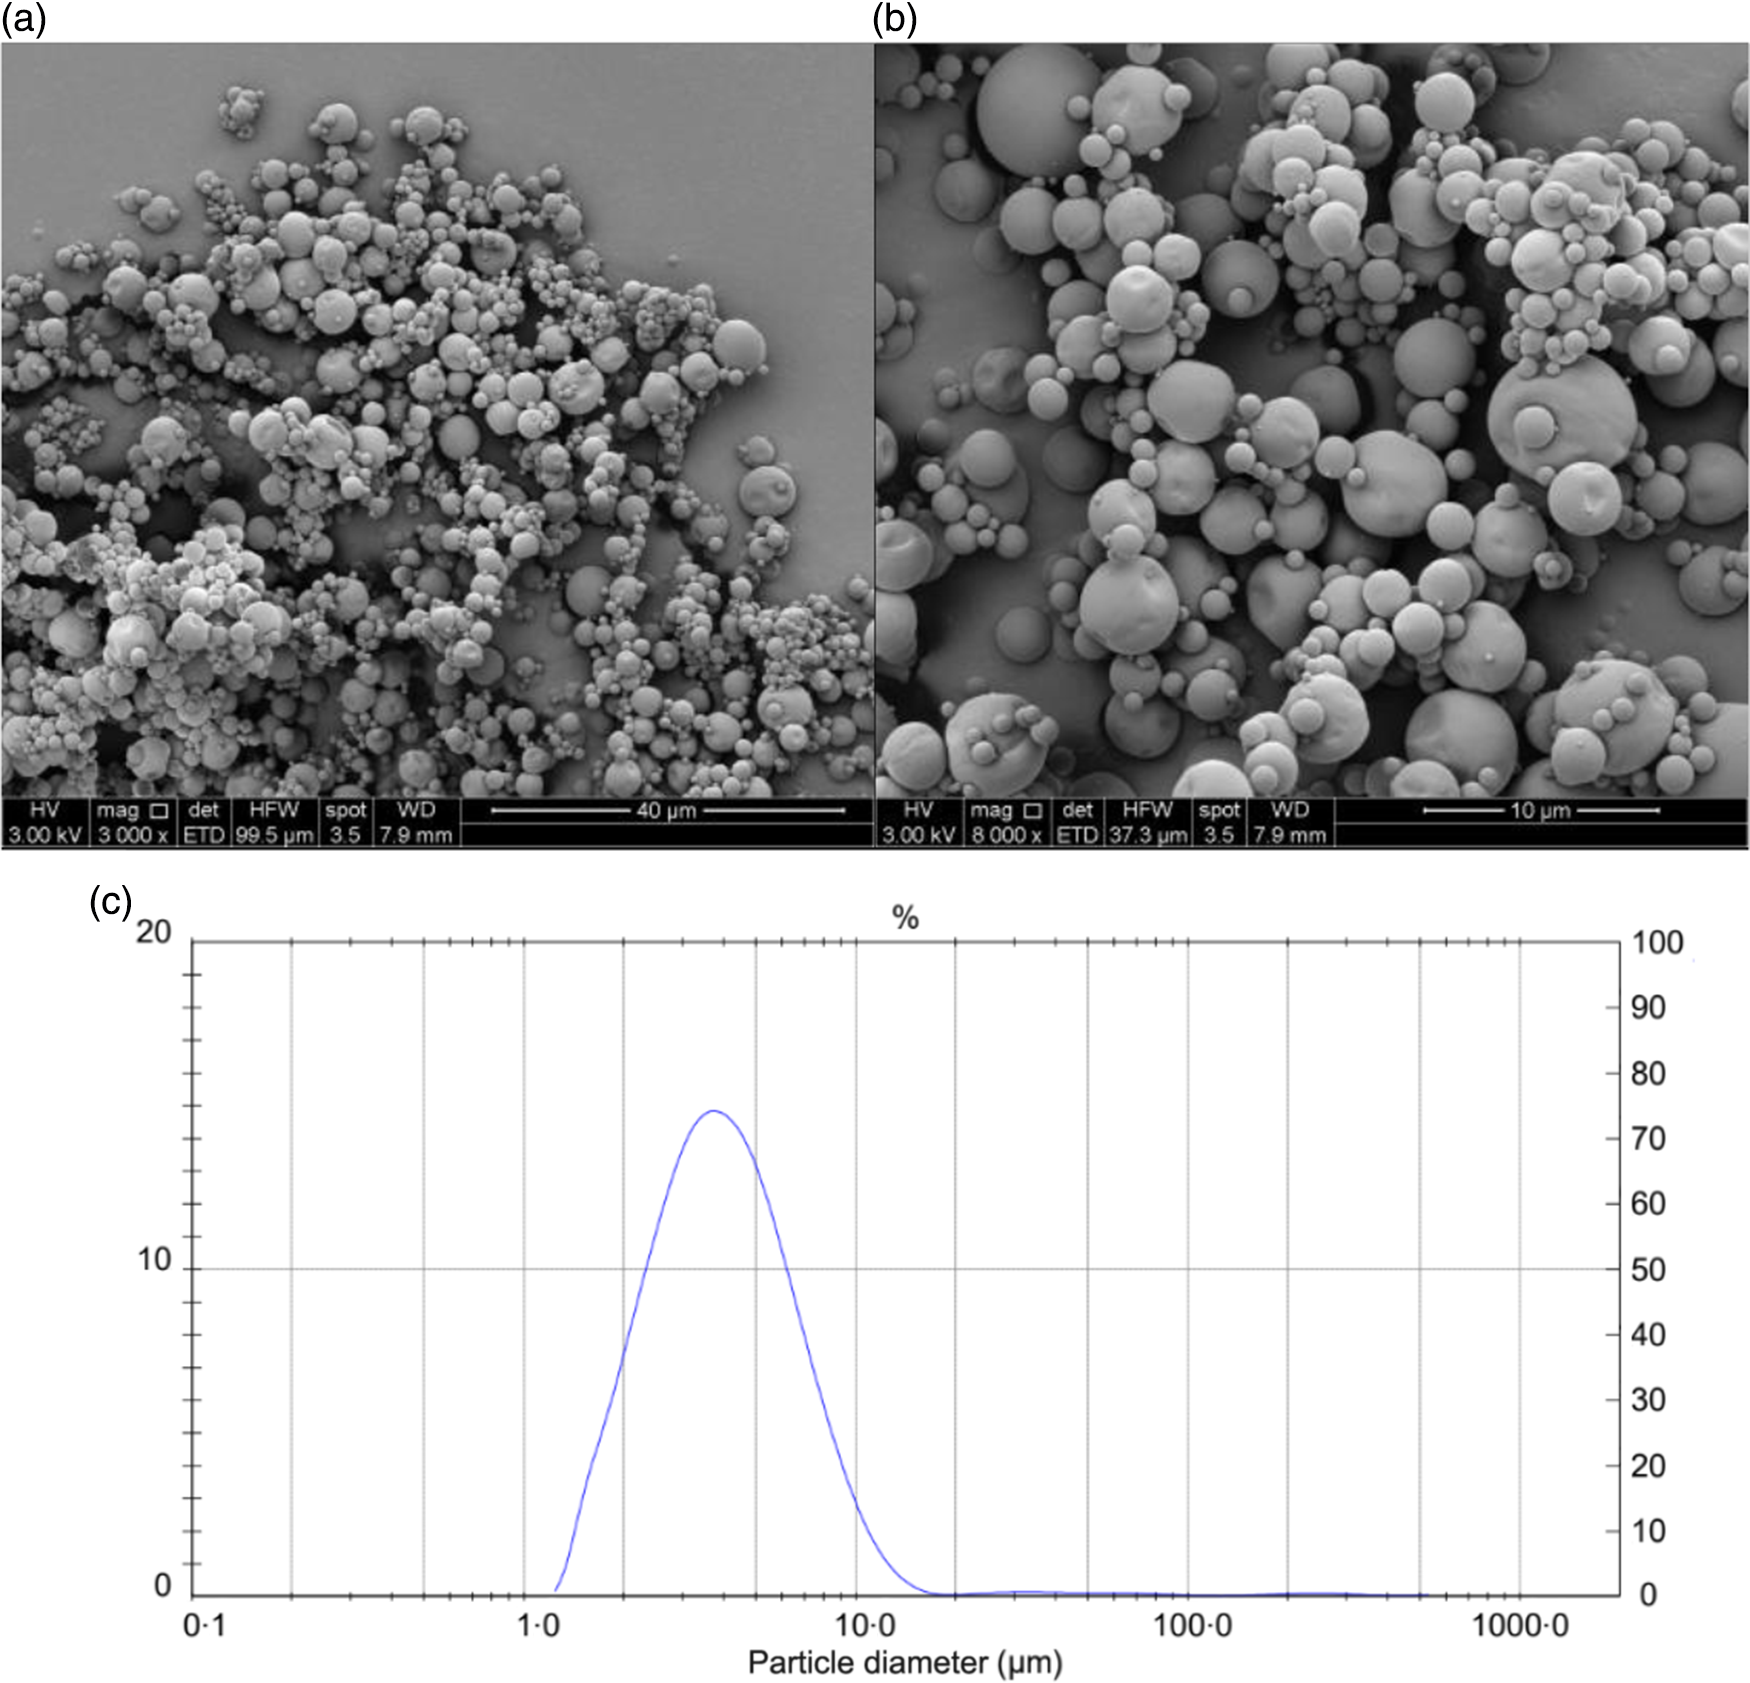
The results of the chemical and physical characterisation of PPE and MPPE are presented in Table 2. PPE and MPPE presented a high TP and punicalagin content with elevated antioxidant activity as shown by FRAP, DPPH and ORAC results. MPPE presented a high EE (75·58 (sd 2·01) %) and low aw (0·20 (sd 0·005)) (Table 2). Fig. 1 shows the scanning electron microscopy microphotograph and particle size distribution of MPPE. Microparticles presented regular and spherical shapes with a tendency to agglomeration (Fig. 1(a) and (b)). The surface of the particles was porous, unindented and smooth, with most of the particles ranging from 1 to 10 µm. Sauter mean (D[3,2]) was 3·53 µm, and size distribution was unimodal (Fig. 1(c)).
Chemical and physical characterisation of encapsulated and non-encapsulated pomegranate-peel extract
(Mean values and standard deviations)
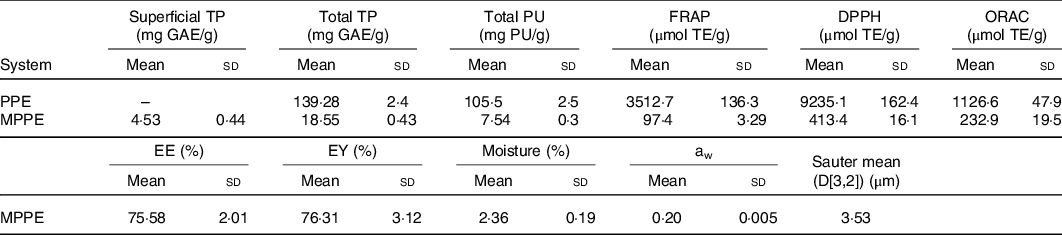
TP, total polyphenols; GAE, gallic acid equivalents; PU, punicalagin; FRAP, ferric reducing antioxidant power; TE, Trolox equivalents; DPPH, free radical 2,2-diphenyl-1-picrilhydrazil; ORAC, oxygen radical absorption capacity; PPE, pomegranate peel extract; MPPE, microparticles of pomegranate peel extract; EE, encapsulation efficiency; EY, encapsulation yield; aw, water activity.
Morphology and particle size distribution of microparticles obtained under optimal conditions. (a) Microparticle morphology at 3000×; (b) microparticle morphology at 6000×; (c) particle size distribution in µm.
Microparticles of pomegranate peel extract prevented excess body weight gain
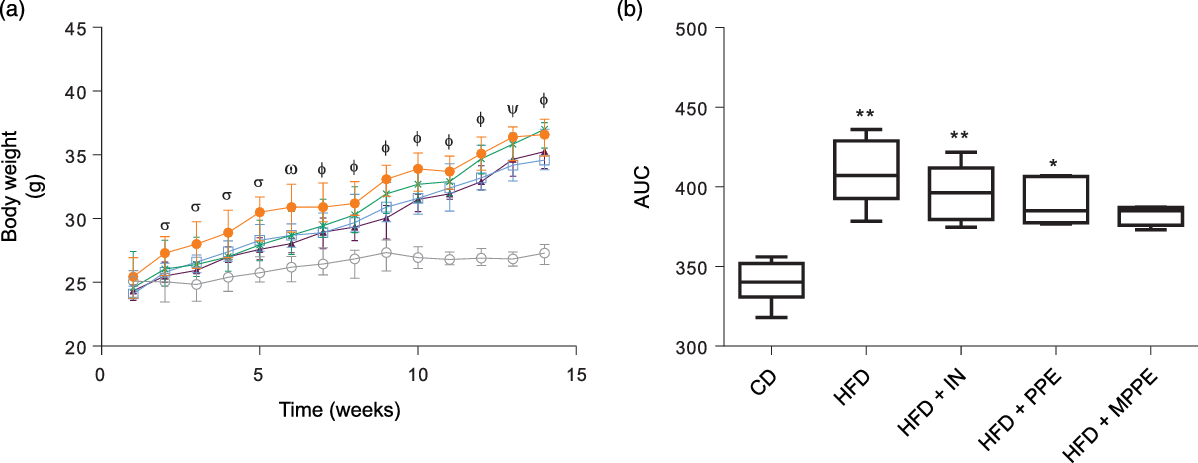
Body weight (Fig. 2(a)) was higher in the HFD group than in the CD group from week 2 until the end of the treatment (P < 0·001). HFD + IN and HFD + PPE also presented higher body weight compared with the CD group from weeks 6 and 7, respectively (Fig. 2(a)). Although HFD + MPPE showed a trend for higher body weight gain compared with the CD group, the difference was not significant (Fig. 2(b) and Table 3). As shown in Table 3, the HFD group showed less dietary intake compared with the CD group but a higher energy intake (P = 0·02). HFD + IN and HFD + MPPE also had a higher energy intake than the CD group did (Table 3). Nonetheless, the HFD + MPPE group showed a lower energy efficiency compared with the other HFD-fed groups (P = 0·001), trending to gain less weight per kJ consumed (Table 3). Also, the weight of epididymal adipose tissue was higher in HFD-fed groups (P = 0·001) than in CD. HFD + MPPE had no difference compared with the control group (Table 3). The relation between BAT and epididymal fat was lower in HFD and HFD + IN (P = 0·002) than in CD (Table 3). Daily theoretical TP intake (mg/kg per d) in PPE-treated groups was estimated at 46·02 (18·61) for HFD + PPE and 50·46 (3·39) for HFD + MPPE, showing no difference between these groups (Table 3).
Body weight evolution. (a) Body weight gain in time (weeks); (b) AUC of body weight gain. CD, control diet; HFD, high-fat diet; IN, inulin; PPE, pomegranate peel extract; MPPE, microparticles of pomegranate peel extract. Values are medians and interquartile ranges of body weight (g) for 4–8 mice per experimental group. Some animals were not included in the analysis because of outlier detection. In panel (a), differences (P < 0·05) from the CD group are indicated by Greek symbols, σ: HFD different from CD; ω: HFD and HFD + PPE different from CD; Φ: HFD, HFD + IN and HFD + PPE different from CD; Φ: HFD and HFD + IN different from CD. In panel (b), differences from the CD group are indicated by * (P < 0·05) and ** (P < 0·01). Data were analysed using the Kruskal–Wallis test, followed by Dunn’s post-test. ![]() , CD;
, CD; ![]() , HFD;
, HFD; ![]() , HFD + IN;
, HFD + IN; ![]() , HFD + PPE;
, HFD + PPE; ![]() , HFD + MPPE.
, HFD + MPPE.
General parameters per experimental group (4–8 mice per experimental group)†
(Medians and interquartile ranges (IQR))
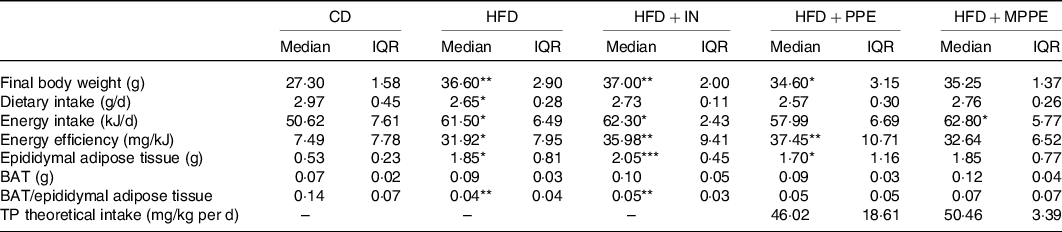
CD, control diet; HFD, high-fat diet; IN, inulin; PPE, pomegranate peel extract; MPPE, microparticles of pomegranate peel extract, BAT, brown adipose tissue; TP, total polyphenols.
Median value was significantly different from that of the CD group: * P < 0·05, ** P < 0·01.
† Some animals were not included in the analysis, either by the nature of the methodology or outlier detection. Data were analysed using the Kruskal–Wallis test, followed by Dunn’s post-test. TP theoretical intake was analysed with Mann–Whitney U test.
Microparticles of pomegranate peel extract prevented glucose intolerance and total cholesterol increase
At the end of the treatment (week 14), HFD and HFD + IN groups had higher glycaemia (P = 0·007) compared with the CD group (Table 4). HFP + PPE and HFD + MPPE showed no significant differences compared with the control group. Homoeostasis model assessment index was calculated to evaluate insulin resistance. Insulin levels and homoeostasis model assessment index were significantly higher in the HFD than in the CD group (P = 0·005) (Table 4). The other experimental groups had no significant difference with the control group (Table 4). MPPE supplementation also prevented TC increase, showing no significant difference as compared with the CD group (Table 4). On the other hand, HDL-cholesterol was higher (P = 0·006) in PPE-treated groups (Table 4). No difference between groups was observed in TAG, aspartate transaminase and ALT serum levels (Table 4).
Serum parameters per experimental group (4–8 mice per experimental group)†
(Medians and interquartile ranges (IQR))
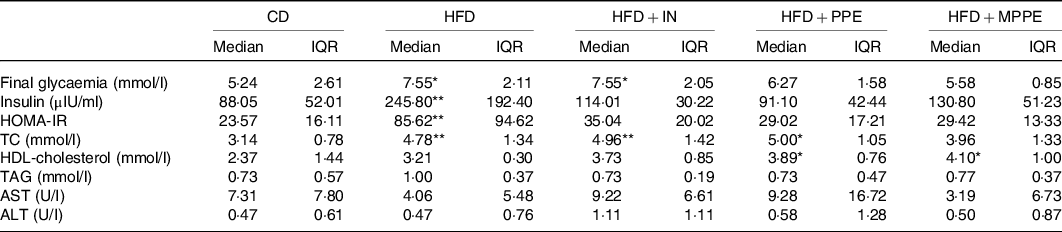
CD, control diet; HFD, high-fat diet; IN, inulin; PPE, pomegranate peel extract; MPPE, microparticles of pomegranate peel extract; HOMA-IR, homoeostatic model assessment for insulin resistance; TC, total cholesterol; AST, aspartate transaminase; ALT, alanine transaminase.
Median value was significantly different from that of the CD group: * P < 0·05, ** P < 0·01.
† Some animals were not included in the analysis, either by the nature of the methodology or outlier detection. Data were analysed using the Kruskal–Wallis test, followed by Dunn’s post-test.
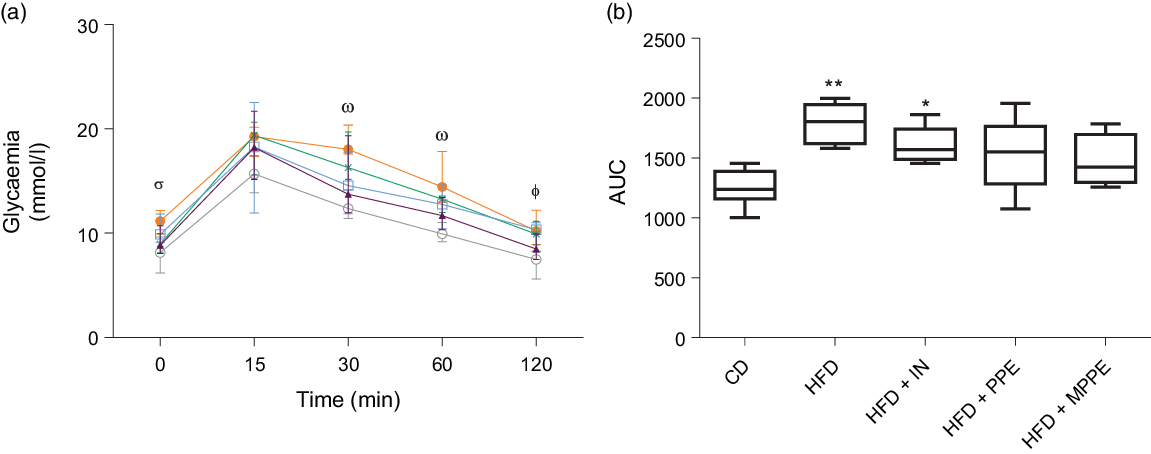
An intraperitoneal glucose tolerance test was conducted in week 10 (Fig. 3) to assess glucose tolerance. HFD and HFD + IN presented higher glycaemic response than the control group did at times 30, 60 and 120 min (Fig. 3(a)). HFD + PPE also showed higher glycaemia (P = 0·009) than shown by the CD group at 120 min (Fig. 3(a)). HFD + MPPE showed no significant difference compared with the CD group in response to an intraperitoneal glucose load (Fig. 3(a) and (b)).
Intraperitoneal glucose tolerance test. (a) Glycaemia (mmol/l) at times 0, 15, 30, 60 and 120 min. (b) Blood glucose AUC. CD, control diet; HFD, high-fat diet; IN, inulin; PPE, pomegranate peel extract; MPPE, microparticles of pomegranate peel extract. Values are medians and interquartile ranges of body weight (g) for 4–8 mice per experimental group. Some animals were not included in the analysis, either by the nature of the methodology or outlier detection. In panel (a), differences (P < 0·05) from the control group are indicated by Greek symbols, σ: HFD different from CD; ω: HFD and HFD + IN different from CD; Φ: HFD, HFD + IN, and HFD + PPE different from CD. In panel (b), differences from the CD group are indicated by * (P < 0·05) and ** (P < 0·01). Data were analysed using the Kruskal–Wallis test, followed by Dunn’s post-test. ![]() , CD;
, CD; ![]() , HFD;
, HFD; ![]() , HFD + IN;
, HFD + IN; ![]() , HFD + PPE;
, HFD + PPE; ![]() , HFD + MPPE.
, HFD + MPPE.
Microparticles of pomegranate peel extract supplementation resulted in higher mitochondrial complex IV activity and prevented high-fat diet-induced mitochondrial cristae alteration, with no difference in energy expenditure
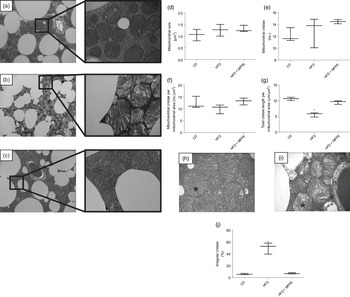
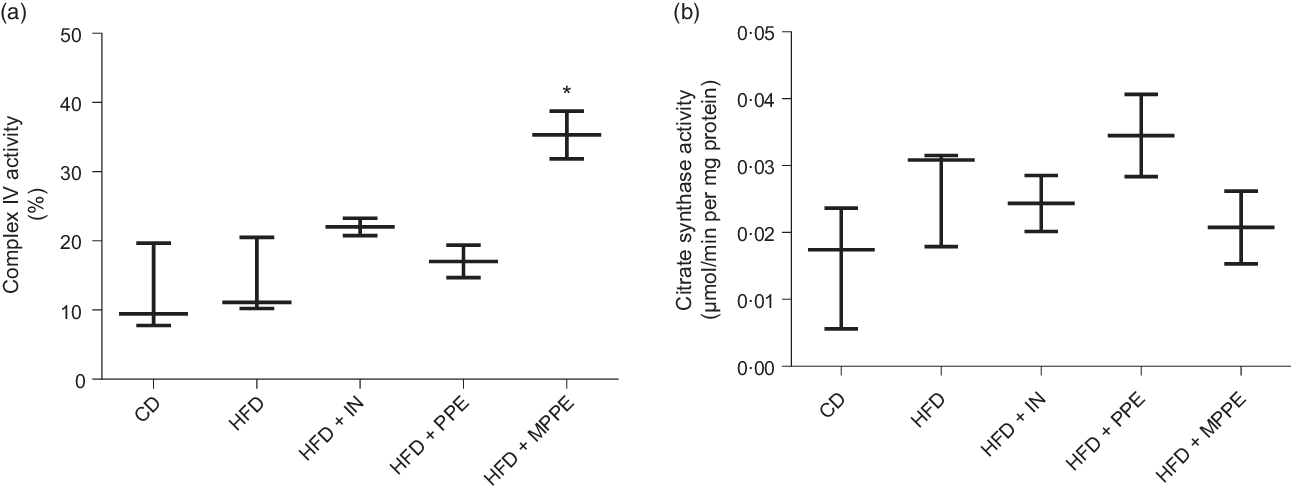
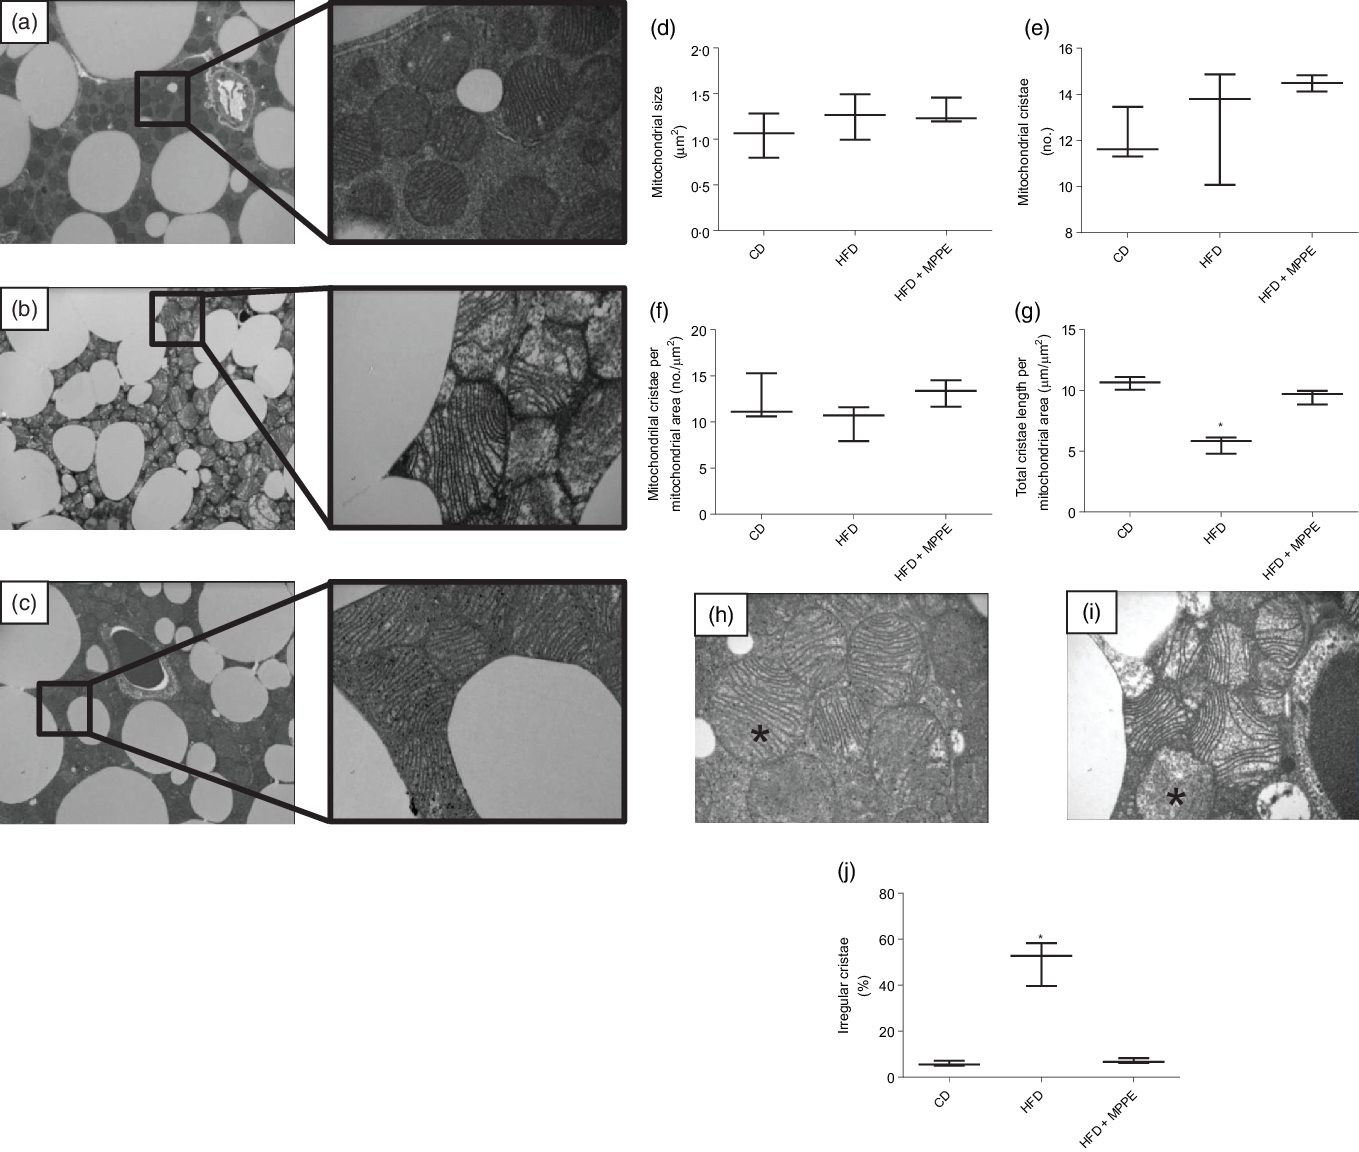
Mitochondrial function was evaluated by means of assaying complex IV activity and citrate synthase activity in BAT-isolated mitochondria (Fig. 4). The HFD + MPPE group presented the highest complex IV activity in relation to the CD group (P = 0·03), while the HFD + PPE had no significant effect (Fig. 4(a)). However, no differences were found in citrate synthase activity (Fig. 4(b)). As mitochondrial complex IV activity increased in the HFD + MPPE group and mitochondrial complexes activity depended on mitochondrial cristae, we evaluated mitochondrial morphology and cristae structure in this group. The representative images of BAT mitochondria are shown in Fig. 5(a)–(c), which correspond to CD, HFD and HF + MPPE, respectively. Regular and irregular mitochondrial cristae are shown in Fig. 5(h) and (i). No differences in mitochondrial size or mitochondrial cristae number were found between CD, HFD and HFD + MPPE groups (Fig. 5(d)–(f)). However, mitochondria cristae length decreased (Fig. 5(g)) and that of mitochondrial irregular cristae increased (Fig. 5(j)) in the HFD group in comparison with the CD group (P = 0·02). Interestingly, HFD + MPPE group showed no alterations in mitochondrial cristae length or structure (Fig. 5(g) and (j)). Finally, although energy expenditure showed a trend toward higher values in PPE-treated groups, it was not significant (data not shown).
Mitochondrial activity. (a) Complex IV activity (%); (b) citrate synthase activity (µmol/min per mg protein). CD, control diet; HFD, high-fat diet; IN, inulin; PPE, pomegranate peel extract; MPPE, microparticles of pomegranate peel extract. Values are medians and interquartile ranges for 2–3 samples per experimental group. Some animals were not included in the analysis by the nature of the methodology. Differences from the control group are indicated by * (P < 0·05). Data were analysed using the Kruskal–Wallis test, followed by Dunn’s post-test.
Mitochondrial structure and size. (a) Control diet (CD) representative image of brown adipose tissue (BAT) mitochondria (4200X – 20500X); (b) high-fat diet (HFD) representative image of BAT mitochondria (4200X – 20500X); (c) HFD + microparticles of pomegranate peel extract (MPPE) representative image of BAT mitochondria (4200X – 20500X); (d) mitochondrial size (µm2); (e) mitochondrial cristae (no.); (f) mitochondrial cristae per mitochondrial area (no./µm2); (g) total cristae length per mitochondrial size (µm/m2); (h) representative image of BAT mitochondrial regular cristae; (i) representative image of BAT mitochondrial irregular cristae; (j) irregular mitochondrial cristae (%). Values are medians and interquartile ranges for three mice per experimental group. Some animals were not included in the analysis by the nature of the methodology. Differences from the control group are indicated by * (P < 0·05). Data were analysed using the Kruskal–Wallis test, followed by Dunn’s post-test.
Discussion
The results of this study showed promissory outcomes of MPPE treatment. We evaluated the effect of MPPE on metabolic alterations related to obesity induced by an HFD in mice. We found that MPPE prevented excessive body weight increase, glucose intolerance and TC rise. Also, we evaluated BAT mitochondrial structure and function. MPPE increased mitochondrial complex IV activity and preserved regular mitochondrial cristae. Prior mice supplementation, PPE and MPPE were obtained and characterised. The TP content of extracts highly depends on the extraction methodology and fruit cultivar. The PPE TP content obtained in this study (139·28 (sd 2·4) mg GAE/g) was similar to that reported before for the same cultivar but extracted by ultrasonic-assisted extraction (129 mg GAE/g)(Reference Goula and Lazarides45). However, the antioxidant capacity of PPE was higher than previously described for DPPH in Wonderful cultivars (1115–2910 µmol Trolox equivalents/g)(Reference Amyrgialaki, Makris and Mauromoustakos46). EE was near 76 %, similar to what reported before for MPPE of 73·1 %(Reference Bustamante, Hinojosa and Robert47). EE represents the amount of phenolics trapped in the microparticles, influenced by operational and formulation variables. In this sense, literature reported that inlet air temperatures above 160°C and extract/wall material rates in the range of 1:2–1:3 allowed reaching the higher EE values(Reference Çam, Erdoğan and İçyer19), as observed in this research. Besides, MPPE TP content (18·55 (sd 0·43) mg GAE/g) was lower than that observed for MPPE elaborated by spray drying with maltodextrin (69·7–287·3 mg GAE/g)(Reference Çam, Erdoğan and İçyer19). This fact could be explained by the type and concentration of the wall material that influenced core material volatility throughout crust formation during drying and, therefore, retention of the active compounds within the microparticle(Reference Finney, Buffo and Reineccius48). However, TP retention, defined as a relation between the amount of active compounds in microparticles and the active compound in the infeed solution(Reference Tomsone, Galoburda and Kruma49), was 77·8 % (data not shown). These TP losses could be explained by the quick contact of polyphenols with hot air and oxygen during crust formation(Reference Çam, Erdoğan and İçyer19). However, these values are among the expected losses due to spray drying(Reference Tomsone, Galoburda and Kruma49).
Regarding MPPE morphology and size, the absence of cracks on the particle surface could increase the bioactive compounds trapped inside. A similar particle morphology has been reported for gallic acid microparticles elaborated with IN as wall material(Reference Robert, García and Reyes50). Particle size depends on the process and feed parameters. Larger particle sizes have been reported for MPPE elaborated by spray drying with maltodextrin (10 µm)(Reference Çam, Erdoğan and İçyer19). Also, the aw (0·20 (sd 0·005)) was ranged between 0·2 and 0·4, which is usually described as a range where encapsulated compounds could reach their higher stability during storage(Reference Ahn, Kim and Seo51).
PPE and MPPE were given to HFD-fed mice in sufficient amounts through their diet to reach 50 mg/kg per d of TP for 14 weeks. Results showed that supplementation with MPPE prevented excessive weight gain in mice fed on HFD. Although we did not find data regarding the effect of MPPE on body weight, other authors have reported beneficial effects of supplementation with PPE or its metabolites on limiting body weight increment(Reference Ibrahim52,Reference Xia, Shi and Xie53) . Nevertheless, the effect on body weight is still controversial. Zhang et al.(Reference Zhang, Yang and Henning54) reported that mice supplemented with pomegranate extract alone or in combination with IN (non-encapsulated) had no difference in final body weight compared with the non-treated group. Also, tannins have been described as antinutrients because they can bind to proteins and other nutrients impairing their bioavailability(Reference Popova and Mihaylova55). Nevertheless, microencapsulation prevents these possible interactions since it protects the encapsulated bioactive compounds(Reference Dias, Ferreira and Barreiro56); thus, the limitation of MPPE on body weight increment is probably not an antinutritional consequence. Epididymal adipose tissue weight, which is considered a visceral fat pad, was also higher in HFD-fed groups than in CD, except for HFD + MPPE. Although there were no differences in BAT weights, only HFD and HFD + IN presented a lower relation between BAT and epididymal fat weights compared with CD, which supports the fact that body composition changes were also partially prevented by MPPE supplementation.
Serum parameters were also evaluated. PPE, microencapsulated or not, showed no differences with CD group in terms of final glycaemia or homoeostasis model assessment index and higher levels of HDL-cholesterol compared with the other groups. MPPE also prevented excessive TC increase. Previous studies reported similar serum lipid levels and fasting glycaemia in animal obesity models(Reference Ibrahim52,Reference Harzallah, Hammami and Kępczyńska57) . These results are also consistent with human data reported by Grabež et al.(Reference Grabež, Škrbić and Stojiljković58), who studied for 8 weeks the effect of PPE supplementation on subjects with diabetes mellitus type 2, resulting in higher HDL-cholesterol levels and improved long-term glycaemic control. PPE-treated groups also prevented glycaemia increase in response to a glucose load, as previously reported(Reference Harzallah, Hammami and Kępczyńska57). Concordantly, a meta-analysis evaluating the effect of products containing ellagitannins and anthocyanins on cardiometabolic biomarkers reported that ellagitannins intake resulted in several benefits: reduction in TC, waist circumference, LDL-cholesterol, TAG and glucose levels in obese/overweight subjects(Reference García-Conesa, Chambers and Combet59).
Regarding HFD-induced alterations in mitochondrial function and cristae structure, no differences were found between the CD group and HFD-fed groups in citrate synthase activity (a marker of mitochondrial density(Reference Holloszy, Oscai and Don60)) or mitochondrial size (a marker of mitochondrial dynamics(Reference Kowaltowski, Menezes-Filho and Assali61)). However, HFD-MPPE presented a higher complex IV activity which is considered a marker of increased oxidative phosphorylation system (OXPHOS) activity(Reference Rustin, Chretien and Bourgeron62). As the OXPHOS activity depends on the mitochondrial cristae integrity(Reference Gilkerson, Selker and Capaldi63), we evaluated mitochondrial cristae structure by electron microscopy. The most remarkable finding was that mitochondria of the HFD group presented a minor mitochondrial cristae length and a higher percentage of mitochondria with aberrant cristae compared with the control group. Abnormal mitochondrial cristae structure in adipose tissue was associated with low OXPHOS activity and thermogenic instability in a genetic mice model with the metalloendopeptidase (OMA1) gene ablation(Reference Quirós, Ramsay and Sala64). The loss of mitochondrial OMA1 alters mitochondrial optic atrophy 1, one of the factors that control mitochondrial dynamics and cristae structure(Reference Quirós, Ramsay and Sala64,Reference Wu, Zhao and Shah65) . The administration of a pomegranate extract with 40 % punicalagin prevented optic atrophy 1 decrease in heart mitochondria of mice fed with an HFD(Reference Cao, Xu and Pu15). On the other hand, abnormal cristae structure is associated with oxidative stress and toxic accumulation of reactive oxygen species(Reference Eramo, Lisnyak and Formosa66). Mice supplemented with MPPE had no difference with the CD group in the percentage of irregular BAT mitochondrial cristae, while the HFD group showed a higher percent of aberrant cristae (>50 %). It has been reported that pretreatment with punicalagin in HepG2 cells exposed to 250 µm palmitate for 24 h prevents loss of mitochondrial membrane potential and production of reactive oxygen species by inducing the transcription factor NF-E2-related factor 2 pathway(Reference Yan, Sun and Wang67). The protective effect of MPPE observed in this study agrees with its high TP content and antioxidant activity. Following an exhaustive literature search, we did not find studies on polyphenols and mitochondrial cristae structure maintenance in BAT. However, other authors have reported that pomegranate peel polyphenols and their metabolites increase mitochondrial activity in different tissues(Reference Cao, Xu and Pu15,Reference Xia, Shi and Xie53) .
Nevertheless, MPPE have been studied mainly as functional ingredients(Reference Çam, Erdoğan and İçyer19,Reference Topkaya and Isik20) without considering a biological validation. In the present study, MPEE showed more promising results than non-encapsulated PPE did, including the prevention of excessive body weight gain and the increase in mitochondrial complex IV activity, even though TP intake did not differ between PPE- and MPPE-treated groups. The study results suggest that the preservation of the mitochondria cristae structure in BAT could have an essential role in preserving body weight, TC and in the prevention of insulin resistance in mice fed with an HFD and supplemented with MPPE.
Regarding microencapsulation effect, IN and pomegranate extract supplementations have shown more significant metabolic effects when administered combined than alone, probably due to the prebiotic effect of both components(Reference Zhang, Yang and Henning54,Reference Yang, Zhang and Henning68) . In order to determine that the effects were due to microencapsulation and not to the combination of IN + PPE, we included encapsulation control groups (HFD + IN and HFD + PPE). In this sense, IN is a polysaccharide that remains stable in its passage through the upper part of the gastrointestinal tract(Reference Rajpurohit, Sharma and Sharma26,Reference de Vos, Faas and Spasojevic69) . Once the microparticle reaches the colon, it releases its content allowing PPE polyphenols to be metabolised by the gut microbiota into urolithins, which have been identified as ellagitannins bioactive metabolites(Reference Kang, Buckner and Shay27). Urolithin A has shown that it prevents body weight increase by enhancing non-shivering thermogenesis in BAT and energy expenditure, mediated by an elevation of triiodothyronine in BAT in mice fed with an HFD(Reference Xia, Shi and Xie53). Urolithin A administration also increases skeletal muscle mitochondrial biogenesis markers in humans(Reference Andreux, Blanco-Bose and Ryu17).
There are many studies on the positive health effects of PPE and ellagitannins(Reference Cao, Xu and Pu15,Reference Sun, Yan and Frost18,Reference Ibrahim52) . However, no studies are there on the biological effect of MPPE on obesity models. Nevertheless, other bioactive compounds such as curcumin have shown higher bioavailability when administered encapsulated than as a free compound, which could impact the polyphenol’s biological activity(Reference Vitaglione, Barone Lumaga and Ferracane70). Thus, microencapsulation of PPE offers many advantages: (i) it improves the stability of encapsulated compounds against environmental factors (light, oxygen and temperature), preventing a decrease in the shelf life of the product that contains them(Reference Đorđević, Balanč and Belščak-Cvitanović21); (ii) the encapsulation improves the bioaccessibility of bioactive compounds and possibly their bioavailability, avoiding bonding and interaction with other nutrients or food matrix components(Reference Kasote, Jayaprakasha and Patil22,Reference Dias, Ferreira and Barreiro56) and (iii) it allows targeting the bioactive compounds to a specific anatomical size(Reference Alemzadeh, Hajiabbas and Pakzad71). In this case, to the colon, where ellagitannins are metabolised by gut microbiota(Reference Kang, Buckner and Shay27); (iv) it allows masking flavours (e.g. tannins astringency) that may be unpleasant for the consumer(Reference Çam, Erdoğan and İçyer19,Reference Dias, Ferreira and Barreiro56) and (v) it enables diverse applications considering the micro size and low aw of the microparticles(Reference Çam, Erdoğan and İçyer19,Reference Đorđević, Balanč and Belščak-Cvitanović21,Reference Dias, Ferreira and Barreiro56) . These advantages could potentiate the described effects for human health.
In conclusion, polyphenols can be extracted from an agro-industrial residue (i.e. pomegranate peel) and microencapsulated to obtain stable microparticles with high EE, which can be incorporated into different matrices in standardised and validated doses. In this study, MPPE prevented HFD-induced body weight gain and associated metabolic disturbances, potentially by triggering BAT mitochondrial complex IV activity and preserving mitochondrial cristae morphology in mice. However, the role of urolithins and other potential metabolic pathways regarding the effect of MPPE should be further analysed. These results are pioneers in this matter and correspond to an initial approach to describing the effect MPPE had on an obesity model. It is necessary to conduct a clinical trial to assess the effects of MPPE on humans.
Acknowledgements
This work was supported by the Departamento de Nutricion, Facultad de Medicina, Universidad de Chile. The authors thank Greys Lagos and Karla Vasquez for technical assistance, Kharen Espinosa for animal care support and Elia Vasquez for helping with mice diet preparation. The authors thank professors Luis Videla (Facultad de Medicina, Universidad de Chile) and Carolina Valenzuela (Facultad de Ciencias Veterinarias y Pecuarias, Universidad de Chile) for providing chemicals/reagents and facilitating the use of the mini spray dryer, respectively. This work was also supported by FIA (PYT-2018-0309) and FONDECYT (11169541) and by the Unidad de Microscopia Avanzada, Universidad Catolica, Chile.
This work was financially supported by the Agencia Nacional de Investigacion y Desarrollo (ANID; D. F. G.-D., FONDECYT grant number 1171550 and F. E., doctoral scholarship CONICYT-PFCHA/Doctorado Nacional/2017-21170196). ANID had no role in the design, analysis or writing of this article.
D. F. G.-D., P. J., P. G. and F. E. formulated the research question and designed the experiments. A. B., C. P.-A., M. C.-S. and F. E. performed the experiments. D. F. G.-D., A. B., M. C.-S. and F. E. analysed the data. D. F. G.-D., P. J., A. B., P. G., R. V., M. C.-S. and F. E. wrote the article. All authors read and approved the final manuscript.
There are no conflicts of interest.