


I. Introduction
Recent policy debates in Europe highlight the need for a better understanding of the broader economic effects of pension fund activities. The European Commission has emphasized the critical role of expanding the occupational pensions sector within the European Union, aiming to boost investment, deepen capital markets, and promote firm growth across the region (European Commission (2025)). Similarly, the U.K. government is pursuing major reforms of the domestic pension sector with the goal of increasing the flow of pension fund investment into the real economy (HM Treasury (2025)). Pension funds are widely recognized as key providers of long-term capital, supporting economic growth and development by financing substantial, long-horizon projects (OECD (2019), Andonov, Kräussl, and Rauh (Reference Andonov, Kräussl and Rauh2021)).
Despite their increasing prominence, the overall economic impact of pension funds remains insufficiently understood primarily due to the dual nature of their effects on the firms in which they invest. On the one hand, pension funds could improve firm productivity in several ways. The provision of long-term capital by pension funds aligns with the long-term investments required for substantial projects, particularly in scenarios where traditional sources of capital are scarce. By providing stable and patient capital, pension funds enable firms to undertake risky but potentially highly rewarding projects that might otherwise go unfunded (Cremers and Pareek (Reference Cremers and Pareek2016), Artiga González, van Lelyveld, and Lučivjanská (Reference Artiga González, van Lelyveld and Lučivjanská2020)). Moreover, pension funds may participate in governance and strategic decisions, further improving the productivity of firms through active engagement. On the other hand, research, particularly from earlier studies based on listed firms in the United States, has cast doubt on the effectiveness of pension fund involvement, especially when it takes the form of shareholder activism. For example, Wahal (Reference Wahal1996) finds little evidence that such activism by public pension funds leads to long-term improvements in firm performance. Related research has also indicated that pension funds’ investment decisions can be pressured into strategies that do not align with maximizing shareholder value. Such influence, which we expect to be particularly relevant for listed firms as they are visible and large contributors to the economy, can result in governance issues, thereby adversely impacting firm performance (Jiao and Ye (Reference Jiao and Ye2013), Andonov, Hochberg, and Rauh (Reference Andonov, Hochberg and Rauh2018)).
This study takes a first step toward addressing this ambiguity by documenting empirical patterns in the relationship between pension funds’ equity investments and firms’ productivity using high-quality data. A central contribution of this study lies in the unique data it employs. Drawing on detailed Danish administrative registers, we use the matched employer–employee data set for the 2003–2019 period combined with a comprehensive data set on the ownership of Danish firms to construct a rich firm-level panel that allows us to link pension fund ownership to both unlisted and listed firms, measure productivity, and trace corporate ownership structures with a high degree of accuracy. Denmark is a particularly fitting setting for this analysis. The institutional setup and data infrastructure enable us to identify pension fund equity stakes, including indirect holdings through intermediaries, and to match them to firms’ characteristics over time, making it possible to study how firms’ productivity relates to pension fund investments beyond the publicly listed sector that dominates the existing literature. Unlike previous studies such as Aghion, Van Reenen, and Zingales (Reference Aghion, Van Reenen and Zingales2013), which focus exclusively on listed firms, our analysis incorporates the universe of Danish unlisted (and listed) firms and their ultimate owners. Because unlisted firms constitute the vast majority of firms and account for a substantial share of employment and value added, this provides a more representative picture of the Danish economy and the potential role of pension funds as investors in Denmark. Indeed, Danish pension funds play an important role in the domestic economy: At the end of 2021, assets in retirement savings plans in Denmark were the largest as a share of GDP among OECD countries, standing at over 230% (OECD (2023)). Moreover, the Danish pension system is frequently described as one of the best in the world (Mercer (2023)). The granularity of our data permits a clear distinction between investor types, facilitating direct comparisons of pension funds with other institutional investors. In the bulk of our empirical analysis, we focus on the sample of unlisted firms, while, for comparison, we conduct a separate refined analysis limited to listed firms.
Armed with this data set, we find that pension fund investment in unlisted firms is associated with productivity differences of approximately 3%–5% in periods following the investment.Footnote 1 A major challenge in interpreting this association is that pension funds may selectively invest in firms that are already more productive. Although fully addressing selection is difficult without exogenous variation, we adopt several strategies to mitigate these concerns. We conduct our analysis on a matched sample to reduce selection on observables. We show in an event-study framework that treated and control firms feature nearly identical pretrends in productivity. We estimate the relationship between pension fund investment and firms’ productivity directly in a structural production function framework that allows us to control for past productivity and partially attenuate selection driven by firm heterogeneity, particularly the possibility that pension funds select firms based on their productivity. Beyond documenting this positive association, our analysis provides suggestive evidence on the economic mechanisms at play. First, the association is stronger for firms that receive larger equity stakes, which is consistent with a supply-of-financing channel. Second, the association grows with the length of the investment, indicating the relevance of a long-term-commitment channel. Third, by distinguishing between direct and indirect equity positions, we provide tentative evidence for a governance or engagement channel. Productivity gains are concentrated in firms where pension funds are closer in the ownership chain, that is, direct owners or indirect owners with few intermediary layers, consistent with the view that proximity facilitates oversight and board influence. We also document that pension fund entry is followed by an increase in the number of a firm’s additional investors, providing suggestive support for a signaling channel. Taken together, these patterns indicate that pension funds appear to be most strongly associated with higher firm-level productivity when they provide substantial, stable, and long-term capital and when their ownership position allows for meaningful engagement with the firm. These mechanisms are most likely to matter among unlisted firms, where financing constraints are more binding, and governance structures are more responsive to large, long-term shareholders. In fact, we find no significant association between pension fund investment and productivity among listed firms, where alternative financing sources are more accessible.
Our findings, while rooted in the Danish context, have broader relevance, but there are also clear and important limits to their external validity. Denmark’s uniquely mature and well-regulated pension system may strengthen the mechanisms we identify, such as the supply-of-financing and long-term commitment. As a result, the magnitudes we document may not generalize beyond countries with similar institutional frameworks. Nonetheless, the core logic that patient institutional capital can promote firm productivity could plausibly extend to economies with comparable governance structures and expanding funded pension sectors. This article contributes to several strands of the literature. First, we add to research on funded pensions and economic growth by examining whether pension investments promote productivity at the firm level, a dimension largely overlooked in prior work that focuses on aggregate pension savings and output growth. Evidence in this macro literature is mixed: Bijlsma, Bonekamp, van Ewijk, and Haaijen (Reference Bijlsma, Bonekamp, van Ewijk and Haaijen2018) show that countries with larger pension asset pools experience higher output growth in externally financed sectors; Altiparmakov and Nedeljkovic (Reference Altiparmakov and Nedeljkovic2018) find no overall effect of shifts toward funded pensions,Footnote 2 and Zandberg and Spierdijk (Reference Zandberg and Spierdijk2013) report no short-term growth effects and only modest long-run impacts.
Second, we contribute to the literature on ownership composition and corporate outcomes by focusing specifically on pension funds and by extending the analysis beyond listed firms. Prior work links institutional ownership to innovation (Aghion, Van Reenen, and Zingales (Reference Aghion, Van Reenen and Zingales2013)) and to productivity-related outcomes (Braguinsky, Ohyama, Okazaki, and Syverson (Reference Braguinsky, Ohyama, Okazaki and Syverson2015), Bircan (Reference Bircan2019), and Fons-Rosen, Kalemli-Ozcan, Sørensen, Villegas-Sanchez, and Volosovych (Reference Fons-Rosen, Kalemli-Ozcan, Sørensen, Villegas-Sanchez and Volosovych2021)) but largely concentrates on publicly traded firms.
Existing research also documents positive effects of investor types such as private equity and venture capital (PE/VC) on firm performance (e.g., Chemmanur, Krishnan, and Nandy (Reference Chemmanur, Krishnan and Nandy2011), Davis et al. (Reference Davis, Haltiwanger, Handley, Jarmin, Lerner and Miranda2014), and Bernstein, Lerner, Sorensen, and Strömberg (Reference Bernstein, Lerner, Sorensen and Strömberg2017)). We extend this line of research by examining pension funds, which differ from PE and VC in important ways. Unlike PE and VC funds, which actively shape younger firms to increase their value, pension funds typically invest in more mature companies and operate with a longer investment horizon. This long-term approach may enable firms to invest in projects that improve productivity. Our study is the first to isolate the relationship between pension fund ownership and firm productivity for unlisted firms.
Finally, we contribute to the literature on the determinants of firm productivity. Prior studies emphasize financial frictions (Coricelli, Driffield, Pal, and Roland (Reference Coricelli, Driffield, Pal and Roland2012), Caggese (Reference Caggese2019), and Levine and Warusawitharana (Reference Levine and Warusawitharana2021)), leverage (Coricelli, Driffield, Pal, and Roland (Reference Coricelli, Driffield, Pal and Roland2012)), firm characteristics, and hiring practices (Parrotta and Pozzoli (Reference Parrotta and Pozzoli2012), İmrohoroğlu and Tüzel (Reference İmrohoroğlu and Tüzel2014)), as well as competition, exporting, and workforce composition (De Loecker (Reference De Loecker2013), Parrotta, Pozzoli, and Pytlikova (Reference Parrotta, Pozzoli and Pytlikova2014), and Bao and Chen (Reference Bao and Chen2018)). We introduce pension fund investment as a previously unexplored factor influencing productivity at the firm level.
The remainder of this article is structured as follows: In Section II, we describe potential economic channels through which pension funds can affect firm productivity. The data and summary statistics are then discussed in Section III, followed by the presentation of our empirical strategy in Section IV. We present our empirical results in Section V. Section VI contains a series of robustness checks, as well as some heterogeneity analysis. Finally, in Section VII, we offer concluding remarks.
II. Investment-Productivity Channels
Pension fund investments may affect firm-level productivity both positively and negatively.
On the one hand, pension funds can positively influence firm productivity through several channels. First, they may increase the supply of financial capital available to the firm. This reduces the required rate of return on the firm’s investment in (physical) capital, leading the firm to expand its investment until its demand for financing again equals the supply of financing. The additional investment could be directed toward activities that enhance productivity, such as acquiring advanced equipment or undertaking innovation-related projects (Aghion and Howitt (Reference Aghion and Howitt1998), Pinkus, Pozzoli, and Schneider (Reference Pinkus, Pozzoli and Schneider2023)). We refer to this as the “supply-of-financing channel.”
Second, pension fund investment could boost firm productivity through what we label the “long-term-commitment channel.” Pension funds and other types of investors, such as PE/VC funds, differ considerably in their business models. Consequently, the channels through which these investors affect firm productivity may also differ. Notably, PE/VC funds are more likely to seek direct influence over the operational structure of target firms and to invest in younger firms or start-ups than pension funds do. The potential effects of pension fund investment may instead stem from the fact that, because of their long-term liabilities, these investors tend to be long-term holders of capital and, hence, their involvement enhances the security of long-term financing for firms. This may lead firms to pursue projects that favor long-term objectives, such as productivity enhancement, over short-term dividend pay-outs. The long investment horizon of pension funds is also central to ongoing policy discussions regarding their role in fostering economic growth.
We expect the two channels described previously to be more relevant for unlisted firms than for listed firms. Given that unlisted firms generally face greater difficulty accessing external capital and have a smaller investor base, it is plausible to anticipate a larger productivity effect of pension fund investment among unlisted firms.
In addition to the two channels discussed previously, there are two further plausible channels through which pension fund investment could boost productivity. One is the “engagement channel,” whereby pension funds actively engage with the firms they invest in to enhance productivity. Evidence supporting this mechanism has been documented in other parts of the financial sector. Alvarez, Jara, and Pombo (Reference Alvarez, Jara and Pombo2018) evaluate a sample of publicly traded firms from several emerging economies. They conclude that the relationship between investment and institutional block holdings follows an inverse U-shape. Hence, when institutional block holders own a large share of controlling rights, investment rates decline with the block size. The authors interpret this as evidence that large holdings by institutional investors increase managerial monitoring and lead firms to adopt a longer-term investment perspective, thereby reducing over-investment. Davis et al. (Reference Davis, Haltiwanger, Handley, Jarmin, Lerner and Miranda2014) suggest that private equity buyouts affect firm productivity by accelerating the closure of less productive plants and the opening of more productive ones. Another potential mechanism is the “signaling channel,” whereby pension fund investment serves as a positive signal to the market about the firm’s quality,Footnote 3 thereby lowering the cost of capital and stimulating productivity-enhancing investment. Specifically, the involvement of prominent institutional investors may be interpreted by the market as a sign of sound corporate governance, attracting additional investors. Jara, López-Iturriaga, Martín, Saona, and Tenderini (Reference Jara, López-Iturriaga, Martín, Saona and Tenderini2019), for instance, find that Chilean firms receiving pension fund investment are more likely to issue bonds and pay lower interest rates, crowding out bank lending. The authors attribute this effect to improved governance and better information disclosure.
On the other hand, pension fund investment may also negatively affect firms when their ownership leads to weaker performance due to external pressures or visibility concerns. In such cases, investment strategies may not be fully aligned with maximizing shareholder value, which can create governance challenges and misaligned incentives (Jiao and Ye (Reference Jiao and Ye2013), Andonov, Hochberg, and Rauh (Reference Andonov, Hochberg and Rauh2018)). We expect these effects to be more likely for listed firms, whose public profile and economic significance expose them to greater scrutiny and external (public and political) pressure.
While the previous discussion outlines several plausible channels, our data impose certain limitations. We do not observe firm-level information on the types of projects undertaken or their riskiness, nor do we have measures of firms’ access to government resources (e.g., subsidies). As a result, we cannot directly test these specific mechanisms. Instead, we triangulate using information on investment intensity, proxies for financial constraints, and the unlisted–listed divide (for the supply-of-financing channel); investment length (for the long-term commitment channel); ownership proximity (for the engagement channel); and the number of additional investors (as a signaling channel). It is, in addition, possible that several channels are simultaneously active and jointly affect the relationship between pension fund investment and productivity.
III. Data
Before merging with the Danish registers, we construct a detailed ownership data set that identifies whether a firm has received an equity investment from a domestic pension fund. Using shareholder records from Experian, which contain only direct ownership links, we reconstruct ultimate ownership by iterating through ownership layers until we identify the final controlling owner of each firm, using the algorithm described in Supplementary Material Appendix A3. This allows us to capture both direct and indirect ownership through domestic subsidiaries. Because the underlying administrative registers contain only domestic ownership information, we observe only domestic ultimate owners, including domestic pension funds. Pension fund investors are identified by matching the CVR (identification) numbers of all Danish pension funds to the reconstructed ownership records. A firm is considered to have received a pension fund investment if any pension fund appears among its ultimate domestic owners. It is important to clarify that pension funds can invest in firms either directly or through owned subsidiaries or via structures such as limited partnerships (LP) with private equity vehicles. Due to data limitations inherent in administrative ownership registers, investments made through LP–PE structures are not visible to us as ultimate ownership stakes in the underlying portfolio firms. Our empirical analysis, therefore, pertains to the first conduit, ownership links for which domestic pension funds can be identified as ultimate equity owners. Recall that our analysis focuses on unlisted firms, while a refinement analysis is conducted separately for listed firms.
Once we have obtained the ownership data, we merge its anonymized version with two Danish registers, namely, FIRE and FIRM, which provide detailed information about a firm’s balance sheet, its number of employees, and the industry it operates in. We now describe how we process the firm accounting data. In the remainder of this section, we define a firm’s industry as the NACE Rev.2 1-digit industry based on the Danish Industry Classification (DB07).Footnote 4 The sample period covers the years 2003–2019, for which we have matching accounting and pension fund investment data. First, we exclude all firms with imputed values or missing industry information. To estimate firm productivity as described in Section IV, we exclude all observations with 0 or missing values for capital, labor (number of employees), output, value added, or intermediate inputs. We deflate output, value added, intermediate inputs, and capital with industry-specific deflators.Footnote 5 To improve balance sheet consistency, we drop observations with negative equity values. Next, we exclude industries with no firms receiving pension fund investments and firms that are observed only in a single year. Afterward, we winsorize capital, labor, intermediate inputs, and output at the 1st and 99th percentiles. Finally, because Denmark has many small firms while pension funds invest mostly in larger firms, we restrict the analysis sample to unlisted firms with at least 10 employees in every year of the sample period during which they are active. Note that this is standard practice in the literature working with Danish register data (see, e.g., Parrotta, Pozzoli, and Pytlikova (Reference Parrotta, Pozzoli and Pytlikova2014), Fan, Lee, and Smeets (Reference Fan, Lee and Smeets2022)).
A. Descriptive Statistics
Our final sample for the main analysis consists of unlisted firms for which we can successfully compute productivity and that fall within the common support of the propensity score distributions for treated and nontreated observations with respect to pension fund investments, as described in Section A2 in Supplementary Material Appendix A.Footnote
6 This includes around 58,000 firm-year observations, representing approximately 10,000 different firms. Of these, 272 firms (corresponding to 1.5% of the sample observations) are treated in at least 1 year.Footnote
7 Our central variable of interest is a dummy for whether the firm received investment from at least one domestic pension fund.Footnote
8 Throughout the sample period, the number of pension funds investing in the firms in our sample ranges from 8 to 12. These funds have been in existence for at least 30 years and collectively manage assets well in excess of DKK 540 billion as of 2019, suggesting that the funds in our sample are large and sophisticated institutional investors.Footnote
9 Descriptive statistics and definitions of all variables used in the analysis can be found in Table 1. We show statistics for four different subsamples: i) all firm-year observations within the common support, ii) firm-year observations with pension fund investment within the common support, equivalent to receiving a pension fund investment in the previous year (year
$ t-1 $
 ), iii) firm-year observations without pension fund investment within the common support, and iv) firm-year observations without pension fund investment outside the common support and therefore outside our estimation sample. Focusing on the second subsample, we can also describe two other variables related to pension fund investment: i) investment intensity, which is equal to the aggregate share of a firm owned by all domestic pension funds together, and ii) investment length, captured by the number of consecutive years (up to and including the previous year) of pension fund investment in the firm. We observe that domestic pension funds invest on average for approximately four consecutive years and hold an aggregate stake of approximately 12% in a firm, conditional on investing in the firm in period
$ t $
), iii) firm-year observations without pension fund investment within the common support, and iv) firm-year observations without pension fund investment outside the common support and therefore outside our estimation sample. Focusing on the second subsample, we can also describe two other variables related to pension fund investment: i) investment intensity, which is equal to the aggregate share of a firm owned by all domestic pension funds together, and ii) investment length, captured by the number of consecutive years (up to and including the previous year) of pension fund investment in the firm. We observe that domestic pension funds invest on average for approximately four consecutive years and hold an aggregate stake of approximately 12% in a firm, conditional on investing in the firm in period
$ t $
 .
.

TABLE 1 Long description
The table is organized into columns: Variable, Definition, All (mean and standard deviation), Firms with P F I (mean and standard deviation), Firms without P F I matched (mean), and Firms without P F I unmatched (mean and standard deviation).
Section 1: Pension fund investment variables.
* D P F I sub i j comma t minus 1: Dummy equals 1 if a pension fund invested. All: 0.015 (0.121). Firms with P F I: 1.000 (0.000).
* Length sub i j comma t minus 1: Duration of investment in years. All: 0.059 (0.598). Firms with P F I: 3.946 (2.947).
* Intensity sub i j comma t minus 1: Total ownership percentage. All: 0.184 (2.457). Firms with P F I: 12.395 (15.956).
Section 2: Firm variables.
* Output per worker (log): All: 7.449. Firms with P F I: 7.513. Matched: 7.448. Unmatched: 7.192.
* Value added per worker (log): All: 6.316. Firms with P F I: 6.412. Matched: 6.314. Unmatched: 6.251.
* Value added (log): All: 10.137. Firms with P F I: 10.969. Matched: 10.124. Unmatched: 9.680.
* Labor (log number of employees): All: 3.821. Firms with P F I: 4.557. Matched: 3.810. Unmatched: 3.429.
* Capital (log fixed capital): All: 9.228. Firms with P F I: 10.210. Matched: 9.213. Unmatched: 8.432.
* Intermediary inputs (log): All: 10.750. Firms with P F I: 11.566. Matched: 10.738. Unmatched: 9.982.
* Age (years): All: 24.950. Firms with P F I: 25.600. Matched: 24.941. Unmatched: 18.434.
* Capital intensity (log capital per worker): All: 5.407. Firms with P F I: 5.653. Matched: 5.403. Unmatched: 5.002.
* Listed (dummy): All values are 0.000.
* Export sub i j t minus 1 (dummy): All: 0.624. Firms with P F I: 0.898. Matched: 0.620. Unmatched: 0.437.
Bottom Row: Number of Observations. All: 58,319. Firms with P F I: 893. Firms without P F I matched: 57,426. Firms without P F I unmatched: 41,919.
The second panel in Table 1 reports key characteristics about the firms that pension funds invest in. If we look at two standard measures of labor productivity, output per worker and value added per worker, firms with a pension fund investment are relatively more productive than untreated firms. These firms, on average, also produce higher output (value added) with higher consumption of inputs (labor, capital, and intermediary inputs). This is in line with the observation highlighted by the previous literature that institutional investors, including pension funds, tend to invest in the larger firms (Ferreira and Matos (Reference Ferreira and Matos2008)). Pension funds also tend to invest in slightly older firms: The average age of treated firms exceeds that of untreated firms by approximately two-thirds of a year. On average, pension funds start to invest in a firm in its 22nd year of existence. The second panel of the table also reports the fractions of exporters in the different subsamples. We include the exporter status in the refinement analysis to take into account that exporting firms are generally more productive than otherwise comparable firms (Harrigan, Reshef, and Toubal (Reference Harrigan, Reshef and Toubal2023)). Note that the differences between treated and nontreated firms are reduced when we focus on our main sample, where the common support condition is enforced, particularly in terms of productivity, capital stock, age, and export status.
In addition to these firm characteristics, several features of the investment data itself deserve attention. A large share (42%) of firms receiving a pension fund investment do so in 2003, the first year for which we observe pension fund holdings. Consequently, the variable measuring investment duration is mechanically left-censored, since we cannot observe investments prior to 2003. Right-censoring also arises for investments that continue through the end of the sample period. For 54% of treated firms, the first observed investment coincides with the first year the firm appears in the sample, again reflecting left-censoring. We also record 118 instances of complete divestment, defined as a situation where at least one pension fund invests in a firm in year
$ t-1 $
 but none invest in year
$ t $
but none invest in year
$ t $
 . Finally, Table B1 in Supplementary Material Appendix B shows the distribution of firms across NACE Rev. 2 1-digit industries. Pension fund investments are clearly concentrated in manufacturing, which accounts for 57% of all treated firms.
Our hypothesis that pension funds can affect firm productivity through long-term investments is consistent with the assumption that pension funds seek to match their long-term liabilities with long-term assets (Della Croce, Stewart, and Yermo (Reference Della Croce, Stewart and Yermo2011), Beyer, Larcker, and Tayan (Reference Beyer, Larcker and Tayan2014)). Pension funds collect contributions from workers today and pay out retirement income decades later, creating long-term liabilities. This gives them strong incentives to hold assets that generate returns over correspondingly long horizons. Most Danish pension funds are defined contribution, while some are defined benefit. Danish occupational pensions are for the most part defined contribution ( bidragsdefinerede ). Traditional defined benefit schemes ( ydelsesdefinerede ), primarily civil servant pensions, account for only approximately 1.4% of total pension assets, and guaranteed defined contribution schemes constitute only a minor share of total pension liabilities (Danmarks Nationalbank (2025)). Defined benefit funds promise a specific payout to retirees, placing the investment risk on the fund itself. To manage this risk, they typically hedge their long-term liabilities through fixed-income instruments and derivatives, rather than through their equity investments. The remainder of their portfolios is then largely allocated to equity, which provides a higher expected return over long periods. Defined contribution funds, where the investment risk is borne by the participant rather than the fund, have even fewer constraints on equity allocation, since there is no fixed payout obligation to hedge against. Crucially, regardless of fund type and irrespective of hedging needs, both defined contribution and defined benefit pension funds can afford to hold equity investments for extended periods, as the bulk of their participants is in the midst of their working life and will not require payouts for many years. We, therefore, expect pension funds, both defined contribution and defined benefit, to adopt longer investment horizons than other investors, allowing them to reap additional returns from patient, long-term equity holdings.
Empirical evidence supports the notion that pension funds typically have a longer investment horizon than other institutional investors (Cella, Ellul, and Giannetti (Reference Cella, Ellul and Giannetti2013), Cremers and Pareek (Reference Cremers and Pareek2016), Harford, Kecskés, and Mansi (Reference Harford, Kecskés and Mansi2018), and Döring, Drobetz, Ghoul, Guedhami, and Schröder (Reference Döring, Drobetz, Ghoul, Guedhami and Schröder2021)). Our data confirm this trend. Table B2 in Supplementary Material Appendix B compares the length of the investment period of domestic pension funds with that of other investors in the domestic financial industry. We classify other investors based on either their 6-digit or 3-digit (DB07) sector code (in case of insurance companies). First, Panel A in Table B2 in Supplementary Material Appendix B reports the mean investment horizon of each investor group, conditional on investing in firm
$ i $
 at time
$ t-1 $
at time
$ t-1 $
 , as well as the difference between other investors and the average investment horizon of pension funds, and the p-value of a simple difference-in-means t-test. On average, pension funds invest in a firm for 0.7 years longer than banks do. While this difference may seem rather small, it represents approximately 20% of the mean investment horizon of pension funds, making it relatively important. Small absolute differences are also consistent with the empirical finance literature on investor horizon (see, e.g., Cella, Ellul, and Giannetti (Reference Cella, Ellul and Giannetti2013)). Our data show that among domestic investors, pension funds have a longer investment horizon than all other sectors except for nonfinancial holding companies.Footnote
10 Moreover, the differences in the length of the investment horizon between pension funds and other investor types are statistically significant for all sectors. Second, Panel B in Table B2 shows that prior to divestment, pension funds invested in firms for a larger number of consecutive years than any other investor type.Footnote
11 Most of these differences are statistically significant at the 1% level. Third, the observation that pension funds tend to have longer investment duration compared to other investor types is further confirmed in Figure B1 in Supplementary Material Appendix B, where we present the distribution of the duration variable among different investor types. Pension funds stand out with higher (lower) density corresponding to duration lasting for 6 years and above (1 year and below). To conclude, our data show domestic pension funds to exhibit a longer investment horizon than other domestic investors.
, as well as the difference between other investors and the average investment horizon of pension funds, and the p-value of a simple difference-in-means t-test. On average, pension funds invest in a firm for 0.7 years longer than banks do. While this difference may seem rather small, it represents approximately 20% of the mean investment horizon of pension funds, making it relatively important. Small absolute differences are also consistent with the empirical finance literature on investor horizon (see, e.g., Cella, Ellul, and Giannetti (Reference Cella, Ellul and Giannetti2013)). Our data show that among domestic investors, pension funds have a longer investment horizon than all other sectors except for nonfinancial holding companies.Footnote
10 Moreover, the differences in the length of the investment horizon between pension funds and other investor types are statistically significant for all sectors. Second, Panel B in Table B2 shows that prior to divestment, pension funds invested in firms for a larger number of consecutive years than any other investor type.Footnote
11 Most of these differences are statistically significant at the 1% level. Third, the observation that pension funds tend to have longer investment duration compared to other investor types is further confirmed in Figure B1 in Supplementary Material Appendix B, where we present the distribution of the duration variable among different investor types. Pension funds stand out with higher (lower) density corresponding to duration lasting for 6 years and above (1 year and below). To conclude, our data show domestic pension funds to exhibit a longer investment horizon than other domestic investors.
IV. Structural Productivity Estimation
To estimate firm productivity and relate it to pension fund investment, we follow the structural production-function literature and recover total factor productivity (TFP) as the residual from a Cobb–Douglas production function in value added, capital, and labor. Using TFP instead of labor productivity is particularly important because pension fund investments may raise firms’ capital input, and we aim to isolate productivity changes that are not mechanically driven by input variation.
A central challenge in estimating productivity is the simultaneity between firms’ input choices and their expectations about productivity. We address this using the control-function approach of Ackerberg, Caves, and Frazer (Reference Ackerberg, Caves and Frazer2015) (ACF), which employs intermediate inputs as a proxy for unobserved productivity shocks. The method proceeds in two stages.
A. First Stage
The log of output (
$ y $
 ) of firm
$ i $
) of firm
$ i $
 in industry
$ j $
in industry
$ j $
 in period
$ t $
in period
$ t $
 is generated by the production function:

where
$ {k}_{ijt} $
 denotes the log of capital,
$ {l}_{ijt} $
denotes the log of capital,
$ {l}_{ijt} $
 is the log of labor,
$ {\omega}_{ijt} $
is the log of labor,
$ {\omega}_{ijt} $
 is the firm productivity observed by the firm but not by the econometrician, and
$ {\varepsilon}_{ijt} $
is the firm productivity observed by the firm but not by the econometrician, and
$ {\varepsilon}_{ijt} $
 is the independent and identically distributed (IID) shock or measurement error. Intermediate material inputs
$ {m}_{ijt} $
is the independent and identically distributed (IID) shock or measurement error. Intermediate material inputs
$ {m}_{ijt} $
 do not enter the production function directly but are used as a control variable for
$ {\omega}_{ijt} $
do not enter the production function directly but are used as a control variable for
$ {\omega}_{ijt} $
 .
.
Under standard ACF assumptions, material demand is a function of capital, labor, and productivity and can be inverted to express productivity (
$ {\omega}_{ijt} $
 ) as a function of
$ \left({k}_{ijt},{l}_{ijt},{m}_{ijt}\right) $
) as a function of
$ \left({k}_{ijt},{l}_{ijt},{m}_{ijt}\right) $
 . Substituting this expression into the production function and augmenting it with year fixed effects
$ {\kappa}_t $
. Substituting this expression into the production function and augmenting it with year fixed effects
$ {\kappa}_t $
 yields

where
$ h\left(\cdot \right) $
 is the composite function that subsumes the linear input terms and productivity,
$ {\kappa}_t $
is the composite function that subsumes the linear input terms and productivity,
$ {\kappa}_t $
 denotes the year fixed effects, and
$ {\varepsilon}_{ijt} $
denotes the year fixed effects, and
$ {\varepsilon}_{ijt} $
 is the IID shock or measurement error. In the first stage, we approximate
$ h\left(\cdot \right) $
is the IID shock or measurement error. In the first stage, we approximate
$ h\left(\cdot \right) $
 with a flexible polynomial in
$ \left({k}_{ijt},{l}_{ijt},{m}_{ijt}\right) $
with a flexible polynomial in
$ \left({k}_{ijt},{l}_{ijt},{m}_{ijt}\right) $
 , separately for each industry
$ j $
, separately for each industry
$ j $
 , that is, for each of the DB07 36 industries.Footnote
12 We then define
$ {\hat{h}}_{ijt} $
, that is, for each of the DB07 36 industries.Footnote
12 We then define
$ {\hat{h}}_{ijt} $
 as the predicted output net of year fixed effects. The predicted output from the first stage
$ {\hat{h}}_{ijt} $
as the predicted output net of year fixed effects. The predicted output from the first stage
$ {\hat{h}}_{ijt} $
 is then used to identify the input elasticities in the second stage.
B. Second Stage and Productivity Law of Motion
In the second stage, we recover the input elasticities
$ \left({\beta}_k,{\beta}_l\right) $
 by exploiting the assumed law of motion for productivity. Following De Loecker (Reference De Loecker2013) and related work, we model productivity as evolving according to a first-order Markov process that may be shifted by past pension fund investment,
$ {PFI}_{ij,t-1} $
by exploiting the assumed law of motion for productivity. Following De Loecker (Reference De Loecker2013) and related work, we model productivity as evolving according to a first-order Markov process that may be shifted by past pension fund investment,
$ {PFI}_{ij,t-1} $
 :
:

This specification allows pension fund investment to influence how productivity evolves over time, rather than entering directly as a production input, and conditions on past productivity to mitigate concerns about selection into investment. Since

substituting into the law of motion yields the empirical second-stage equation:

Equation (1) is, therefore, the empirical implementation of the productivity law of motion, rewritten in terms of predicted output and including industry fixed effects
$ {\alpha}_j $
 . The coefficient of interest,
$ \gamma $
. The coefficient of interest,
$ \gamma $
 , measures how past pension fund investment is associated with subsequent productivity, conditional on past productivity and inputs. We estimate equation (1) via GMM using standard ACF timing assumptions and instrument sets. A detailed exposition of the identification strategy, timing structure, and the complete two-step estimation procedure is provided in Supplementary Material Appendix A4.
V. Empirical Analysis
This section reports and discusses our empirical results. Unless explicitly noted otherwise, all results are based on the sample of unlisted firms.
A. Event Study
Before presenting the results obtained from the structural estimation of the production function, we take an event study approach that allows us to check for differential pretrends, that is, to assess whether, before the event of pension fund investment occurs, firms eventually treated with a pension fund investment differ in terms of productivity from their counterparts that do not receive a pension fund investment. A number of recent studies have highlighted concerns with the traditional event study design when units, in our case firms, receive treatment at different points in time (see, e.g., Goodman-Bacon (Reference Goodman-Bacon2021), de Chaisemartin and D’Haultfœuille (Reference de Chaisemartin and D’Haultfœuille2024)). This issue is important in our context since pension funds start investing in firms in different years. Therefore, we use the estimator suggested by Sun and Abraham (Reference Sun and Abraham2021) that is robust to treatment heterogeneity with respect to the timing of the treatment. Figure 1 presents the relationship of a pension fund investment with two measures of firm productivity, output per worker and value added per worker, using the sample where the common support condition is enforced.Footnote 13 First, we notice that there are no significant preexisting differences in productivity trends between treated and nontreated firms prior to the first pension fund investment in the firm (which we refer to as the “event” date). However, we do observe a positive association with productivity that persists for a number of years following the event date, as shown in the two graphs. Supplementary Material Appendix C shows that the event of a pension fund investment is associated with an increase in firms’ sales and value added and a decrease (although insignificant) in the number of employees. Therefore, the positive correlation with output per worker and value added per worker is a combination of an effect on output/value added and an effect on employment, and the structural estimation approach presented in the next section will control for the change in employment to estimate the association of pension fund investment with productivity. Furthermore, the same event is associated with a positive increase in firms’ investments. The fact that capital expenditures increase following pension fund investment events is consistent with both the “supply-of-financing” and the “long-term commitment” channels highlighted in Section II.Footnote 14
In Figure 1, the outcome variable is the log of output or value added per worker. Year 0 is the first year of pension fund investment. This figure presents point estimates and 95% confidence intervals of an event study specification using the estimator proposed by Sun and Abraham (Reference Sun and Abraham2021). The following controls enter the specification: firm age and capital intensity. We also include year-by-(DB07-36) industry fixed effects.

FIGURE 1 Long description
Two panels arranged horizontally. Both share an x-axis labeled Relative Time to Pension Investment ranging from minus 4 to 6 and a y-axis labeled Event Time Coeff. relative to t equals minus 1 ranging from minus 0.05 to 0.15. A horizontal red line marks the zero baseline.
Graph A. Output Per Worker
The data points show a slight downward trend from minus 4 to minus 2. At minus 1, the coefficient is zero by construction. From year 0 to year 5, there is a steady upward trend, peaking at approximately 0.07 before a slight drop at year 6. Vertical red error bars representing 95 percent confidence intervals are wide, often crossing the zero line.
Graph B. Value Added Per Worker
The trend is relatively flat and near zero before the investment. Following year 0, there is a consistent positive increase in the coefficients, reaching a peak of approximately 0.08 at year 5. Similar to Graph A, the 95 percent confidence intervals are represented by vertical red bars that indicate the range of statistical uncertainty for each point estimate.
B. Main Results
Table 2 presents the results for the model in which the pension fund investment is included in equation (1) through a dummy variable. For convenience, we report the coefficient estimates of the pension fund investment variable and the related standard errors multiplied by 100. Column 1 shows estimates for the case in which the law of motion of the exogenous productivity process is specified without the pension fund investment variable. Column 2 introduces the pension fund dummy in the specification. Column 3 restricts the pension fund investment dummy to take a value of 1 only if the aggregate holding by all Danish pension funds in firm
$ i $
 is at least 5%. This allows us to abstract from cases in which investment by pension funds constitutes only a negligible source of capital for the firm, that is, cases in which pension funds passively invest in a firm as part of a broad portfolio. Previous literature found that export status is important in the estimation of productivity (De Loecker (Reference De Loecker2013)). Column 4, therefore, reports the results including a dummy in equation (1) that takes a value of 1 if firm
$ i $
is at least 5%. This allows us to abstract from cases in which investment by pension funds constitutes only a negligible source of capital for the firm, that is, cases in which pension funds passively invest in a firm as part of a broad portfolio. Previous literature found that export status is important in the estimation of productivity (De Loecker (Reference De Loecker2013)). Column 4, therefore, reports the results including a dummy in equation (1) that takes a value of 1 if firm
$ i $
 is an exporter at
$ t-1 $
is an exporter at
$ t-1 $
 .
.

TABLE 2 Long description
The table consists of four columns labeled 1 through 4.
Row 1: Elasticity of labor (beta sub l). Values are 0.956, 0.955, 0.955, and 0.952 respectively, all significant at the 1 percent level. Standard errors are 0.006 for all.
Row 2: Elasticity of capital (beta sub k). Values are 0.079, 0.079, 0.079, and 0.077 respectively, all significant at the 1 percent level. Standard errors are 0.005 for all.
Row 3: D P F I sub i j comma t minus 1. Values are blank for column 1, 3.905 (significant at 1 percent) for column 2, 4.771 (significant at 1 percent) for column 3, and 3.410 (significant at 5 percent) for column 4. Standard errors range from 1.471 to 1.584.
Row 4: Industry F E. All columns are marked Yes.
Row 5: P F I sub i j comma t minus 1 greater than or equal to 5 percent. Only column 3 is marked Yes.
Row 6: Export sub i t minus 1. Only column 4 is marked Yes.
Row 7: delta for D P F I sub i j comma t minus 1 equals 0. Values are 14.943 for column 2, 15.056 for column 3, and 11.912 for column 4.
Row 8: Autocorrelation rho. Values are 0.530 for columns 1 and 2, and 0.531 for columns 3 and 4.
Row 9: Number of Observations. All columns show 58,319.
Row 10: Observations P F. Values are 893 for columns 1, 2, and 4; and 596 for column 3.
Row 11: Number of Firms. All columns show 10,308.
Row 12: Number of Firms P F. Values are 272 for columns 1, 2, and 4; and 201 for column 3.
The estimates of the production function elasticities
$ {\beta}_l $
 and
$ {\beta}_k $
and
$ {\beta}_k $
 and of the autocorrelation coefficient
$ \rho $
and of the autocorrelation coefficient
$ \rho $
 are in the range of estimates in previous studies (Fox and Smeets (Reference Fox and Smeets2011), Bøler, Moxnes, and Ulltveit-Moe (Reference Bøler, Moxnes and Ulltveit-Moe2015)).Footnote
15 We observe a positive and significant coefficient on the pension fund investment variable in all specifications. Receiving a pension fund investment in the previous year is associated with an increase in productivity ranging from 3.4% to 4.7%, depending on the specification. The coefficient is stronger when we restrict the pension fund investment dummy to take a value of 1 only when aggregate ownership of pension funds in the company is at least 5%. This could be an indication of the relevance of the “supply-of-financing channel” that we will discuss more extensively in the next section. Including the export dummy hardly affects the estimate of the pension investment dummy.
are in the range of estimates in previous studies (Fox and Smeets (Reference Fox and Smeets2011), Bøler, Moxnes, and Ulltveit-Moe (Reference Bøler, Moxnes and Ulltveit-Moe2015)).Footnote
15 We observe a positive and significant coefficient on the pension fund investment variable in all specifications. Receiving a pension fund investment in the previous year is associated with an increase in productivity ranging from 3.4% to 4.7%, depending on the specification. The coefficient is stronger when we restrict the pension fund investment dummy to take a value of 1 only when aggregate ownership of pension funds in the company is at least 5%. This could be an indication of the relevance of the “supply-of-financing channel” that we will discuss more extensively in the next section. Including the export dummy hardly affects the estimate of the pension investment dummy.
Although we do not control for a large number of firm characteristics, the structural approach that we employ conditions on past productivity. In this way, we attenuate concerns related to selection driven by heterogeneity, particularly the possibility that pension funds select firms based on their productivity. Even after accounting for this potential source of selection, we find a positive and statistically significant association between pension fund investment and firm productivity. While conditioning on past productivity mitigates selection concerns, we do not interpret these estimates as causal.
Furthermore, to assess the sensitivity of our main results to omitted unobserved variables, we apply the approach described in Oster (Reference Oster2019). This method allows testing for the sensitivity of the estimated effects to omitted variable bias under the assumption that the relationship between the treatment (i.e., pension fund investments) and unobservables can be recovered from the relationship between the treatment and the observables. Specifically, we estimate the degree of selection on unobserved relative to observed variables necessary to obtain a null effect of pension fund investments on productivity if we were to estimate the law of motion (1) with standard OLS and by assuming that the R
2 from a hypothetical regression of the outcome on treatment and both observed and unobserved controls (i.e.,
$ {R}_{max} $
 in the notation found in Oster (Reference Oster2019)) equals 1. As reported at the bottom of Table 2, we obtain
$ \delta $
in the notation found in Oster (Reference Oster2019)) equals 1. As reported at the bottom of Table 2, we obtain
$ \delta $
 ratios ranging from approximately 12–15 in the estimation sample, which are well above the value of 1 usually seen as an upper bound for selection on unobservables. Under the assumptions of the framework described in Oster (Reference Oster2019), this suggests that a substantial degree of selection on unobserved factors would be required to fully account for the estimated association. While this exercise does not rule out all forms of endogeneity, it provides reassurance that omitted variable bias is unlikely to fully drive our main results.
Another concern with the results presented in Table 2 is that the positive association between pension fund investment and productivity may be fully driven by a change in input and output prices. If pension fund investments lead, for example, to higher output prices and/or lower input prices, then we would incorrectly conclude that productivity has increased due to pension fund investments. We, therefore, test whether pension fund investments indeed affect output and input prices using product-level data collected for a representative sample of manufacturing firms.Footnote 16 The event study analysis reported in Figures C6 and C7 in Supplementary Material Appendix C allows us to rule out any significant change in the average and median price of a firm’s purchased and sold products following a pension fund investment.
C. Economic Mechanisms
In the previous section, we show that firms’ productivity correlates with the presence of pension fund investment. In this section, we provide additional results to investigate plausible economic mechanisms behind this positive association.
1. The Supply-of-Financing Channel
First, we investigate whether the size of the pension fund investment matters by defining the pension fund investment in equation (1) as the total share of firm
$ i $
 (in percent) held by all domestic pension funds. Table 3 presents the results of this specification. On average, an increase of 1 percentage point in pension fund investment intensity is associated with a TFP increase of approximately 0.1%. The significance of
$ {Intensity}_{ij,t-1} $
(in percent) held by all domestic pension funds. Table 3 presents the results of this specification. On average, an increase of 1 percentage point in pension fund investment intensity is associated with a TFP increase of approximately 0.1%. The significance of
$ {Intensity}_{ij,t-1} $
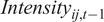 suggests a potential relevance of the “supply-of-financing channel,” as more supply of fund capital is associated with a larger productivity increase. Another channel potentially suggested by this result is that a larger equity stake gives more control over the management of the target company, which could lead to higher productivity gains. A channel where, for instance, the CEO is fired and replaced by a more skilled CEO seems less relevant based on the fact that in fewer than 4% of observed cases of pension fund investments in our sample the stake is above 50%, while in 85% of the observed cases, the total stake held by pension funds in the firm is at most 20%. However, the possibility cannot be excluded that, as equity stakeholders and potential board members, pension funds provide firms’ management with valuable (strategic) advice. Note that the estimated coefficients on
$ {Intensity}_{ij,t-1} $
suggests a potential relevance of the “supply-of-financing channel,” as more supply of fund capital is associated with a larger productivity increase. Another channel potentially suggested by this result is that a larger equity stake gives more control over the management of the target company, which could lead to higher productivity gains. A channel where, for instance, the CEO is fired and replaced by a more skilled CEO seems less relevant based on the fact that in fewer than 4% of observed cases of pension fund investments in our sample the stake is above 50%, while in 85% of the observed cases, the total stake held by pension funds in the firm is at most 20%. However, the possibility cannot be excluded that, as equity stakeholders and potential board members, pension funds provide firms’ management with valuable (strategic) advice. Note that the estimated coefficients on
$ {Intensity}_{ij,t-1} $
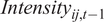 reported in Table 3 combine the effect due to the extensive margin (i.e., receiving a pension fund investment at all) with the one induced by the intensive margin (i.e., the size of the investment). Unfortunately, likely due to a limited number of treated observations, we lack the statistical power to distinguish between these two effects, although the signs of the estimated coefficients are as expected when both the extensive and intensive margin variables are included in the same specification.Footnote
17 Therefore, we have to interpret these results with this important caveat and also treat our interpretation on the implied channels as suggestive evidence.
reported in Table 3 combine the effect due to the extensive margin (i.e., receiving a pension fund investment at all) with the one induced by the intensive margin (i.e., the size of the investment). Unfortunately, likely due to a limited number of treated observations, we lack the statistical power to distinguish between these two effects, although the signs of the estimated coefficients are as expected when both the extensive and intensive margin variables are included in the same specification.Footnote
17 Therefore, we have to interpret these results with this important caveat and also treat our interpretation on the implied channels as suggestive evidence.

TABLE 3 Long description
The table consists of three columns labeled 1, 2, and 3, representing different regression specifications.
* Elasticity of labor (beta sub l): Values are 0.956 in column 1, 0.956 in column 2, and 0.952 in column 3. All are significant at the 1 percent level. Standard errors are 0.006 for all columns.
* Elasticity of capital (beta sub k): Values are 0.079 in column 1, 0.079 in column 2, and 0.077 in column 3. All are significant at the 1 percent level. Standard errors are 0.004 for all columns.
* Intensity sub i j comma t minus 1: Values are 0.138 in column 1, 0.134 in column 2, and 0.128 in column 3. All are significant at the 10 percent level. Standard errors are 0.082, 0.080, and 0.070 respectively.
* Industry F E: Yes for all columns.
* P F I sub i j comma t minus 1 greater than or equal to 5 percent: No in column 1, Yes in column 2, No in column 3.
* Export sub i j comma t minus 1: No in column 1, No in column 2, Yes in column 3.
* Number of Observations: 58,319 for all columns.
* Obs. P F: 893 in column 1, 596 in column 2, 893 in column 3.
* Number of Firms: 10,308 for all columns.
* Number of Firms P F: 272 in column 1, 201 in column 2, 272 in column 3.
An additional way to test the supply-of-financing channel is to examine whether the association is stronger for firms facing tighter financial frictions. To this end, we include interactions between pension fund investment and proxies for liquidity constraints. We measure liquidity constraints in two ways: i) whether a firm’s long-term-debt-to-assets ratio in its first sample year is above the 75th percentile, and ii) whether the ratio of assets minus inventories to liabilities in its first sample year is below the 25th percentile. As shown in columns 1 and 2 in Table 4, the coefficients on these interaction terms are positive, consistent with the hypothesis that pension fund investment may alleviate financial constraints, but they are not statistically significant. Thus, while the signs of the interactions point into the expected direction and are consistent with the hypothesis that low-liquidity firms may benefit relatively more from pension fund investment, the evidence remains at most modest.Footnote 18

TABLE 4 Long description
The table consists of three columns of results. Columns 1 and 2 represent the whole sample of unlisted firms, while Column 3 represents listed firms.
* Elasticity of labor (beta sub l): Column 1 is 0.945 (0.007), Column 2 is 0.972 (0.007), and Column 3 is 0.777 (0.081). All are significant at the 1 percent level.
* Elasticity of capital (beta sub k): Column 1 is 0.086 (0.005), Column 2 is 0.069 (0.005), and Column 3 is 0.134 (0.054). Columns 1 and 2 are significant at the 1 percent level; Column 3 at the 5 percent level.
* D P F I sub i j comma t minus 1: Column 1 is 5.021 (2.051) significant at 5 percent; Column 2 is 3.339 (1.727) significant at 10 percent; Column 3 is negative 1.097 (14.973).
* Low Liquidity sub i j: Column 1 is negative 5.978 (0.539) and Column 2 is negative 2.889 (0.588), both significant at 1 percent. Column 3 is blank.
* Interaction of D P F I and Low Liquidity: Column 1 is 2.325 (3.082) and Column 2 is 2.417 (3.649). Column 3 is blank.
* Industry F E: All columns indicate Yes.
* Number of Observations: Column 1 is 58,319; Column 2 is 54,851; Column 3 is 2,818.
* Obs. P F: Column 1 is 893; Column 2 is 777; Column 3 is 798.
* Number of Firms: Column 1 is 10,308; Column 2 is 9,614; Column 3 is 328.
* Number of Firms P F: Column 1 is 272; Column 2 is 240; Column 3 is 148.
While unlisted firms may face tight financial constraints because they have limited access to external financing, this should be less of a concern for listed firms, ceteris paribus. To further support the plausibility of a supply-of-financing channel, in the last column in Table 4, we re-run the main analysis focusing solely on listed firms.Footnote 19 The results suggest that the correlation between pension fund investment and productivity is negative for listed firms. A plausible explanation is that pension fund investment decisions in listed firms may be subject to external pressures due to high public or political exposure, which can lead to investment strategies that are not fully aligned with maximizing shareholder value (Jiao and Ye (Reference Jiao and Ye2013), Andonov, Hochberg, and Rauh (Reference Andonov, Hochberg and Rauh2018)). However, the negative coefficient is not statistically significant. Overall, these estimates provide only suggestive evidence that listed firms do not benefit from pension fund investment. At the same time, the results are consistent with the hypothesis that pension fund investment raises productivity through the supply-of-financing channel among unlisted firms, which tend to face tighter financing constraints and have fewer alternative sources of external capital.Footnote 20
2. The Long-Term-Commitment Channel
One of the main differences between pension funds and most other types of investors is their long investment horizon. Therefore, pension funds can provide long-term financing security and stimulate firms to make productivity-enhancing investments. Hence, we now investigate whether the holding period of a pension fund investment makes a difference by capturing the pension fund investment in equation (1) with the variable
$ {Length}_{ij,t-1} $
 , which measures the number of consecutive years that firm
$ i $
, which measures the number of consecutive years that firm
$ i $
 has received pension fund investment up to year
$ t-1 $
has received pension fund investment up to year
$ t-1 $
 . Table 5 shows that an additional year of a pension fund investment is associated with a significant increase in productivity in the range of 0.5%–0.9% on average, depending on the specification.

TABLE 5 Long description
The table consists of three columns labeled 1, 2, and 3.
Row 1: Elasticity of labor beta sub l. Column 1 is 0.956, column 2 is 0.956, and column 3 is 0.952. All are significant at the 1 percent level. Standard errors are 0.006, 0.005, and 0.006 respectively.
Row 2: Elasticity of capital beta sub k. Column 1 is 0.079, column 2 is 0.079, and column 3 is 0.077. All are significant at the 1 percent level. Standard errors are 0.004 for all columns.
Row 3: Length sub i j comma t minus 1. Column 1 is 0.587 significant at 5 percent. Column 2 is 0.933 significant at 1 percent. Column 3 is 0.499 significant at 5 percent. Standard errors are 0.279, 0.324, and 0.220 respectively.
Row 4: Industry F E. All columns are marked Yes.
Row 5: P F I sub i j comma t minus 1 greater than or equal to 5 percent. Column 2 is Yes, while columns 1 and 3 are No.
Row 6: Export sub i j comma t minus 1. Column 3 is Yes, while columns 1 and 2 are No.
Row 7: Number of Observations. All columns are 58,319.
Row 8: Obs. P F. Column 1 is 893, column 2 is 596, and column 3 is 893.
Row 9: Number of Firms. All columns are 10,308.
Row 10: Number of Firms P F. Column 1 is 272, column 2 is 201, and column 3 is 272.
This finding is consistent with the potential presence of the “long-term-commitment channel.” This is also in line with the event study, which provides suggestive evidence for a positive association with productivity not only in the first year of the investment but also some years after the investment starts. These results on the length variable should be interpreted with caution due to the following two caveats. First, like for the intensity results, the coefficient estimated on the variable
$ {Length}_{ij,t-1} $
 captures the impact of both the extensive and intensive margin. Second, the
$ {Length}_{ij,t-1} $
captures the impact of both the extensive and intensive margin. Second, the
$ {Length}_{ij,t-1} $
 variable may not fully reflect the true length of the firm’s investment history due to truncation at the start of the sample period in 2003. This truncation introduces censoring, as some firms may have initiated investments prior to the sample period, leading us to observe only a portion of the full investment timeline. The implications of this censoring depend on whether the relationship between productivity and length is positive and convex or positive and concave. It may bias the estimated coefficients in Table 5 if the observed length is shorter than the true length, since the effect of a longer duration could be inaccurately attributed to a shorter observed period. For example, if a firm has been invested in for 8 years but only 4 years are observed, then the estimated impact of the first additional observed year would correspond to the marginal effect of the fifth year, potentially overstating (if the relationship is convex) or understating (if concave) the per-year impact. However, it is unlikely that a convex relationship can exist over a long holding period, as productivity cannot become explosively large. Overall, potential truncation bias may affect the precision and interpretation of our estimates, and the results in Table 5 should be considered with this limitation in mind.
3. The Distinction between Direct and Indirect Investment and the Engagement Channel
We now re-estimate equation (1) while distinguishing between direct and indirect pension fund holdings. To do so, we create two separate dummy variables, one for each investment type, and include both in the same regression. This specification allows us to examine whether the positive association between pension fund participation and firm productivity documented earlier is also present for indirect holdings, consistent with the possibility that pension funds may exert influence through intermediaries via which capital is channeled. Table B5 in Supplementary Material Appendix B reports descriptive evidence on the composition of indirect pension fund investment chains. Setting aside the two broad industry-level categories at the top of the table, which, by construction, encompass most of the more specific intermediary types, the table indicates that indirect ownership chains are frequently organized through holding companies, particularly nonfinancial holding companies, as well as investment companies.Footnote 21 These investor types are commonly associated with delegated monitoring, control rights, or active ownership structures, rather than with purely arm’s length financial intermediation. By contrast, banks, insurance companies, and asset management firms, entities more typically linked to passive intermediation or contractual lending relationships, appear relatively less often in indirect pension fund ownership chains. While our data do not allow us to observe the operational role of these intermediaries directly, these statistics clarify the composition of ownership chains.
The first column in Table 6 shows that the estimated coefficient for the dummy representing direct pension fund investments is slightly smaller in size and less precisely estimated than the corresponding coefficient of indirect (intermediated) investments in the baseline specification. However, these estimates should be interpreted carefully. In our estimation sample, only about 4% of firms (12 firms) receiving pension fund capital are financed directly, whereas the vast majority (260 firms) receive funding through intermediaries. As a result, the absence of statistical significance for direct investments is likely driven by the limited number of such observations rather than by a lack of economic relevance. In the second column of the same table, we therefore explore differences resulting from how close pension funds are to their portfolio firms. Intermediated investments can occur through ownership chains of varying complexity, ranging from relatively simple arrangements with a single intermediary to multilayered setups with several intermediaries. To capture this, we construct a degree of separation measure for each ultimate owner–firm pair. Specifically, we multiply the investor’s equity share by the number of intermediary links between the pension fund and the firm, defined as 1 for direct holdings (no intermediary), 2 for one intermediary, 3 for two, and so forth. We then aggregate these values across all pension fund investors to obtain a firm-level index in each year. Based on this index, firms with indirect pension fund investment are split into two groups: those with a low degree of separation (below the sample median) and those with a high degree of separation (above the median). The results, reported in the second column of Table 6, indicate that both types of indirect investment are positively correlated with productivity, but the estimated association is larger and statistically significant only for firms with a low degree of separation. This pattern suggests that pension funds are more closely linked to productivity improvements when the ownership chain is shorter, possibly because their investment priorities and governance practices reach the firm more directly. As the number of intermediaries increases, the estimated relationship becomes weaker, which may reflect greater monitoring difficulties or a dilution of pension funds’ influence. In column 3, we merge direct holdings with indirect investments characterized by a low degree of separation to test whether proximity to the firm, either through direct ownership or limited intermediation, matters for performance. The results confirm that being closer to the firm has a larger and statistically significant association with productivity, consistent with the notion that tighter ownership links improve pension funds’ ability to influence managerial behavior and improve firm performance.Footnote 22

TABLE 6 Long description
The table consists of three columns labeled 1, 2, and 3.
Row 1: Elasticity of labor (beta sub l). All three columns show 0.955 with three asterisks and a standard error of 0.006.
Row 2: Elasticity of capital (beta sub k). All three columns show 0.079 with three asterisks and a standard error of 0.005.
Row 3: D P F I sub i j comma t minus 1 (direct). Column 1 is 3.258 (3.510); Column 2 is 3.250 (3.510).
Row 4: D P F I sub i j comma t minus 1 (indirect). Column 1 is 3.958 with two asterisks (1.557).
Row 5: D P F I sub i j comma t minus 1 (indirect and low separation). Column 2 is 5.382 with three asterisks (1.984).
Row 6: D P F I sub i j comma t minus 1 (direct plus indirect and low separation). Column 3 is 5.088 with three asterisks (1.807).
Row 7: D P F I sub i j comma t minus 1 (indirect and high separation). Column 2 and 3 are both 2.516 (2.164).
Summary statistics for all columns: Industry F E is Yes; Number of Observations is 58,319; Observations Indirect P F is 825; Observations Direct P F is 66; Firms is 10,308; Firms Indirect P F is 260; Firms Direct P F is 12.
4. The Signaling Channel
A final mechanism that may contribute to the association between firm productivity and pension fund investment is a possible signaling channel. Pension funds are often viewed as reliable, long-horizon investors. Their entry into a firm’s ownership structure could, therefore, be interpreted by some market participants as providing information about the firm’s governance practices or longer-term prospects. If so, other investors might become more inclined to acquire equity stakes following pension fund involvement.
Figure 2 provides descriptive event-study evidence that is consistent with this possibility. Using the estimator of Sun and Abraham (Reference Sun and Abraham2021), the figure plots the evolution of the additional number of equity owners (excluding the pension fund associated with the event) around the first year in which a firm receives a pension fund investment (Graph A). Prior to the event, treated and untreated firms exhibit similar trends. After pension fund entry, the total number of additional owners increases by four on average and remains elevated in subsequent years. When focusing on additional pension funds that enter after the initial event, a slightly smaller increase is observed (Graph B), indicating that the postentry expansion of the investor base is driven especially by other pension funds.
Graph A of Figure 2 shows that the outcome variable is the total number of additional firm owners (excluding the pension fund associated with the event) relative to the moment of the first pension investment stake. Graph B focuses on additional pension funds entering as investors after the event. Year 0 is the first year of pension fund investment. The figure presents point estimates and 95% confidence intervals from an event-study specification using the estimator proposed by Sun and Abraham (Reference Sun and Abraham2021). The specification includes the following controls: firm age and capital intensity. We also include year-by-industry fixed effects at the DB07 36-industry level.

FIGURE 2 Long description
The two-panel figure displays event-study estimates with 95 percent confidence intervals represented by vertical red error bars.
Graph A, titled Number of Add. Investors, has an x-axis labeled Relative Time to Pension Investment ranging from negative 4 to 6, and a y-axis labeled Event Time Coeff. relative to t equals negative 1 ranging from negative 2 to 6. The data points from year negative 4 to negative 1 are near zero. At year 0, there is a sharp vertical increase to a coefficient of approximately 4. From year 1 to 6, the line shows a gradual downward trend, ending at a coefficient of approximately 1.
Graph B, titled Number of Add. P F Investors, uses the same x-axis scale and a y-axis ranging from negative 1 to 4. Similar to Graph A, the pre-event coefficients from year negative 4 to negative 1 are flat near zero. At year 0, the coefficient jumps to approximately 2.8. The subsequent years 1 through 6 show a fluctuating but generally declining trend, finishing at a coefficient of approximately 1.2. Both graphs include a horizontal dashed reference line at y equals 0.
Several explanations could underlie this pattern. One interpretation is that pension fund investment helps reduce information frictions by signaling that the firm has undergone some degree of financial or governance scrutiny. Another possibility is that the presence of a large, stable institutional owner reassures other investors about the credibility of the firm’s governance. It is important to note, however, that although the number of owners rises after pension fund entry, our co-investment tests in the next section indicate that other investor types are generally not correlated with productivity. The fact that the ownership increase is mainly attributable to additional pension funds alleviates potential tension with these findings, since pension funds are precisely the investor group for which we document a robust association with productivity. Moreover, the gradual entry of additional pension funds in the years following the initial investment event, taken together with the results in Section V.C.2, which show that longer durations of pension fund investment are positively correlated with productivity, is consistent with a high degree of long-term commitment by the pension fund industry as a whole.
VI. Robustness and Heterogeneity Analysis
This section reports some robustness tests of our main findings and includes a heterogeneity analysis for the association between pension fund investment and firm productivity. We first show that co-investments by other financial sector investors do not drive our results. We then re-estimate our main specifications with a series of alternative approaches, including different matching strategies, production function estimators, and variable definitions. Finally, we examine whether the association varies across industries and firm characteristics.
A. The Role of Co-investments
One concern is that if pension funds consistently invest in firms jointly with other specific investors (such as private equity funds or insurance companies), interpreting the positive coefficients reported in the previous tables as effects on productivity exclusively attributable to pension fund investments could be misleading. We, therefore, augment our baseline specification from column 2 in Table 2 by adding a dummy variable that captures investments in unlisted firms by any other financial party, and we report the results in Table 7.Footnote 23 It is important to note that the investor categories reported in Table 7 represent ultimate owners as identified by our ownership algorithm (the same algorithm used to identify pension funds). Entities that appear within ownership chains are treated as intermediate layers and are, therefore, not counted as owners in Table 7; such cases reflect “vertical” ownership relationships (via intermediaries), whereas Table 7 captures “horizontal” ownership situations in which multiple ultimate owners, such as pension funds and investment companies, co-own a firm.

TABLE 7 Long description
The table consists of 13 columns representing different subsets of domestic financial investors.
Key variables and their coefficients across all columns:
- Elasticity of labor (beta sub l): Consistently 0.955 with a standard error of 0.006 or 0.007, significant at the 1 percent level.
- Elasticity of capital (beta sub k): Consistently 0.079 with standard errors between 0.004 and 0.005, significant at the 1 percent level.
- D P F I sub i j comma t minus 1: Coefficients range from 2.253 to 4.814. Most are significant at the 1 percent level (columns 1 through 4, 6, and 10) or 5 percent level (columns 5, 7, 8, 9, 12, and 13).
- Other sub i j comma t minus 1: Coefficients vary significantly by investor type. Significant positive associations are found in column 7 (1.698), column 9 (1.733), and column 11 (2.022). Other columns show non-significant negative or positive values.
Summary Statistics:
- Total observations (Obs.): 58,319 across all columns.
- Pension Fund observations (Obs. P F): 893.
- Total firms: 10,308.
- Firms with Pension Fund investment (# Firms P F): 272.
- Observations for ‘other’ investors (Obs. other): Ranges from 23,755 in column 1 to 43 in column 13.
- Firms with ‘other’ investment (# Firms other): Ranges from 5,122 in column 1 to 17 in column 13.
- Simultaneous investment (Obs. both): Ranges from 804 in column 1 to 99 in column 12; column 13 is omitted.
The new estimates allow us to dismiss the hypothesis that the main channel through which firm productivity positively correlates with pension fund investment is the presence of other investor types. Table 7 shows that, regardless of how we measure the other-investor dummy, the coefficient on the pension fund variable remains positive and statistically significant in all cases, with an estimated magnitude between 2% and 5%. At the same time, the results also reveal that some other investor types, such as investment companies and other financial intermediaries, exhibit a positive association with productivity as well. However, although certain other investor types exhibit positive coefficients, these estimates tend to be smaller than those for pension funds. This pattern is consistent with the descriptive evidence presented in Section III.A, which shows that these investor groups, like pension funds, tend to remain invested in firms for several consecutive years.Footnote 24 Specifically, pension funds, investment companies, and other financial intermediaries remain invested for roughly four consecutive years, a longer period than asset managers, banks, venture companies, and capital funds. This long-term investment approach, as highlighted in Section V.C.2, combined with the relatively substantial size of pension fund investments discussed in Section V.C.1, appears to be an important mechanism explaining why pension funds exhibit a particularly strong and robust association with firm productivity. This pattern aligns with the idea that short-term or more volatile investment strategies do not provide firms with the financial stability and governance continuity necessary to foster productivity improvements. Finally, when we replicate this analysis for the sample of listed firms, the results of which are reported in Supplementary Material Appendix Table C3, the coefficients on both the pension fund and other investor-type dummies are not statistically significant. This finding is consistent with our earlier result that the positive relationship between pension fund investment and productivity is confined to unlisted firms.
B. Further Robustness Analysis
We begin by examining the sensitivity of our results to the way we construct the matched sample. Specifically, we re-estimate the propensity scores using a random forest model to create a sample with common support. Unlike the logit model used for propensity score estimation in the main analysis, the random forest is a nonparametric ensemble learning method well-suited for capturing nonlinear relationships and complex interactions among covariates. As in the main analysis, we estimate the random forest model separately for each year and industry pair. For each pair, the data set is split into training and testing subsets, with 70% of the observations allocated to the training set and 30% to the testing set.Footnote 25 To improve the reliability of the propensity score estimation, the model is configured to grow 1000 trees per forest, and the hyper-parameter governing the number of variables randomly sampled as candidates at each split is tuned using a grid search combined with 10-fold cross-validation. Finally, we validate the resulting propensity scores on the testing set to ensure predictive accuracy.Footnote 26 In the second check, we construct a sample by applying a more stringent common support condition than the one used in the main analysis. Specifically, instead of defining the overlap of the propensity score distributions for treated and nontreated observations based on the minimum propensity score for treated observations and the maximum for nontreated observations, we use the 5th and 95th percentiles of the propensity score distribution, respectively. Note that this adjustment significantly reduces the sample size, shrinking it from approximately 58,000 to nearly 23,000 observations. In the last check, we re-estimate the production function using the same sample as in the main analysis but apply inverse probability weights to both stages of the production function estimation (Imbens and Wooldridge (Reference Imbens and Wooldridge2009)). This approach internalizes the propensity score directly into the estimation of coefficients of interest. The inverse probability weights, calculated based on the propensity scores, assign greater importance to nontreated observations and less importance to treated observations during estimation. The results of these three checks, reported in Table 8, are very similar to the main results discussed in the previous section.

TABLE 8 Long description
The table consists of four columns labeled 1 through 4, representing different estimation models.
* Elasticity of labor beta sub l: Values range from 0.870 in column 1 to 0.975 in column 3, all significant at the 1 percent level. Standard errors are in parentheses below each value, ranging from 0.007 to 0.017.
* Elasticity of capital beta sub k: Values range from 0.051 in column 3 to 0.105 in column 1, all significant at the 1 percent level. Standard errors range from 0.005 to 0.014.
* D P F I sub i j comma t minus 1: This variable shows positive correlations with productivity across all models. Column 1 is 3.457 significant at 10 percent. Column 2 is 3.980 significant at 5 percent. Column 3 is 4.778 significant at 1 percent. Column 4 is 4.966 significant at 1 percent.
* Industry F E: All columns are marked Yes.
* Number of Observations: Column 1 has 38,734. Column 2 has 23,060. Column 3 has 58,319. Column 4 has 42,066.
* Obs. P F: Column 1 has 649. Column 2 has 416. Column 3 has 893. Column 4 has 887.
* Firms: Column 1 has 8,070. Column 2 has 5,733. Column 3 has 10,308. Column 4 has 7,753.
* Firms P F: Column 1 has 207. Column 2 has 141. Column 3 has 272. Column 4 has 271.
Second, the last column in Table 8 presents results from excluding firms without ownership information. Our baseline uses all Danish firms as the control group, although ownership data exist only for firms partly owned by other firms, of which those receiving pension fund investment are a subset. To ensure that missing ownership data do not drive our results, we re-estimate the baseline model on a restricted sample that excludes firms without ownership information. The coefficients on pension fund investment become slightly larger, but the overall conclusions remain unchanged.
Third, we re-estimate the production function using the approach of Olley and Pakes (Reference Olley and Pakes1996), augmenting the law of motion with the dummy variable capturing pension fund investments.Footnote 27 This approach explicitly models firm attrition in the estimation of the production function. The results, presented in Table C1 in Supplementary Material Appendix C, confirm the robustness of our findings.Footnote 28
Fourth, we present the results obtained from a gross-output production function, which cannot be identified using the standard ACF approach. Table C2 in Supplementary Material Appendix C reveals that our findings and interpretations remain generally robust and with similar magnitudes and significance, when employing a gross-output-based production function instead of a value-added-based one, using the methodology developed by Gandhi, Navarro, and Rivers (Reference Gandhi, Navarro and Rivers2020).Footnote 29
We close this section with a few additional robustness checks. First, we exclude firms whose share capital increased in any sample year. A firm that undertakes a capital increase may do this because it perceives productivity-enhancing opportunities regardless of whether a pension fund invests in it, which would complicate our interpretation of the association between productivity and pension fund investment. However, excluding these firms confirms our baseline results, with positive and highly significant coefficients in all specifications (Table C4 in Supplementary Material Appendix C). Second, our results remain unaffected if we approximate the function
$ h(.) $
 in the first stage of the production functionFootnote
30 by a third-degree polynomial in labor, capital, intermediary inputs, average wage, and investment rate (following Fan, Lee, and Smeets (Reference Fan, Lee and Smeets2022)) (Table C5 in Supplementary Material Appendix C). Third, our main findings are robust to defining capital as the book value of fixed assets instead of the value obtained via the perpetual inventory method as in our baseline results (Table C6 in Supplementary Material Appendix C). Finally, for completeness, we also report the main results obtained from the unmatched sample (Table C7 in Supplementary Material Appendix C), which tend to be slightly stronger than the ones estimated from the matched sample.
in the first stage of the production functionFootnote
30 by a third-degree polynomial in labor, capital, intermediary inputs, average wage, and investment rate (following Fan, Lee, and Smeets (Reference Fan, Lee and Smeets2022)) (Table C5 in Supplementary Material Appendix C). Third, our main findings are robust to defining capital as the book value of fixed assets instead of the value obtained via the perpetual inventory method as in our baseline results (Table C6 in Supplementary Material Appendix C). Finally, for completeness, we also report the main results obtained from the unmatched sample (Table C7 in Supplementary Material Appendix C), which tend to be slightly stronger than the ones estimated from the matched sample.
C. Heterogeneity Analysis
In Supplementary Material Appendix C, we also present a heterogeneity analysis examining whether the association between productivity and pension fund investment varies across industries and firm characteristics. When re-estimating the production function separately by 1-digit industry, we find that the coefficient on pension-fund investment is generally positive, although statistical significance is limited by the small number of treated observations within most sectors (see Table C8 in Supplementary Material Appendix C). Manufacturing stands out as the only industry with a statistically significant effect, consistent with the importance of long-term capital and governance benefits in a highly capital-intensive sector. Additional heterogeneity analyses based on firm size, age, and labor productivity in the base year, that is, the first year a firm appears in the sample, reveal that smaller firms benefit slightly more from pension fund investment, which is consistent with a supply-of-financing channel, while firm age does not influence the association between productivity and pension fund investment (see Table C9 in Supplementary Material Appendix C). Moreover, the positive and significant association persists even after controlling for high initial productivity, suggesting that it is not driven by pension funds selecting already more productive firms, which is consistent with the event study evidence.
VII. Discussion and Conclusion
Among various initiatives to boost productivity, this article examines whether equity investments channeled through funded pension schemes are associated with increases in firm productivity. In recent decades, funded pension savings have grown substantially across the globe, and countries with high levels of pension savings relative to GDP typically top international rankings of pension systems. For example, Mercer (2023) ranks pension systems in terms of adequacy, sustainability, and integrity. The three countries with the best-rated pension systems—Iceland, the Netherlands, and Denmark—also have the highest pension assets-to-GDP ratios among OECD countries (OECD (2023)). However, while pension funds are potential financiers of firms, it remains largely unresolved whether, and to what extent, pension fund investments affect firms’ productivity. Given the global trend toward more funded pensions, it is becoming increasingly important to understand their implications for the wider economy.
We combine high-quality Danish register data with a detailed database on the domestic shareholders of Danish unlisted firms that we construct. Our estimates suggest a quantitatively large, positive association between firm productivity and pension fund investment, with an average magnitude of 3%–5%. This outcome, achieved despite the complex ownership structure in our database, supports our hypothesis that pension fund investments are related to productivity differences among unlisted firms. As explained in Section III, we can identify the ultimate owners of firms only by relying on numerous assumptions, inevitably introducing some unintended “measurement error” in how ownership power is distributed. In our view, this complexity further corroborates our main hypothesis. In fact, despite these challenges in accurately determining firms’ ultimate owners, the positive coefficient on our pension fund variable is highly robust across a wide range of refinement analyses. It remains, for example, when we control for whether a firm exports and when we account for other domestic investors from the financial industry.
We also find suggestive evidence that the productivity association is stronger when pension funds hold larger stakes and have longer investment horizons in the firm. The former result suggests a role for the “supply-of-financing channel,” while the latter emphasizes the “long-term-commitment channel.” Moreover, we observe that the association is stronger when pension funds are closer to the owned firm in the ownership chain, consistent with an “engagement channel” in which more proximate owners can exercise greater oversight. Finally, we find indicative evidence of a signaling channel: after a pension fund enters a firm’s ownership structure, the number of other investors (especially other pension funds) increases. This pattern is consistent with pension fund involvement sending a positive signal about the firm’s quality and governance, thereby attracting additional investors and broadening the ownership base. A refinement analysis focusing on listed firms shows that the association between productivity and pension fund investment is present only for unlisted firms. This pattern is consistent with the supply-of-financing channel, as unlisted firms typically face tighter financing constraints and have fewer alternative sources of external capital, and with the notion that listed firms’ greater public visibility and exposure to external (including political) pressures may limit the scope for pension funds’ influence. At the same time, this finding does not preclude the relevance of other mechanisms, such as engagement or long-term commitment, which may be particularly important for unlisted and, on average, smaller firms.
These results also speak to a gap in the existing literature on institutional ownership and firm performance. Prior work has documented positive associations between institutional ownership and productivity-related outcomes (such as innovation), but these findings come mainly from listed firms (Aghion, Van Reenen, and Zingales (Reference Aghion, Van Reenen and Zingales2013)) or from studies of PE and VC investors, who improve performance through active operational control (Chemmanur, Krishnan, and Nandy (Reference Chemmanur, Krishnan and Nandy2011), Davis et al. (Reference Davis, Haltiwanger, Handley, Jarmin, Lerner and Miranda2014), and Bernstein, Lerner, Sorensen, and Strömberg (Reference Bernstein, Lerner, Sorensen and Strömberg2017)). Pension funds have received comparatively little attention in this literature, despite differing from both broad institutional investors and PE/VC funds in important ways. Our results complement these prior findings by showing that pension funds, investors with longer horizons and a less interventionist mode of engagement,Footnote 31 are positively associated with productivity, but only among unlisted firms. The key distinction is that, for unlisted firms, external equity capital is scarce and the pool of potential equity providers is small. In this environment, the entry of a large, patient investor can relax financing constraints, provide stability, and, as our evidence on ownership proximity suggests, contribute to governance in ways that would be redundant in listed markets where multiple institutional investors are already present (Brav, Jiang, Partnoy, and Thomas (Reference Brav, Jiang, Partnoy and Thomas2008), McCahery, Sautner, and Starks (Reference McCahery, Sautner and Starks2016)) and alternative capital sources abundant.
Our study provides tentative leads for policies aimed at increasing firms’ productivity. This is particularly important in an era in which potential GDP growth has gradually fallen across many industrialized countries, raising the question of how such developments might be reversed. At the same time, many developed countries face the need to reform their pension systems in light of population ageing, while emerging and developing economies confront the dual challenge of promoting economic development and designing sustainable pension systems for a growing population. These considerations make the challenge of boosting productivity growth even more pressing. Moreover, the global trend toward greater reliance on funded pensions increases the relevance of understanding how pension funds interact with the real economy. Against this backdrop, our micro-level results, although derived from a single-country context with a highly developed pension system, may offer suggestive insights for policymakers considering the broader macroeconomic implications of funded pension systems.
Specifically, a positive association between pension fund investment and firm productivity provides indicative support for the idea that funded pension schemes could, under certain institutional conditions, contribute to productivity improvements. However, given that our study is set in Denmark, where data quality is exceptional and pension institutions are particularly well developed, caution is needed when extrapolating these findings to countries with different institutional frameworks. To the extent that any productivity increase is driven by pension funds’ long-term financing commitments, our results may also be viewed as suggestive of the potential importance of policies that avoid premature liquidation of pension savings, such as restrictions on early withdrawals. See Beetsma, Romp, and Vos (Reference Beetsma, Romp and Vos2012) on the sustainability of nonmandatory funded pensions and Brown, Poterba, and Richardson (Reference Brown, Poterba and Richardson2022) on take-up trends of retirement income in the United States. Likewise, policies aimed at increasing pension savings, such as tax incentives for contributions, could, in settings with similar institutional features, support domestic investment and productivity. At the same time, our findings should not be interpreted as implying that pension funds should concentrate their portfolios domestically; rather, we document empirical relationships for the subset of domestic investments that can be observed in our data.
Supplementary Material
To view supplementary material for this article, please visit http://doi.org/10.1017/S0022109026103020.
Funding Statement
Pinkus acknowledges support from the Pension Scholarship Trust, and Pozzoli acknowledges support from the Danish Finance Institute (DFI).


 Open access

