

Introduction
English language has been widely accepted and used in Ghana after its transplantation from its native land. Historically, it has been noted that Ghana’s contact with English can be traced back to the second half of the 15th century, due to the English quest to trade in gold and spices (Sey Reference Sey1973; Spencer Reference Spencer and Spencer1971). Consequently, this contact situation gave birth to the kind of English spoken in Ghana today. The disparities that exist between native English and English spoken in Ghana have been treated as deviations and errors (e.g., Ahulu Reference Ahulu1994; Dako Reference Dako2003; Gyasi Reference Gyasi1990; Nimako Reference Nimako2004; Sey Reference Sey1973). However, Owusu–Ansah (Reference Owusu–Ansah, Edu–Buandoh and Appartaim2012, 9) asserts that there has been ‘a paradigm shift in the study of non‑native varieties’ from the perspective of analysing them as error‑driven to a new image of achieving their communicative functions. Consequently, the nature of English spoken in Ghana has been described as Ghanaian English (GhE) because it is characterised by unique forms peculiar to Ghana (e.g., Adika Reference Adika2012; Adjaye Reference Adjaye2005; Bobda Reference Bobda2000; Huber Reference Huber and Mesthrie2008; Lomotey Reference Lomotey2010; Ngula Reference Ngula2011; Ofori et al. Reference Ofori, Ishmael and Mintah Kingsley2014; Owusu–Ansah Reference Owusu–Ansah, Edu–Buandoh and Appartaim2012; Quarcoo Reference Quarcoo1994).
One of the main differences in the pronunciation of English lies in the realisation of vowels in different varieties of English (Maxwell and Fletcher Reference Maxwell and Janet2009; Mutonya Reference Mutonya2008). It can be argued that some scholars have attempted to describe Ghanaian English (GhE) phonologically (e.g., Bobda Reference Bobda2000; Huber Reference Huber and Mesthrie2008; Ofori et al. Reference Ofori, Ishmael and Mintah Kingsley2014), but much attention has not been given to the study of the vowel sounds acoustically. One major issue is that the literature is not clear on the number of monophthongs in GhE (e.g., Bobda Reference Bobda2000; Huber Reference Huber and Mesthrie2008; Ofori et al. Reference Ofori, Ishmael and Mintah Kingsley2014). Most of these studies used the impressionistic approach. This is not to say that auditory analysis is not useful. However, some researchers (e.g., Deterding Reference Deterding1997; Gut Reference Gut2009; Watt and Fabricius Reference Watt and Fabricius2002) contend that new technology and the possibilities of analysing acoustic properties of speech sounds have reliably improved the description of some sounds, particularly vowels. This implies that it would be much more desirable if the descriptions of GhE vowels are done acoustically to resolve the issue of subjectivity. This study, therefore, takes a cue from the preceding argument to find out, acoustically, how Ghanaians articulate the RP pure vowels.
Vowel description
Since vowels are produced within the space in the mouth, it is very difficult to describe the exact locations of their production because the articulators do not make contact (Davenport and Hannahs Reference Davenport and Hannahs2005, 38). Traditionally, vowels can be described in terms of the part of the tongue raised, the height of tongue, and the shape of the lips (Cruttenden Reference Cruttenden2008; Gut Reference Gut2009; Ladefoged and Johnson Reference Ladefoged and Keith2011; Roach Reference Roach1998). This suggests that the quality of a vowel can be better described with the support of instruments. Essentially, Gut (Reference Gut2009, 138) intimates that ‘an acoustic study of speech recordings reveals many properties of speech that cannot be heard even by trained listeners’. Ladefoged and Johnson (Reference Ladefoged and Keith2011, 87–88) suggest that we can therefore describe vowels better by describing their acoustic structures because certain sounds become confused with one another. Acoustically, vowels can be distinguished from one another by the two characteristic formant frequencies (F1/F2) associated with their overtones (Ashby Reference Ashby2011; Gut Reference Gut2009; Ladefoged Reference Ladefoged1996; Ladefoged and Johnson Reference Ladefoged and Keith2011). The shape of the resonating cavities produces some overtone pitches to give the distinctive quality of the vowel. Ladefoged (Reference Ladefoged1996, 93) explains that the movement of the tongue, the lips, and the soft palate cause variations in shaping the vocal tract. This action damps series of waves in the vocal tract to determine the quality of vowels. For instance, the vocal organs can assume a position to leave a series of waves in the vocal tract to determine the quality of a vowel like [i:] as in see; but another position will damp different series of waves for a sound like [e] as in set.
In describing vowel quality acoustically, F1 is associated with vowel height while F2 corresponds to front‑back dimension, as well as the shape assumed by the lips (Ashby Reference Ashby2011; Gut Reference Gut2009; Harrington Reference Harrington, Hardcastle, Laver and Gibbon2010; Ogden Reference Ogden2009; Watt and Fabricius Reference Watt and Fabricius2002). Watt and Fabricius (Reference Watt and Fabricius2002, 159) indicate that open vowels mostly record higher F1 values compared to close vowels. In terms of F2, front vowels have higher values than back vowels, and mostly become higher if the back vowels are rounded too.
Empirical studies
A careful reading of the literature on GhE phonemes reveals that certain English short monophthongs like /ɪ, æ, ʌ, ɒ, ʊ, ə/ do not exist in the spoken English of Ghanaians (e.g., Bobda Reference Bobda2000; Huber Reference Huber and Mesthrie2008; Lomotey Reference Lomotey2010; Ofori et al. Reference Ofori, Ishmael and Mintah Kingsley2014; Sey Reference Sey1973). For instance, Bobda (Reference Bobda2000, 187–94) argues that Ghanaians replace the RP /ʌ/ with either /a/ or /o/ whereas the /ə/ is relatively lengthened. Most of these studies employed the impressionistic approach in their investigations. However, Gut (Reference Gut2009, 138) contents that some acoustic properties can elude trained articulatory phoneticians because human ears have limitations to certain acoustic signals. It was not surprising that after employing acoustic approach, Awoonor–Aziaku (Reference Awoonor–Aziaku2018), just like Adjaye (Reference Adjaye2005), found the existence of the schwa vowel in GhE.
The literature also suggests that GhE does not demonstrate the realisation of English long vowels (e.g., Bobda Reference Bobda2000; Huber Reference Huber and Mesthrie2008; Ofori et al. Reference Ofori, Ishmael and Mintah Kingsley2014; Sey Reference Sey1973). These studies claim that GhE shows English phonemic restructuring by monophthongising all English long vowels to one of the short vowels or any indigenous vowel phonemes. For instance, Ghanaian speakers of English front the RP /ɜː/ to /e/, just like most West African countries with similar colonial experiences. Huber (Reference Huber and Mesthrie2008, 850) argures that vowel length is not a feature of Ghanaian English possibly because most indigenous languages in Ghana do not have this phonological feature. However, Adjaye (Reference Adjaye2005, 154) revealed the realisation of some occasional long vowels such as /ɑː/ or /ɔː/ in the spoken English of some Ghanaians. This change might be attributed to Bobda’s (Reference Bobda2000, 196) claim that there have been some recent or ongoing sound changes in GhE.
Consequently, the number of vowels that exist in GhE varies from one scholar to another. For instance, Ofori et al. (Reference Ofori, Ishmael and Mintah Kingsley2014) identified eight monophthongs (/i, ɪ, ɛ, a, ɔ, u, e, o/); Huber (Reference Huber and Mesthrie2008) found seven pure vowels (/i, ɛ, а, ɔ, u, e, o/), Sey (Reference Sey1973) identified five (/i, ɛ, а, ɔ, u/); while Adjaye (Reference Adjaye2005) points to four short vowels /ɪ, ɛ, a, ɔ/ with occasionally four long vowels /iː ɑː uː ɔː/. The involvement of /e/ and /o/ in the findings of these studies emerged from the monophthongisation of the RP /ei/ and /ʊə/. The different numbers suggest that GhE may have more monophthongs than those described so far, which is the focus of the current study.
Methodology
This study used the descriptive approach of research which observes and describes natural phenomena, conditions, and behaviour that exist without influencing them (Best and Kahn Reference Best and Kahn2014, 119). The quantitative approach was used to analyse the quantitative data generated from Praat. It involved the use of inferential statistics (t‑test) to test for significant variations in the formant frequencies and intensities of the vowels to describe vowel quality in GhE.
Subjects
The subjects consisted of 30 males and ten females. None of the speakers had any speech impairment. The ages of the speakers ranged between 25–51 years with an average age of 35.5 years. Purposive sampling was used to select those teachers with first degree and working in Mim Senior High School. The available females were ten in number, while the males were 30. Each participant was given 38‑word lists containing the targeted vowels being studied to read. The words were also contained in 16 sentences for them to read and a short interview. The subjects for the study comprised educated Ghanaians who had attained a university degree because the study was interested in investigating the educated variety of GhE. Here, teachers who are assumed to be the main distributors of the kind of English many Ghanaians speak are studied as the target population. Ghana is largely an English L2 speaking nation and the kind of English spoken is mostly acquired through formal education.
The site of the study was located at the Mim Senior High School in the Asunafo North Municipality in the Ahafo Region, where the researcher could be actively engaged with the participants to produce naturally occurring data in a conducive environment. Moreover, I had the strong conviction that my closeness to the participants at the time of the data collection and the phenomenon being studied provided quality data.
Data
The data for this study were spoken data which were recorded using DAT (Digital Audio Tape) IC recorder (Sony ICD‑PX333). The choice for the IC recorder was because it can record very clear sounds with very minimal noise. More importantly, this recorder records sounds in the default WAV format which is required of Praat in acoustic analysis. Other instruments for recording sounds might not record the sound in this format for Praat analysis unless it is converted to WAV format using ITunes (Styler Reference Styler2023, 12).
Following Adank et al. (Reference Adank, Roel and van Hout2004) and Easton and Bauer (Reference Easton and Laurie2000), the recordings were done at any convenient place that could be useful in avoiding noise from the background in order not to affect the data for the analysis – an appropriate way to provide quality speech samples for the analysis. This is strongly supported by Ladefoged’s (Reference Ladefoged2001, 32) view that a good environment is a requirement for recording acoustic data. This is to say that most of the recordings were done in the homes of the speakers and in some cases any convenient room found in the school because there was no appropriate designated room or laboratory for the recording.
Material
Some of the words which were used in eliciting the targeted vowels included heat, hit, hat, hard, hot, foot, food, sum, firm, saw, forty, at, and ago. The reading list was randomly constituted for the participants to read. The CVC, CV, and VC were used as environments to contain the targeted vowels. CVC context, for instance, provides natural environment to produce quality of vowel sounds – without producing unstressed syllables to cause vowel reduction. Fricatives chosen were all voiceless with no significant effect on the quality of the vowels they preceded in the monosyllabic words. Besides, fricatives chosen as part of the onsets of the syllables provided good demarcations on the spectrograms and waveforms of the sounds for easy identification of the targeted vowels. Going by Deterding’s (Reference Deterding1997, 49) suggestion, this study avoided tokens of vowels that occurred after approximants /j/, /w/ and /r/ because such approximants can largely have coarticulatory effects on the environment of the formant of vowels.
Three different contexts (word list, sentence, and interview) were used to elicit the targeted vowels under consideration. The three contexts were to determine the consistency of the vowel production, especially the schwa vowel because it was found in the speech of Ghanaian Ewes (Awoonor–Aziaku Reference Awoonor–Aziaku2018). The average results of formant one and two (F1/F2) of the monophthongs are shown in tables. The paired‑samples t test was used to test for significant difference in the vowel pairs in terms of quality. The confidence interval was set at 0.05.
Acoustic measurement
Formant
The most reliable acoustic properties of vowels are the formant frequencies, where the the F1 and F2 are enough in describing the quality of a vowel (Gut Reference Gut2009, 151). The focus of the study was to acoustically establish vowel quality and length in the spoken English of educated Ghanaians to identify the vowel inventory of GhE. Basically, the first two formants were considered for describing the vowels. Gut (Reference Gut2009, 151) argues that the first two formants, or at most three, would be sufficient to identify vowels. Therefore, F1 and F2 values, measured in Hertz (Hz), of the vowels were extracted from the data with the help of Praat to ascertain the quality of the vowels being studied (Davenport and Hannahs Reference Davenport and Hannahs2005; Ladefoged and Johnson Reference Ladefoged and Keith2011). Tokens were taken from the data for the analysis of the formant frequencies. Praat version 6.0.28 (Boersma and Weenink Reference Boersma and Weenink2016) was used in the extraction of the formants. Praat built‑in tool Linear Predictive Coding (LPC) algorithm was employed to calculate and display the vowel formants. Following Watson et al. (Reference Watson, Jonathan and Evans1998), we extracted the formant tracks for the acoustic vowels from the points where there were strong vertical striations in the spectrogram and guided by the onset waveform periodicity.
Results and discussion
Vowel quality
Table 1 shows the average values (in Hz) of F1 and F2 for the three contextual realisations of the monophthongs produced by the speakers. Figure 1 also illustrates the average plot of the vowels in relation to the three contexts. The first context was read in citation form, the second context was in sentences, and the third context was in a short interview.
The vowel plot of the three contexts produced by the speakers.

The mean F1/F2 of the monophthongs in the three contexts

The /iː/∼/ɪ/ vowels
All the Ghanaian speakers distinguished between the vowel pair /iː/∼/ɪ/ in terms of F1 and F2, using the words heed, heat, sit and hit. This difference was realised in the word list reading, sentences, and in the interview. The results of the paired‑samples t test revealed that there were highly significant differences between the F1 and F2 of the two vowels, as their respective p‑values (0.001) were less than the threshold (0.05). It can be seen from Figure 1 that the speakers physiologically produced the /iː/ vowel with the tongue relatively closer to the roof of the mouth than the /ɪ/ vowel in all the three contexts. This difference is marked by the smaller F1 values for /iː/ than the /ɪ/ vowel. The values for the F2 of both vowels also indicated highly significant difference to distinguish the two vowels as separate. Statistically, the two vowels demonstrated smaller p‑values (0.001) in all the three contextual realisations, suggesting the significant difference between them.
The /e/∼/ɜː/ vowels
The results of the production of the /e/∼/ɜː/ vowels in the words head, heard, and firm suggested that the two vowels were produced within the same region of vowel space in all the three contextual realisations by almost all the Ghanaian speakers. The results of the statistical tool suggested that there were no significant differences between the vowel pair /e/∼/ɜː/. In the citation (p= .655) and sentence contexts (p=.103), the F1 frequencies of the two vowels showed higher p‑values than the threshold (0.05). However, this pair of vowels showed lower p‑value (p= .005) in the interview session. This means that the height of the /ɜː/ vowel was closer to the roof of the mouth than the /e/ vowel. In terms of F2, the three contexts yielded higher p‑values for both vowels – 0.782, 0.369 and 0.802 for citation, sentence, and interview session respectively. The higher p‑values in all the three contextual realisations indicate that the two vowels were articulated within the same vowel space, which could be considered as the front vowel /e/. The scatter plot in Figure 2 for the first context is a clear case of overlapping vowels. This means that the /ɜː/ vowel was replaced with the /e/ vowel.
The scatter plot of /e/∼/ɜː/vowels produced by the speakers.

The /ɒ/∼/ɔː/ vowels
After testing for the existence of the two vowels /ɒ/∼/ɔː/ in GhE using the words hot, shot, saw and faulty, the results showed that the Ghanaian speakers were not consistent in producing the long vowel in all the three contexts. In the first two contexts, the two vowels were distinguished in terms of both F1 and F2, but the third context did not show any significant variation. The p‑values from the statistical results revealed that they were less than the threshold (0.05) in both F1 and F2, which suggests significant variation. For example, in context two, the p (.001) results indicated that the vowels were of different F1 frequencies. The small p‑value (.001) in both instances suggests that there was a highly significant contrast between the two vowels produced by the speakers. With respect to the F2, the results indicated that, physiologically, the part of the tongue which was raised in producing the /ɒ/ vowel was relatively central than the /ɔː/ vowel.
However, the hot and saw results indicated that the two vowels were not significantly discriminated in the interview session. From Table 1, the speakers’ F1 and F2 average values of the /ɒ/ vowel in hot and for /ɔː/ in saw showed no significant difference. The report of the paired‑samples t test suggested that the significant values for F1 (p = .237) and F2 (p = .234) showed no significant variation between the two vowels. In each case, the p‑value is higher than the 0.05 threshold, indicating that the two vowels were produced within the same vowel space by the speakers. Thus, the long vowel /ɔː/ was replaced with the short vowel /ɒ/ in the interview section, but the two vowels were discriminated in the wordlist and sentence contexts. In short, all the speakers in this study produced the /ɒ/ vowel in the three contexts but produced 60% and 52.5% of the /ɔː/ vowel in the citation, and sentence contexts respectively.
The /ʊ/∼/uː/ vowels
After the production of the two vowels /ʊ/∼/uː/ in the environments of foot, hoot and who by the speakers, the results showed that these two vowels were produced separately from each other in all the three contexts. The F1 frequencies of the two vowels indicated that the vowels were produced within the range of 450Hz and 507Hz for the /ʊ/ vowel as against the /uː/ vowel in the range of 335Hz and 395Hz in all the three contexts. This is an indication that the /uː/ vowel was produced closer to the roof of the mouth than the /ʊ/ vowel physiologically. The t‑test supported the statistical variation significantly. This was shown by the small value of the p‑value (0.001) in all the three contexts.
However, in all the three contexts, only the second context showed highly significant difference between the two vowels in terms of F2 (Table 1). In the citation context and interview session, the two vowels /ʊ/∼/uː/ did not show any significant variation. This means that they were physiologically produced within the same ‘backness’ in the first and second contexts. The statistical tool also indicated the same results by giving the p‑values as 0.500, 0.002 and 0.051 respectively.
Although the two vowels did not show significant distinction between the two vowels in all the three contexts used in respect of F2, the highly significant variation of the F1 values were enough to distinguish the two vowels in terms of vowel height. We can, conclusively, suggest that there was enough evidence to give an indication of vowel contrast between the two vowels articulated by all the Ghanaian speakers.
The /æ/∼/ɑː/∼/ʌ/ vowels
The words sat, had, hat, duck, and hard were used to contain the three vowels /æ/∼/ɑː/∼/ʌ/ to identify their realisations in GhE. Firstly, the /æ/∼/ɑː/ vowels were examined in citation form and spontaneous speech. The results suggested that the two vowels were distinguished as separate vowels (Table 1 and Figure 3). Statistically, the p‑values for the citation form and spontaneous speech in terms of F1 and F2 were smaller than the threshold of 0.05. It was also statistically indicated that the two vowels were realised independently in relation to their F2 frequencies with p‑value of .001. What this means is that the significant difference that existed between the two vowels was very high which made the /æ/ more central and the /ɑː/ relatively more back. The results of the data suggested that the /æ/ vowel was produced as a more central and the lowest vowel (Figure 3), unlike the RP. It can, therefore, be identified within the vowel space of the cardinal vowel /a/, and the one which usually occurs in the indigenous languages of Ghana. All the speakers produced the /a/ vowel in all the three contexts but 40% each of the /ɑː/ vowel was realised in the citation, and sentence contexts while the interview section recorded 35%.
Mean plot (F1/F2) of the twelve vowels produced by the speakers.

In relation to the distinction between the two vowels /ɑː/∼/ʌ/, the words hard and sum were used to test for the realisations of the two vowels, especially in the spontaneous speech. The results suggested that the two vowels were produced as independent vowels, although very close in terms of vowel space (Figure 3). The paired‑samples t test results confirmed the distinction between the two vowels in terms of quality, even though their F1 showed no significant variations (p = .843). It is clear from the p‑value that the speakers exhibited no statistically significant variation between the F1 frequencies. This is an indication that, in terms of vowel height, the two vowels maintained similar openness in their articulation.
On the contrary, the F2 values of the two vowels recorded some significant variation between them. The paired‑samples t test report suggested that the two vowels differed significantly in their F2 frequencies with p‑value of .004. Unlike the p‑value for the F1, the p‑value for the F2 frequencies showed that the two vowels were significantly produced differently in respect of their F2. The difference in the F2, physiologically, suggests that the /ʌ/ vowel was articulated a bit central but the /ɑː/ vowel appeared more back, although their F1 did not show any significant variation. It must be emphasised that 60% of the speakers realised the English vowel /ʌ/. This means that the other 40% realised it as the lowest vowel /a/.
The /ə/∼/e/ vowels
The words ago and again were used to elicit the realisation of the schwa vowel in GhE. The results indicated that 65%, 53.3% and 65% of the speakers articulated the schwa vowel in the three contexts respectively. The remaining percentage differences indicate that the vowels were overlapping in terms of vowel space with the short vowel /e/ in the word head. The results of the three contexts in Table 1 show that the speakers produced the schwa vowel differently from the /e/ vowel. Statistically, there was a significant variation between the two vowels in terms of F1 and F2, except the F1 values in the context of reading the words in citation form (where p = .969.) The extremely high level of the p‑value suggests that the Ghanaian speakers produced the F1 frequencies of the two vowels within the same height. In other words, the height of the tongue which was used in the production of the two vowels was almost the same in terms of their height. Statistically, the F2 values of the two vowels /ə/∼/e/ showed highly significant variation, as the three contexts recorded p‑values of .001 each. This means that the schwa was articulated as a central vowel whereas the /e/ was produced as a front vowel.
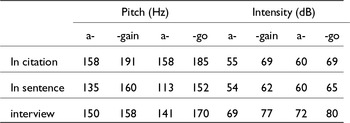
The /ə/ vowel: F0 and Intensity
Table 2 demonstrates the results of the measurement of the pitch (in Hz) and intensity (dB) used by the speakers in the production of the words again and ago. These disyllabic words have been split into two parts to illustrate the pitch and acoustic cues used in the production of the vowels in the two syllables in each case to ascertain whether there was an accented syllable or not and for that matter vowel reduction in the data gathered.
Pitch and intensity in the production of the VCV syllable

It can be seen from Table 2 that the first syllables of the two words recorded smaller values than the nuclei of the second syllables in terms of pitch and intensity. It is clear from Table 2 that the word again which was read in citation showed lower pitch in the production of the first syllable V (a‑) with smaller mean pitch as against the mean pitch of the second vowel in CVC (‑gain). The same pattern occurred in the context of sentence and spontaneous speech. The word ago also demonstrated the same pattern as that of again in the two different environments (Table 2). Interestingly, the level of force used by the speakers in the production of the words again and ago in all the three different contexts illustrated the same pattern as the pitch used. For instance, the speakers used a mean intensity difference of 14dB to produce the second syllables louder than the first syllables of the word again in the wordlist reading. In terms of ago, the speakers used an extra intensity of 9dB in articulating the second syllable louder than the first syllable in the citation form. We can also see similar pattern in the second and the third contexts (Table 2), pointing out that there was a vowel reduction in the data collected from the speakers’ speech. Berreta (Reference Berretta2003, 1–2) indicates that the unstressed vowel is characterised by reduced acoustic energy with decreased amplitude, F0, and duration.
So far, the study has acoustically shown that eleven English pure vowels were produced by the speakers unlike earlier studies. The eleven vowels (/iː, ɪ, e, a, ɑː, ɒ, ɔː, ʊ, uː ʌ, ə/) articulated by the Ghanaian participants revealed eight regular (/ iː, ɪ, e, a, ɒ, ʊ, uː ʌ/) vowels and three (/ɑː, ɔː, ə/). occasional ones. The existence of the schwa in GhE was suggested by Adjaye (Reference Adjaye2005) and later confirmed acoustically by Awoonor–Aziaku (Reference Awoonor–Aziaku2018) after studying Ewe speakers. The general results corroborate Mutonya’s (Reference Mutonya2008, 445) assertion that tense and lax vowels exist in GhE, but contradicts many other works (e.g., Bobda Reference Bobda2000; Huber Reference Huber and Mesthrie2008; Ofori et al. Reference Ofori, Ishmael and Mintah Kingsley2014, Sey Reference Sey1973). It is also crucial to accept Harrington’s (Reference Harrington, Hardcastle, Laver and Gibbon2010, 87) view that ‘tense vowels generally occupy position in the F1/F2 space that are more peripheral, i.e., further away from the centre than lax vowels’. It must be noted that some of these vowels did not occur in certain expected phonemic contexts. The results of the present study tend to suggest that most previous studies might have tried to overgeneralise or oversimplify the existence of certain English vowels in GhE.
Conclusion
The focus of this study was to acoustically investigate the production of English pure vowels in GhE. So far, the acoustic results have revealed eight pure vowels (/iː, ɪ, e, a, ɒ, ʊ, uː ʌ/) and three occasional ones (/ɑː, ɔː, ə/). The eight vowels were consistently produced in the three different contexts provided. Thus, these eight vowels were produced when they were read in isolation, in sentences, and rapid speech. The English vowel /æ/ was replaced with the quality of /a/ in all the three contexts examined. This suggests that the participants did not produce English vowel four. Also, the schwa vowel was produced when read in isolation, in sentences, and in the interview section, but did not consistently occur in all the expected environments of unstressed syllables. In such instances, the schwa was replaced with the /a/ vowel.
The occurrence of the two long vowels /ɑː/, and /ɔː/ were realised in the data, but were not consistently produced in all the contexts tested. These two vowels were articulated when read in isolation, and in sentences but not when the speakers were speaking rapidly. In the interview section, the long vowel /ɔː/ was consistently shortened by the speakers to produce the /ɒ/ vowel. The long vowel /ɑː/ was also shortened in certain contexts, leading to the production of /a/ as its replacement. Additionally, English central vowel /ɜː/ was shortened and replaced with the short vowel /e/ in all the instances studied. We can therefore conclude that more than 70% of the Ghanaian speakers used in this study showed evidence of most English pure vowels in their speech. Further research can be conducted to widely explore the realisation of English long vowels using different set of Ghanaian speakers.
 CHRISTOPHER ANKOMAH is currently a PhD candidate at the University of Cape Coast, Ghana. His research interest includes phonetics and phonology, semantics, and varieties of English. His special interest is in acoustic phonetics. Christopher Ankomah is currently a college lecturer in St. Ambrose College of Education. Email: krisanko31@gmail.com


 Open access