


1 Introduction
A high-intensity laser pulse interacting with a plasma on the front surface of a solid target will generate a population of hot electrons that propagates into the target. The laser to electron conversion efficiency has been found to scale as a function of intensity[Reference Ping, Shepherd, Lasinski, Tabak, Chen, Chung, Fournier, Hansen, Kemp, Liedahl, Widmann, Wilks, Rozmus and Sherlock1, Reference Davies2]. The absorption efficiency depends on numerous laser pulse and plasma parameters, such as scale length of the preformed plasma[Reference Gray, Carroll, Yuan, Brenner, Burza, Coury, Lancaster, Lin, Li, Neely, Quinn, Tresca, Wahlström and McKenna3, Reference Rusby, Gray, Butler, Dance, Scott, Bagnoud, Zielbauer, McKenna and Neely4] and focal spot size[Reference Gray, Wilson, King, Williamson, Dance, Armstrong, Brabetz, Wagner, Zielbauer, Bagnoud, Neely and McKenna5], each of which changes how the laser energy is coupled to the electrons. The accelerated electrons typically have a thermal/Maxwellian or relativistic Maxwellian distribution of energies whose temperature directly scales to the on-shot laser intensity[Reference Wilks and Kruer6–Reference Haines, Wei, Beg and Stephens8], with temperatures from ${\approx}100~\text{keV}$
to several MeV for the highest achievable intensities[Reference Malka and Miquel9–Reference Mordovanakis, Masson-Laborde, Easter, Popov, Hou, Mourou, Rozmus, Haines, Nees and Krushelnick14]. Magnetic fields and resistivity changes caused by the high current of hot electrons as they traverse the target influence their transport[Reference Maclellan, Carroll, Gray, Booth, Burza, Desjarlais, Du, Gonzalez-Izquierdo, Neely, Powell, Robinson, Rusby, Scott, Yuan, Wahlström and McKenna15–Reference MacLellan, Carroll, Gray, Booth, Burza, Desjarlais, Du, Neely, Powell, Robinson, Scott, Yuan, Wahlström and McKenna17], resulting in unstable behaviour such as filamentation.
${\approx}100~\text{keV}$
to several MeV for the highest achievable intensities[Reference Malka and Miquel9–Reference Mordovanakis, Masson-Laborde, Easter, Popov, Hou, Mourou, Rozmus, Haines, Nees and Krushelnick14]. Magnetic fields and resistivity changes caused by the high current of hot electrons as they traverse the target influence their transport[Reference Maclellan, Carroll, Gray, Booth, Burza, Desjarlais, Du, Gonzalez-Izquierdo, Neely, Powell, Robinson, Rusby, Scott, Yuan, Wahlström and McKenna15–Reference MacLellan, Carroll, Gray, Booth, Burza, Desjarlais, Du, Neely, Powell, Robinson, Scott, Yuan, Wahlström and McKenna17], resulting in unstable behaviour such as filamentation.
The dynamics of these hot electrons as they travel through the target and reach the rear surface is of particular interest as they can generate high-energy X-rays that can be used for radiography[Reference Brenner, Mirfayzi, Rusby, Armstrong, Alejo, Wilson, Clarke, Ahmed, Butler, Haddock, Higginson, McClymont, Murphy, Notley, Oliver, Allott, Hernandez-Gomez, Kar, McKenna and Neely18] and drive the accelerating fields that can create beams of protons through target normal sheath acceleration (TNSA)[Reference Roth and Schollmeier19]. As the electrons reach the rear surface, they set up a charge separation between them and the target. This charge separation between the electrons and the rear surface will set up a very strong Debye sheath $({\approx}\text{TV}/\text{m})$
capable of ionizing the rear surface. The potential drop across this field restricts the escape of subsequent electrons, and as such, most electrons fail to overcome this electrostatic potential. They are then ‘reflected’ back into the target. These electrons traverse the target again in the opposite direction and can be reflected again in the fields at the target front surface, and can thus reflux multiple times within the target. These electrons are known as refluxing electrons.
$({\approx}\text{TV}/\text{m})$
capable of ionizing the rear surface. The potential drop across this field restricts the escape of subsequent electrons, and as such, most electrons fail to overcome this electrostatic potential. They are then ‘reflected’ back into the target. These electrons traverse the target again in the opposite direction and can be reflected again in the fields at the target front surface, and can thus reflux multiple times within the target. These electrons are known as refluxing electrons.
The kinetic behaviour of electrons on the rear surface has been analytically investigated by Grismayer et al.
[Reference Grismayer, Mora, Adam and Héron20] in 1D. The change in energy that the electron ( $\unicode[STIX]{x0394}\unicode[STIX]{x1D700}$
) experiences at the rear surface sheath is given as
$\unicode[STIX]{x0394}\unicode[STIX]{x1D700}$
) experiences at the rear surface sheath is given as
 $$\begin{eqnarray}\unicode[STIX]{x0394}\unicode[STIX]{x1D700}\simeq \frac{4\sqrt{2}}{3}\sqrt{\frac{Zm_{e}}{m_{i}}}\sqrt{\frac{\unicode[STIX]{x1D700}}{k_{B}T_{e}}}\left(\frac{3k_{B}T_{e}}{2}-\unicode[STIX]{x1D700}\right),\end{eqnarray}$$
where $\unicode[STIX]{x1D700}$
is the energy of the electron,
$\unicode[STIX]{x1D700}$
is the energy of the electron, $m_{i}$
and
$m_{i}$
and $m_{e}$
are the mass of the ion and electron, respectively,
$m_{e}$
are the mass of the ion and electron, respectively, $Z$
is the atomic number/ionization state of the plasma and
$Z$
is the atomic number/ionization state of the plasma and $k_{B}T_{e}$
is the hot-electron temperature of the plasma. This suggests that via collisional interactions with the hot plasma on the rear surface, electrons with energy greater than
$k_{B}T_{e}$
is the hot-electron temperature of the plasma. This suggests that via collisional interactions with the hot plasma on the rear surface, electrons with energy greater than $3k_{B}T_{e}/2$
will lose energy, whereas those with less energy will gain energy.
$3k_{B}T_{e}/2$
will lose energy, whereas those with less energy will gain energy.
Studies have shown that the refluxing electrons can influence the generation of accelerated protons on the rear surface. Several papers have shown through experiment and simulation that the maximum proton energy generated via the TNSA mechanism increases significantly as the target thickness is reduced[Reference Mackinnon, Sentoku, Patel, Price, Hatchett, Key, Andersen, Snavely and Freeman21, Reference Neely, Foster, Robinson, Lindau, Lundh, Persson, Wahlström and McKenna22]. Reducing the target thickness substantially below that of the laser wavelength, $\unicode[STIX]{x1D706}_{L}$
, can introduce additional acceleration mechanisms[Reference Robinson, Zepf, Kar, Evans and Bellei23] and result in relativistic self-induced transparency[Reference Powell, King, Gray, MacLellan, Gonzalez-Izquierdo, Stockhausen, Hicks, Dover, Rusby, Carroll, Padda, Torres, Kar, Clarke, Musgrave, Najmudin, Borghesi, Neely and McKenna24]; the combination of which can lead to measured proton energies near 100 MeV[Reference Higginson, Gray, King, Dance, Williamson, Butler, Wilson, Capdessus, Armstrong, Green, Hawkes, Martin, Wei, Mirfayzi, Yuan, Kar, Borghesi, Clarke, Neely and McKenna25]. Mackinnon et al.
[Reference Mackinnon, Sentoku, Patel, Price, Hatchett, Key, Andersen, Snavely and Freeman21] showed an increase in proton energies that was suggested to be due to re-acceleration of hot electrons as the laser pulse duration is longer than the recirculation time through the target. These re-accelerated electrons are then able to increase the field strength on the rear surface as they return multiple times. This will create stronger electric fields that drive the proton acceleration through the TNSA mechanism. The mechanism of re-accelerating the refluxing electrons was investigated experimentally and numerically by Gray et al.
[Reference Gray, Wilson, King, Williamson, Dance, Armstrong, Brabetz, Wagner, Zielbauer, Bagnoud, Neely and McKenna5], who showed empirically that the scaling of the laser absorption drastically differs as a function of intensity when the laser spot size or energy is varied. This was explained by the refluxing electrons remaining in the influence of the laser upon refluxing to the front surface when the laser focal spot size is large, and therefore re-entering the influence of the laser field to be accelerated again. If the focal spot is small, such as at tight focus, the recirculating electrons do not re-encounter the laser field, and therefore will not be re-accelerated.
$\unicode[STIX]{x1D706}_{L}$
, can introduce additional acceleration mechanisms[Reference Robinson, Zepf, Kar, Evans and Bellei23] and result in relativistic self-induced transparency[Reference Powell, King, Gray, MacLellan, Gonzalez-Izquierdo, Stockhausen, Hicks, Dover, Rusby, Carroll, Padda, Torres, Kar, Clarke, Musgrave, Najmudin, Borghesi, Neely and McKenna24]; the combination of which can lead to measured proton energies near 100 MeV[Reference Higginson, Gray, King, Dance, Williamson, Butler, Wilson, Capdessus, Armstrong, Green, Hawkes, Martin, Wei, Mirfayzi, Yuan, Kar, Borghesi, Clarke, Neely and McKenna25]. Mackinnon et al.
[Reference Mackinnon, Sentoku, Patel, Price, Hatchett, Key, Andersen, Snavely and Freeman21] showed an increase in proton energies that was suggested to be due to re-acceleration of hot electrons as the laser pulse duration is longer than the recirculation time through the target. These re-accelerated electrons are then able to increase the field strength on the rear surface as they return multiple times. This will create stronger electric fields that drive the proton acceleration through the TNSA mechanism. The mechanism of re-accelerating the refluxing electrons was investigated experimentally and numerically by Gray et al.
[Reference Gray, Wilson, King, Williamson, Dance, Armstrong, Brabetz, Wagner, Zielbauer, Bagnoud, Neely and McKenna5], who showed empirically that the scaling of the laser absorption drastically differs as a function of intensity when the laser spot size or energy is varied. This was explained by the refluxing electrons remaining in the influence of the laser upon refluxing to the front surface when the laser focal spot size is large, and therefore re-entering the influence of the laser field to be accelerated again. If the focal spot is small, such as at tight focus, the recirculating electrons do not re-encounter the laser field, and therefore will not be re-accelerated.
The number of reflux passes of the target that the electrons undergo has been investigated by Quinn et al.
[Reference Quinn, Yuan, Lin, Carroll, Tresca, Gray, Coury, Li, Li, Brenner, Robinson, Neely, Zielbauer, Aurand, Fils, Kuehl and McKenna26]. An experiment was conducted to monitor the flux and size of the K-alpha-emitting region from a Cu target with a fixed thickness. To increase the overall path of electrons as they transit the target, a layer of CH was introduced to the rear surface. The K-alpha X-ray signal emitted from the Cu target decreases as the overall target thickness is increased, as fewer electrons reflux through the Cu. Using modelling of the electron transport and K-alpha emission cross-sections, it was concluded that electrons with energies above 1 MeV could reflux over ten times inside a $20~\unicode[STIX]{x03BC}\text{m}$
Cu target. This was also more recently shown by Horný and Kilmo[Reference Vyskočil, Klimo and Weber27], who conducted a similar experiment.
$20~\unicode[STIX]{x03BC}\text{m}$
Cu target. This was also more recently shown by Horný and Kilmo[Reference Vyskočil, Klimo and Weber27], who conducted a similar experiment.
Refluxing electrons have also been shown to have an effect on the X-ray source size. Quinn et al. were able to show this using Cu K-alpha X-ray imaging, while Compant La Fontaine et al.
[Reference Armstrong, Brenner, Scott, Rusby, Liao, Liu, Li, Zhang, Zhang, Zhu, Zemaityte, Bradford, Woolsey, Oliveira, Spindloe, Wang, McKenna and Neely28] studied the X-ray source size for two different target thicknesses, 20 and $100~\unicode[STIX]{x03BC}\text{m}$
, using a penumbral imaging detector, showing that the source size increases by a factor of two for the thinner target. This was likely due to the electrons being able to reflux through the target for an increased number of times, which was modelled using particle-in-cell (PIC) simulations. As the electrons pass through the target, they spread laterally, causing the area producing X-rays to increase. This was also shown recently by Vyskočil et al.
[Reference Horný and Klimo29], who incorporated Bremsstrahlung into PIC simulations to demonstrate that, for thin targets, the X-ray production will spread out laterally due to the refluxing of electrons. Armstrong et al.
[Reference Compant La Fontaine, Courtois, Lefebvre, Bourgade, Landoas, Thorp and Stoeckl30] were able to control the overall X-ray source size by reducing the intensity on the target by increasing the focal spot size, which reduced the temperature of the electrons. This caused the electrons to reflux less due to their lower energy, stop in the target earlier, and therefore spread less throughout the target.
$100~\unicode[STIX]{x03BC}\text{m}$
, using a penumbral imaging detector, showing that the source size increases by a factor of two for the thinner target. This was likely due to the electrons being able to reflux through the target for an increased number of times, which was modelled using particle-in-cell (PIC) simulations. As the electrons pass through the target, they spread laterally, causing the area producing X-rays to increase. This was also shown recently by Vyskočil et al.
[Reference Horný and Klimo29], who incorporated Bremsstrahlung into PIC simulations to demonstrate that, for thin targets, the X-ray production will spread out laterally due to the refluxing of electrons. Armstrong et al.
[Reference Compant La Fontaine, Courtois, Lefebvre, Bourgade, Landoas, Thorp and Stoeckl30] were able to control the overall X-ray source size by reducing the intensity on the target by increasing the focal spot size, which reduced the temperature of the electrons. This caused the electrons to reflux less due to their lower energy, stop in the target earlier, and therefore spread less throughout the target.
Upon reaching the rear surface, if the hot electrons overcome the electrostatic forces at the rear surface of the target, they will escape into free space; these are known as escaping electrons. Link et al. [Reference Link, Freeman, Schumacher and Van Woerkom31] modelled (in 1D) the escaping electrons by first assuming a temporally evolving hot-electron distribution created from the laser. These electrons are then tested to see whether they have enough energy to escape the target, which is modelled as an ideal capacitor. This model gives a basic insight into the temporally evolving field on the rear surface that leads to the cooling of the hot electrons upon escaping. Later in the same paper, they showed similar results using 2D LSP PIC simulations. The escaping electrons are often measured using electron spectrometers to determine the hot-electron temperature but, as Link et al. showed, this might not be truly representative of the internal electron population as the electron temperature ‘cools’ upon leaving the target. This cooling was calculated to be as great as 30 % in some cases. This is much higher than that shown by Grismayer et al. [Reference Grismayer, Mora, Adam and Héron20], which shows that the temporally evolving electric field is more important than the collisional plasma in the energy changes on the rear surface.
Here, using the PIC code EPOCH[Reference Arber, Bennett, Brady, Lawrence-Douglas, Ramsay, Sircombe, Gillies, Evans, Schmitz, Bell and Ridgers32], we investigate the temporal and spectral characteristics of the refluxing and escaping electrons while also observing information about the field strength at the rear of the target. We identify the refluxing and escaping electron populations using particle tracking and show that the temperature of each is lower than that of the initial hot-electron population accelerated by the laser. Using these tracking methods, we can temporally determine the energy of each population of electrons. Finally, we also demonstrate that the changes in electron energy are strongly related to the field by tracking the electrons as they experience the field. Both the refluxing (Section 4) and escaping (Section 5) electron populations are discussed separately after sections describing the simulation methodology (Section 2) and the analysis of the simulated electric field (Section 3).
2 Simulation methodology
The PIC code EPOCH was used to simulate a laser focusing onto a planar solid target. The spatial size of the simulation box was set to $120~\unicode[STIX]{x03BC}\text{m}\times 100~\unicode[STIX]{x03BC}\text{m}$
(
$120~\unicode[STIX]{x03BC}\text{m}\times 100~\unicode[STIX]{x03BC}\text{m}$
( $x$
and
$x$
and $y$
respectively), which was made up of
$y$
respectively), which was made up of $5500\times 5000$
cells. This yields a spatial resolution of 20 nm. The target thickness was set to
$5500\times 5000$
cells. This yields a spatial resolution of 20 nm. The target thickness was set to $25~\unicode[STIX]{x03BC}\text{m}$
with an atomic mass of 4. The electron density was set to 50 times the critical density. The particles per cell were set to 30. The laser has a pulse duration full-width at half-maximum (FWHM) of 175 fs and is incident at
$25~\unicode[STIX]{x03BC}\text{m}$
with an atomic mass of 4. The electron density was set to 50 times the critical density. The particles per cell were set to 30. The laser has a pulse duration full-width at half-maximum (FWHM) of 175 fs and is incident at $0^{\circ }$
with respect to target normal with the target plane at
$0^{\circ }$
with respect to target normal with the target plane at $x=0$
. The laser is entering the simulation at through the negative
$x=0$
. The laser is entering the simulation at through the negative $x$
plane and propagating in the positive
$x$
plane and propagating in the positive $x$
direction. A pre-plasma is also introduced at the front of the target to improve the absorption/coupling of the laser energy into the hot electrons. This pre-plasma has a short scale length of
$x$
direction. A pre-plasma is also introduced at the front of the target to improve the absorption/coupling of the laser energy into the hot electrons. This pre-plasma has a short scale length of $2~\unicode[STIX]{x03BC}\text{m}$
, which has been estimated previously using hydrodynamic codes in earlier studies[Reference McKenna, Carroll, Lundh, Nürnberg, Markey, Bandyopadhyay, Batani, Evans, Jafer, Kar, Neely, Pepler, Quinn, Redaelli, Roth, Wahlström, Yuan and Zepf33–Reference Wagner, Bedacht, Ortner, Roth, Tauschwitz, Zielbauer and Bagnoud35]. Typically, a long pre-plasma on the front surface of the solid target is induced by a pre-pulse or a secondary heating beam. Here we do not use a longer scale length and instead simulate the interaction using a shorter scale length that is typical of a high-contrast laser pulse and/or the use of plasma optics[Reference Dromey, Kar, Zepf and Foster36].
$2~\unicode[STIX]{x03BC}\text{m}$
, which has been estimated previously using hydrodynamic codes in earlier studies[Reference McKenna, Carroll, Lundh, Nürnberg, Markey, Bandyopadhyay, Batani, Evans, Jafer, Kar, Neely, Pepler, Quinn, Redaelli, Roth, Wahlström, Yuan and Zepf33–Reference Wagner, Bedacht, Ortner, Roth, Tauschwitz, Zielbauer and Bagnoud35]. Typically, a long pre-plasma on the front surface of the solid target is induced by a pre-pulse or a secondary heating beam. Here we do not use a longer scale length and instead simulate the interaction using a shorter scale length that is typical of a high-contrast laser pulse and/or the use of plasma optics[Reference Dromey, Kar, Zepf and Foster36].
EPOCH is capable of tracking macro-particles by assigning a unique identifier to each macro-particle, and this has been used previously to identify and analyse the dynamics of hot electrons in laser–solid target simulations[Reference Krygier, Schumacher and Freeman37, Reference Robinson, Arefiev and Neely38]. However, often only a small subset (max $10^{4}$
) of selected particles are used to perform the analysis. Here we intend to analyse the dynamics of
$10^{4}$
) of selected particles are used to perform the analysis. Here we intend to analyse the dynamics of ${>}10^{6}$
macro-particles to gain a better understanding of the bulk dynamics influencing the hot-electron population.
${>}10^{6}$
macro-particles to gain a better understanding of the bulk dynamics influencing the hot-electron population.
The simulation was conducted multiple times for different laser intensities, from $10^{19}$
to
$10^{19}$
to $10^{21}~\text{W}/\text{cm}^{2}$
, by varying the laser energy and keeping the focal spot size constant. Only electrons with kinetic energies greater than 0.25 MeV are output from the simulation, with a temporal steps of 10 fs. Additional simulations were conducted at
$10^{21}~\text{W}/\text{cm}^{2}$
, by varying the laser energy and keeping the focal spot size constant. Only electrons with kinetic energies greater than 0.25 MeV are output from the simulation, with a temporal steps of 10 fs. Additional simulations were conducted at $5\times 10^{19}~\text{W}/\text{cm}^{2}$
and
$5\times 10^{19}~\text{W}/\text{cm}^{2}$
and $5\times 10^{20}~\text{W}/\text{cm}^{2}$
at lower temporal and spatial resolution in order to gain more information about the electric fields.
$5\times 10^{20}~\text{W}/\text{cm}^{2}$
at lower temporal and spatial resolution in order to gain more information about the electric fields.
Identifying the different electron distributions requires the use of logical checks, such as if the electron has reached the rear of the target with positive momentum. In particular, the position check can be described as a boundary that can be placed to identify the particles that pass it. The unique particle ID of each macro-particle that meets the criteria of passing any of the defined boundaries is recorded. Afterwards, each EPOCH output from each time step is analysed and the particle IDs of those that fulfil desired criteria are stored. Then, their position, momentum and kinetic energy are sorted temporally such that we can track each electron throughout the simulation.
Before exploring the refluxing and escaping electrons using the methods discussed above, we analyse the electric fields generated on the rear surface that affect both populations of electrons.
The electric field in the $x$
direction from the
$x$
direction from the $1\times 10^{20}~\text{W}/\text{cm}^{2}$
simulation and the middle of the target as a function of time. We see that the fields peak at approximately 0.45 ps into the simulation. The dashed line represents the fast component of the field that is caused by the relativistic escaping electrons. The slower component, represented by the dotted line, is the field associated with the TSNA mechanism.
$1\times 10^{20}~\text{W}/\text{cm}^{2}$
simulation and the middle of the target as a function of time. We see that the fields peak at approximately 0.45 ps into the simulation. The dashed line represents the fast component of the field that is caused by the relativistic escaping electrons. The slower component, represented by the dotted line, is the field associated with the TSNA mechanism.

3 Electric fields
As the laser was incident at $0^{\circ }$
relative to the normal of the target surface, the peak of the electric field appears in the middle of the target, centred on the laser axis. To visualize the temporally evolving electric field on the rear surface we take a mean of the electric field at
$0^{\circ }$
relative to the normal of the target surface, the peak of the electric field appears in the middle of the target, centred on the laser axis. To visualize the temporally evolving electric field on the rear surface we take a mean of the electric field at $y=0$
. Using this, we can observe how the field expands into the vacuum at the rear surface; this is shown in Figure 1 for the
$y=0$
. Using this, we can observe how the field expands into the vacuum at the rear surface; this is shown in Figure 1 for the $1\times 10^{20}~\text{W}/\text{cm}^{2}$
simulation. There are two peak field structures that are travelling at different velocities away from the target. The dashed red line represents the fast field, which is likely caused by relativistic electrons. This field is moving away from the target at close to the speed of light c. The slower field, represented by the red dotted line, is travelling at
$1\times 10^{20}~\text{W}/\text{cm}^{2}$
simulation. There are two peak field structures that are travelling at different velocities away from the target. The dashed red line represents the fast field, which is likely caused by relativistic electrons. This field is moving away from the target at close to the speed of light c. The slower field, represented by the red dotted line, is travelling at ${\sim}4.2\times 10^{7}~\text{m}/\text{s}$
. These fields are likely caused by a fast escaping electron population and a slower plasma expansion, respectively, which are discussed in detail in Section 5.
${\sim}4.2\times 10^{7}~\text{m}/\text{s}$
. These fields are likely caused by a fast escaping electron population and a slower plasma expansion, respectively, which are discussed in detail in Section 5.
The peak of the electric field occurs at approximately 0.45 ps into the simulations; this is similar for all the simulations. The peak electric field scales with intensity, as shown in Figure 2; this scaling is approximately $E_{\text{peak}}\propto I^{0.5}$
. This arises because the number of electrons accelerated increases as a function of laser intensity, which is due to both increased absorption of laser energy into electrons[Reference Davies2] and the associated increase in laser energy with the laser intensity for a fixed pulse duration. The time-integrated number of hot electrons above 1 MeV that reach the rear of the particle (using the boundaries discussed in later sections) as a function of incident laser intensity is shown in Figure 2 inset. The number of hot electrons increases as a function of laser intensity (
$E_{\text{peak}}\propto I^{0.5}$
. This arises because the number of electrons accelerated increases as a function of laser intensity, which is due to both increased absorption of laser energy into electrons[Reference Davies2] and the associated increase in laser energy with the laser intensity for a fixed pulse duration. The time-integrated number of hot electrons above 1 MeV that reach the rear of the particle (using the boundaries discussed in later sections) as a function of incident laser intensity is shown in Figure 2 inset. The number of hot electrons increases as a function of laser intensity ( $N_{e({>}1\,\text{MeV})}=I^{{\sim}0.9}$
). The number of hot electrons as a function of the peak rear surface electric field in Figure 2 inset demonstrates that they are directly related to each other. These scale with
$N_{e({>}1\,\text{MeV})}=I^{{\sim}0.9}$
). The number of hot electrons as a function of the peak rear surface electric field in Figure 2 inset demonstrates that they are directly related to each other. These scale with $N_{e}\propto E_{\text{peak}}^{{\sim}1.8}$
, which is close to that which has been modelled analytically using plasma expansion,
$N_{e}\propto E_{\text{peak}}^{{\sim}1.8}$
, which is close to that which has been modelled analytically using plasma expansion, $E_{\text{peak}}\propto \sqrt{N_{e}}$
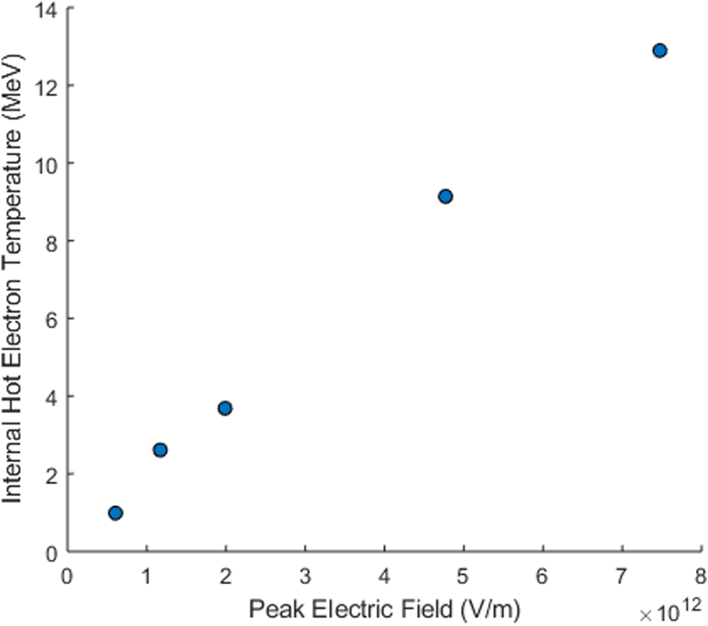
[Reference Roth and Schollmeier19, Reference Mora39]. Figure 3 shows the internal hot-electron temperature as a function of the peak electric field.
$E_{\text{peak}}\propto \sqrt{N_{e}}$
[Reference Roth and Schollmeier19, Reference Mora39]. Figure 3 shows the internal hot-electron temperature as a function of the peak electric field.
These temporally evolving fields play an important role in the electron dynamics, restricting some of them from escaping and causing many to reflux. We have observed higher laser intensities lead to higher electric fields. This is primarily caused by the greater number of electrons due to both the increased absorption and increased input laser energy. We also expect the temperature of the hot-electron population to increase with incident laser intensity[Reference Wilks and Kruer6, Reference Beg, Bell, Dangor, Danson, Fews, Glinsky, Hammel, Lee, Norreys and Tatarakis7], causing a larger number of electrons to possess higher energy and potentially enable them to escape the target. Next, we investigate the refluxing electrons using the particle tracking techniques discussed earlier.
The simulated peak electric field as a function of incident laser intensity. Inset, the peak electric field as a function of the number of relativistic electrons.

The internal hot-electron temperature (which is discussed further in Section 4) as a function of the peak electric field.

The internal and refluxing electron spectra for three different laser intensities. A simple Boltzmann fit was applied to the data and the temperature determined.

4 Refluxing electrons
As stated previously, refluxing electrons are those that reach the rear of target and, due to the electrostatic potential on the rear surface, are reflected into it. To analyse this, a diagnostic boundary is placed within the target. This is positioned $2.5~\unicode[STIX]{x03BC}\text{m}$
from the rear surface, inside of the
$2.5~\unicode[STIX]{x03BC}\text{m}$
from the rear surface, inside of the $25~\unicode[STIX]{x03BC}\text{m}$
target to ensure that the monitored macro-particles are reaching the rear surface. If a macro-particle passes this boundary initially in the forward direction, and then at some time later in the returning direction, it is counted as a refluxing electron. To perform systematic analysis of these refluxing electrons, all parameters, such as the time, position at which they passed the boundary, and their energy are recorded. The time-integrated spectra of the refluxing electrons, which are taken as they pass by the boundary with negative
$25~\unicode[STIX]{x03BC}\text{m}$
target to ensure that the monitored macro-particles are reaching the rear surface. If a macro-particle passes this boundary initially in the forward direction, and then at some time later in the returning direction, it is counted as a refluxing electron. To perform systematic analysis of these refluxing electrons, all parameters, such as the time, position at which they passed the boundary, and their energy are recorded. The time-integrated spectra of the refluxing electrons, which are taken as they pass by the boundary with negative $x$
momentum, are compared to the initial population of hot electrons. The time-integrated spectra for the refluxing electrons and initial hot electrons are shown in Figure 4 for the three intensities of
$x$
momentum, are compared to the initial population of hot electrons. The time-integrated spectra for the refluxing electrons and initial hot electrons are shown in Figure 4 for the three intensities of $1\times 10^{19}$
,
$1\times 10^{19}$
, $1\times 10^{20}$
, and
$1\times 10^{20}$
, and $1\times 10^{21}~\text{W}/\text{cm}^{2}$
. The temperature of each spectrum is quoted in the legend. The initial internal hot-electron temperature scales with intensity, as expected. The temperature of the refluxing spectrum for each simulation is noticeably lower than the initial temperature. Assuming the plasma temperature is the same as the hot-electron temperature, Equation (1) predicts that for a plasma with
$1\times 10^{21}~\text{W}/\text{cm}^{2}$
. The temperature of each spectrum is quoted in the legend. The initial internal hot-electron temperature scales with intensity, as expected. The temperature of the refluxing spectrum for each simulation is noticeably lower than the initial temperature. Assuming the plasma temperature is the same as the hot-electron temperature, Equation (1) predicts that for a plasma with $Z=1$
the temperature should only reduce by approximately 2%, whereas we see a temperature cooling of up to
$Z=1$
the temperature should only reduce by approximately 2%, whereas we see a temperature cooling of up to ${\sim}40\%$
. As collisions were not included in our simulation, the cooling must be caused by other processes. Firstly, some electrons will escape the target, which will be investigated later, and clearly will not be counted towards the refluxing spectra. Secondly, some of the energy will go into creating and driving the sheath fields and accelerating protons.
${\sim}40\%$
. As collisions were not included in our simulation, the cooling must be caused by other processes. Firstly, some electrons will escape the target, which will be investigated later, and clearly will not be counted towards the refluxing spectra. Secondly, some of the energy will go into creating and driving the sheath fields and accelerating protons.
(a) The initial energy of the electrons prior to refluxing plotted as a function of the refluxed energy. The red dotted line represents energy equality before and after interacting with the sheath. (b) The energy difference of the refluxing electrons as a function of time. Some electrons gain energy. The largest gains and loses are observed for electrons which reach the rear of the target at the peak of the electric field.

With the particle tracking, we have the ability to analyse each macro-particle. To analyse the cooling of the refluxing electrons further, we can record the energy before and after the electrons interact with the sheath. Figure 5(a) shows the initial energy as a function of the energy after refluxing. The initial energy is defined as the energy that the electron has as it passes the internal boundary. If an electron is to the right of the red line, which represents the line of energy equality, it has lost energy. The highest proportion of electrons are in the low-energy regions. The majority of these electrons experience little change in their energy; this is shown in Figure 5(a), as the brightest region appears at low initial and refluxed energy, and hence small energy changes. We also see that some electrons are to the right of the dashed line, which suggests although the overall population of electrons has cooled (as seen in Figure 4), some electrons have gained energy.
To show the temporal evolution of the electron energies, the difference between the initial energy and refluxed energy of each macro-particle is calculated and plotted as a function of when they pass the boundary for the first time; this is shown in Figure 5(b). One should note that the time plotted is that of the electrons when they pass the boundary, which is $2.5~\unicode[STIX]{x03BC}\text{m}$
from the rear surface. The vast majority of all the electrons retain similar energy, as shown by Figure 5(b).
$2.5~\unicode[STIX]{x03BC}\text{m}$
from the rear surface. The vast majority of all the electrons retain similar energy, as shown by Figure 5(b).
In order for an electron to lose or gain energy, it must do work or work must be done upon it, respectively. In our case, work is done to/by the electric field that the hot electrons establish on the rear surface of the target. Similarly, the electrons gain energy from work being done upon them by the high-intensity laser on the front surface. The electrons that gain or lose energy must experience a net change in potential as they reflux ( $\unicode[STIX]{x0394}U\neq 0$
). Therefore, the field must change within the time frame of them being present on the rear. From Figure 1 we see that the field is constantly changing on the middle of the target. Each point on the target will have a similar temporal and spatial evolution that influences the electrons such that they can gain or lose significant amounts of energy; although you would expect the strongest fields in the middle of the target, where the hot-electron density is highest. We would expect that for the electrons to gain energy, the electric field would be stronger upon refluxing and, for those that lose energy, the electric field would be weaker. For the majority of electrons, the work done is approximately zero, as the majority retain similar energies (
$\unicode[STIX]{x0394}U\neq 0$
). Therefore, the field must change within the time frame of them being present on the rear. From Figure 1 we see that the field is constantly changing on the middle of the target. Each point on the target will have a similar temporal and spatial evolution that influences the electrons such that they can gain or lose significant amounts of energy; although you would expect the strongest fields in the middle of the target, where the hot-electron density is highest. We would expect that for the electrons to gain energy, the electric field would be stronger upon refluxing and, for those that lose energy, the electric field would be weaker. For the majority of electrons, the work done is approximately zero, as the majority retain similar energies ( $\unicode[STIX]{x0394}U\approx 0$
), as we see in Figure 5(a). This can be achieved when refluxing if the field has remained the same during the time the electron takes to change direction.
$\unicode[STIX]{x0394}U\approx 0$
), as we see in Figure 5(a). This can be achieved when refluxing if the field has remained the same during the time the electron takes to change direction.
The overall energy of the refluxing spectrum is ‘cooler’ than that of the initial spectrum; this is shown in Figure 4 explicitly, but also clear from Figure 5(b), as more electrons are losing vast amounts of energy compared to those that gain vast amounts. However, the majority clearly do retain similar energies. From the $1\times 10^{20}~\text{W}/\text{cm}^{2}$
simulation we calculate that 61% of the refluxing electrons lose energy, with this population losing an average of
$1\times 10^{20}~\text{W}/\text{cm}^{2}$
simulation we calculate that 61% of the refluxing electrons lose energy, with this population losing an average of ${\sim}0.23~\text{MeV}$
per electron. Although, as stated previously and shown in Figure 5(a), most electrons retain similar energies; we calculate almost 80% of the electrons gain or lose
${\sim}0.23~\text{MeV}$
per electron. Although, as stated previously and shown in Figure 5(a), most electrons retain similar energies; we calculate almost 80% of the electrons gain or lose ${<}0.5~\text{MeV}$
.
${<}0.5~\text{MeV}$
.
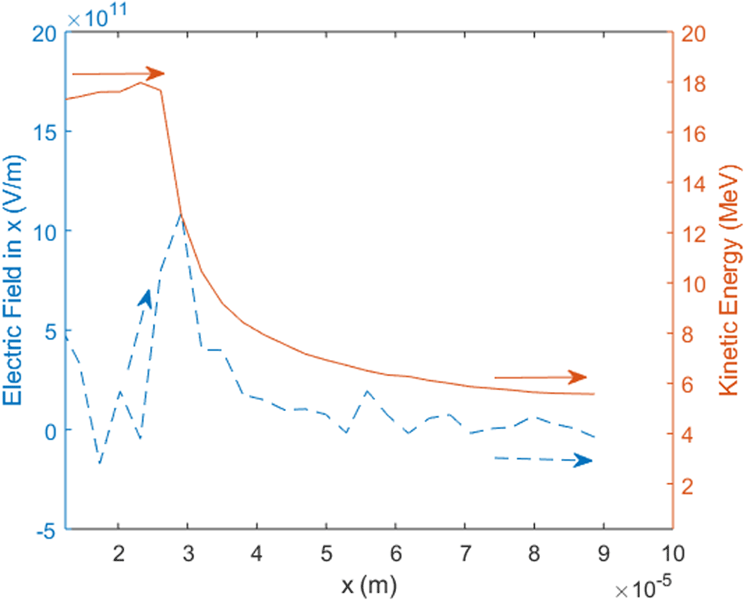
Using the particle tracking and the output of the electric fields, the field strength, position and energy of each electron can be found. Using this we can show the conditions that allow for the energy loss and energy gain scenarios. Figure 6 shows the kinetic energy of an electron and the electric field that it experiences as a function of $x$
position. The arrows indicate the direction of travel, while the black dotted line represents the rear surface of the target. The electron initially exits the target and experiences a strong field that reduces its kinetic energy to zero before accelerating it back into the target. The accelerating field is noticeably weaker than the field that de-accelerated it, resulting in a net energy loss to the electron. Figure 7 shows an example of energy gain, where an electron experiences a much stronger field upon returning into the target, thus accelerated to higher velocities due to the net change in potential. The changes in electric field experienced by each electron in these cases are due to the temporally evolving electric field, as shown in Figure 1. An electron reaching the rear of the target will experience the field present at that time. If the electron is outside or in the region of the field for a significant time, the strength of the electric field will change. This causes the previously mentioned condition (
$x$
position. The arrows indicate the direction of travel, while the black dotted line represents the rear surface of the target. The electron initially exits the target and experiences a strong field that reduces its kinetic energy to zero before accelerating it back into the target. The accelerating field is noticeably weaker than the field that de-accelerated it, resulting in a net energy loss to the electron. Figure 7 shows an example of energy gain, where an electron experiences a much stronger field upon returning into the target, thus accelerated to higher velocities due to the net change in potential. The changes in electric field experienced by each electron in these cases are due to the temporally evolving electric field, as shown in Figure 1. An electron reaching the rear of the target will experience the field present at that time. If the electron is outside or in the region of the field for a significant time, the strength of the electric field will change. This causes the previously mentioned condition ( $\unicode[STIX]{x0394}U\neq 0$
), allowing for energy gain or loss.
$\unicode[STIX]{x0394}U\neq 0$
), allowing for energy gain or loss.
Simulations at three different intensities were conducted with outputs at high temporal resolution. We see similar results to those shown in Figure 5. As can be expected, the change in intensity does lead to changes that are largely energy related, but some differences are caused by the effects due to the field strength. From Figure 2 we see that the peak electric field scales with intensity. This leads to a higher energy loss and gain for higher intensities and a lower energy loss and gain for lower intensities.
The kinetic energy and electric field of a tracked electron as a function of distance. The arrows depict the direction of travel for the electron.

Similar to Figure 6, the kinetic energy and electric field of a tracked electron as a function of distance. The break in the lines occurs as the electron drops below the energy threshold set for the outputs.

The refluxing electrons are those failing to overcome the electric fields that are present on the rear surface of the target and returning into the target. These represent 95% of the initial accelerated hot-electron population, which agrees with the capacitor model developed by Myatt et al.
[Reference Myatt, Theobald, Delettrez, Stoeckl, Storm, Sangster, Maximov and Short40]. Therefore, the remaining 5% must either escape, be trapped on the rear surface (this includes loss of all their energy or never crossing the internal boundary again), or their energy has reduced below the threshold of the outputs $({<}250~\text{keV})$
. We next analyse the escaping electron population.
$({<}250~\text{keV})$
. We next analyse the escaping electron population.
5 Escaping electrons
Intuitively, the escaping electrons are expected to be those with the highest energy since, as stated before, they need to overcome the electric fields. However, as the earliest electrons reach the rear of the target, the electric field is at a minimum. These electrons will also have low energy in comparison to the average of the entire distribution, as they were accelerated by the rising edge of the pulse. Some of these electrons should still be able to escape, as the electric field is low and the energy threshold for escaping will be lower. This is neatly explained by the capacitor model demonstrated by Link et al. [Reference Link, Freeman, Schumacher and Van Woerkom31].
Internal and escaping electron spectra for three different laser intensities. Also plotted are the escaping electron spectra while those electrons are still inside the target.

To analyse the escaping electrons, we use the same diagnostic boundary that is inside the target for the refluxing electrons, and add a diagnostic boundary that is placed outside the target. In this case, the second boundary is placed at $60~\unicode[STIX]{x03BC}\text{m}$
in the simulation, or
$60~\unicode[STIX]{x03BC}\text{m}$
in the simulation, or $35~\unicode[STIX]{x03BC}\text{m}$
from the rear surface of the target. If an electron passes both of these boundaries with positive
$35~\unicode[STIX]{x03BC}\text{m}$
from the rear surface of the target. If an electron passes both of these boundaries with positive $x$
momentum, it can be considered an escaping electron.
$x$
momentum, it can be considered an escaping electron.
The spectra for the internal and escaping electrons for intensities ranging from $10^{19}$
to
$10^{19}$
to $10^{21}~\text{W}/\text{cm}^{2}$
are shown in Figure 8. The temperatures of the spectrum are shown in the legend. The temperature of escaping electrons also experience a cooling compared to the internal hot-electron temperature. This temperature cooling is greater than that shown by Link et al.; however, this could be down to a number of reasons. Firstly, the interaction of the laser on a target is not included in the simulations conducted by Link et al.; instead an idealized electron beam is utilized, which will lead to differences between the results discussed here. Secondly, the target conditions are different, as are the laser conditions, particularly the pulse duration.
$10^{21}~\text{W}/\text{cm}^{2}$
are shown in Figure 8. The temperatures of the spectrum are shown in the legend. The temperature of escaping electrons also experience a cooling compared to the internal hot-electron temperature. This temperature cooling is greater than that shown by Link et al.; however, this could be down to a number of reasons. Firstly, the interaction of the laser on a target is not included in the simulations conducted by Link et al.; instead an idealized electron beam is utilized, which will lead to differences between the results discussed here. Secondly, the target conditions are different, as are the laser conditions, particularly the pulse duration.
As we record the electrons internally and externally, we can identify the escaping electrons when they are inside the target. The energy that the escaping electrons had when they first passed the internal boundary is shown in Figure 8. Unsurprisingly, the electrons that are most likely to escape across all the intensities are the ones that have the highest initial energy. None of these high-energy internal electrons retain their internal energy when they escape, which is shown by the lack of the highest energies in the escaping electron spectrum.
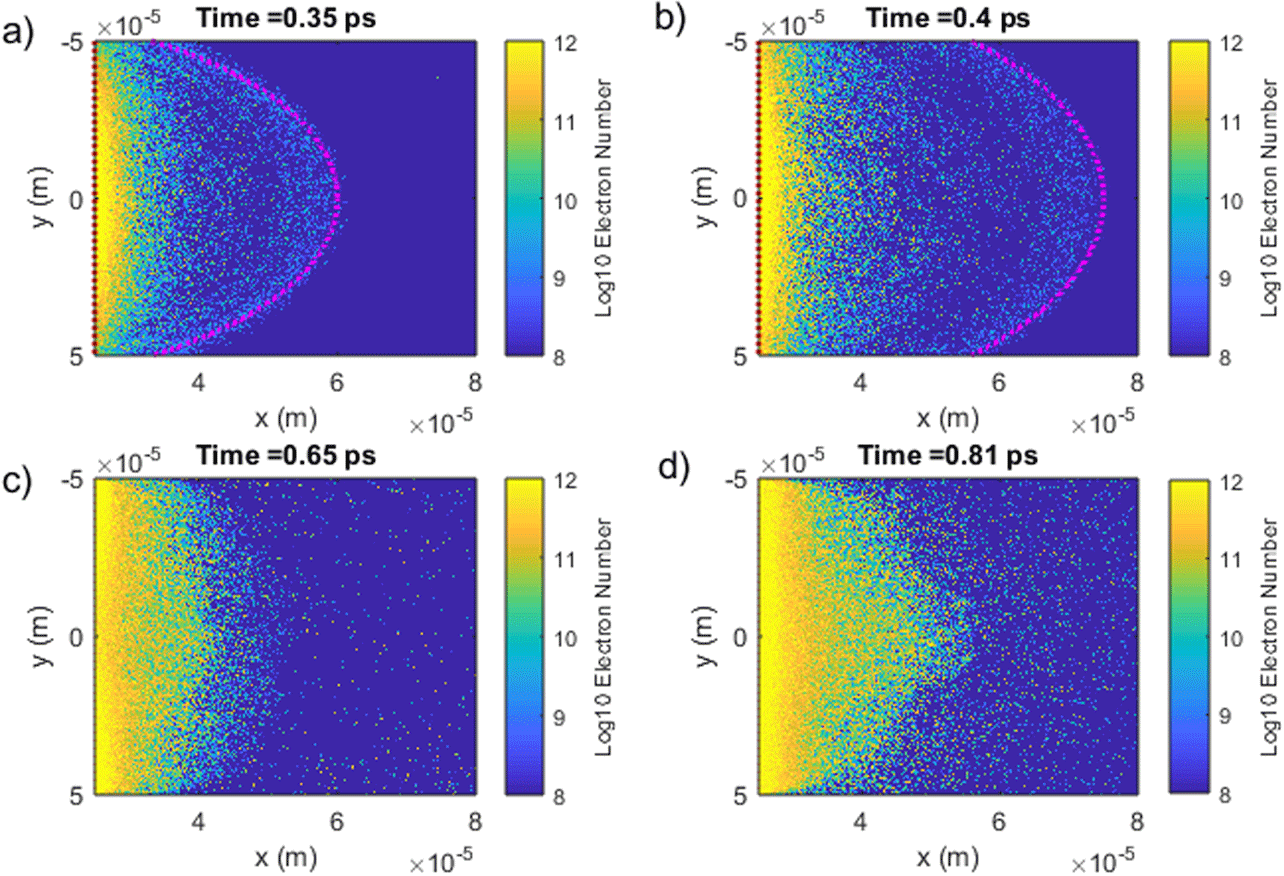
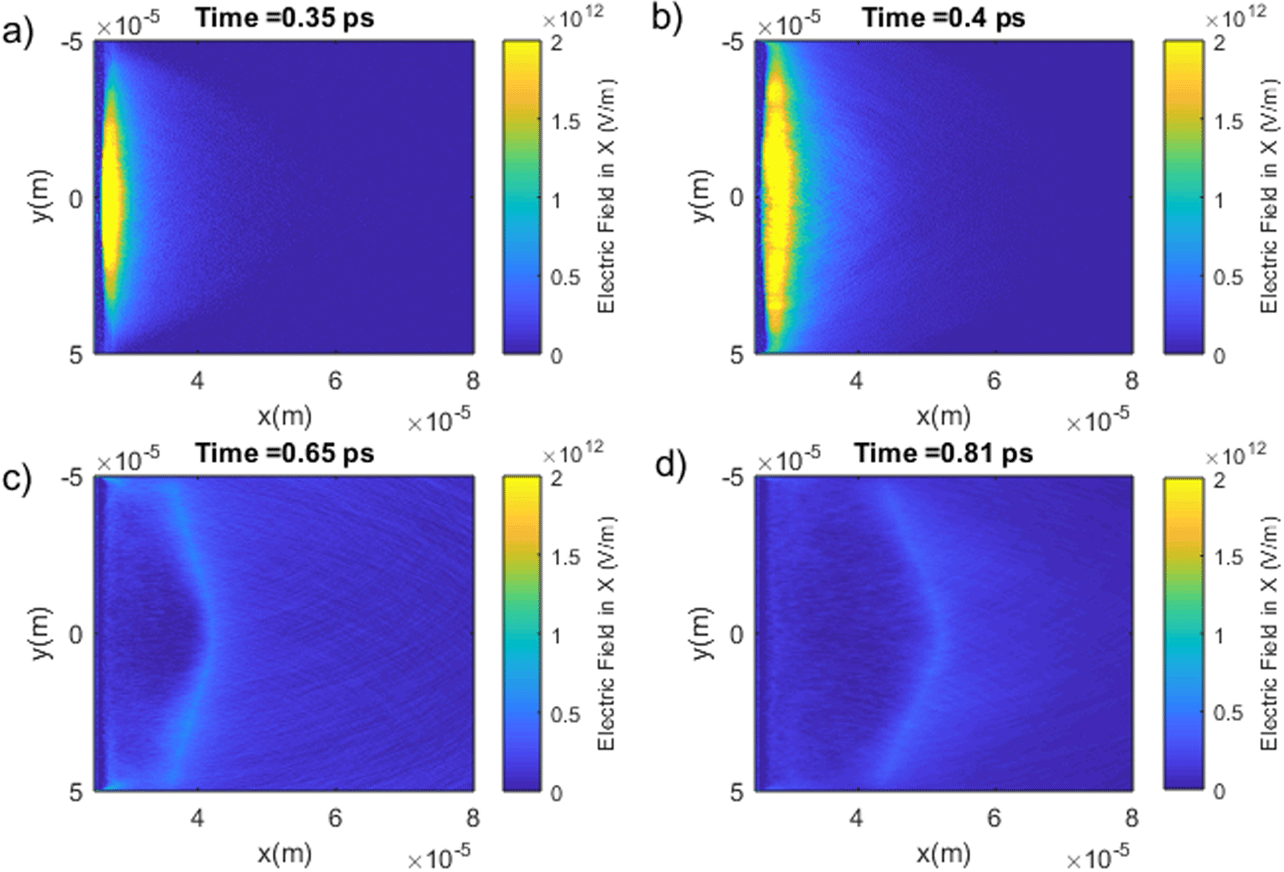
A map of the hot electrons with energies above 1 MeV and outside the target four time steps is shown in Figures 9(a)–9(d). From Figures 9(a) and 9(b), there is a population of escaping electrons that ballistically escape the target at near the speed of light; the front of these electrons is marked with the dashed red line. At the later time steps, shown in Figures 9(c) and 9(d), there are many more electrons leaving the target. Also shown in Figure 10 are the rear surface electric fields at the same time as the escaping electron positions in Figure 9. Initially the field is strong but close to the target (Figures 10(a) and 10(b)); if the electrons initially overcome this they are likely to escape. At later times (Figures 10(c) and 10(d)) the field is further away from the target, which coincides with the expansion of the sheath and the position of the electrons in Figures 9(c) and 9(d), and is responsible for proton acceleration. The temporal evolution of this field expansion is also shown earlier in Section 3 in Figure 1.
Individually the sheath electrons are moving fast, as they have energies greater than 1 MeV, but the population is moving slowly. By the end of the simulation at 1 ps, the ‘front’ of the plasma electrons has reached $25~\unicode[STIX]{x03BC}\text{m}$
from the rear surface. The electrons that are ‘trapped’ in the plasma expansion oscillate within this region outside the target; often travelling back and forth in the plasma with circular and refluxing motions. This makes it difficult to measure the true escaping energy of an individual electron, as it will continuously change as the sheath expands.
$25~\unicode[STIX]{x03BC}\text{m}$
from the rear surface. The electrons that are ‘trapped’ in the plasma expansion oscillate within this region outside the target; often travelling back and forth in the plasma with circular and refluxing motions. This makes it difficult to measure the true escaping energy of an individual electron, as it will continuously change as the sheath expands.
The ballistic electrons, however, travel away from the target at almost the speed of light and have left the simulation by ${\approx}\,500~\text{fs}$
. They can also be easily identified, as they cross the external boundary early in comparison to the sheath electrons. We can perform the same analysis as was conducted on the refluxing electron population on the ballistic electrons. To do this, we set the threshold for reaching the external boundary at 650 fs in order to filter out the sheath/plasma electrons.
${\approx}\,500~\text{fs}$
. They can also be easily identified, as they cross the external boundary early in comparison to the sheath electrons. We can perform the same analysis as was conducted on the refluxing electron population on the ballistic electrons. To do this, we set the threshold for reaching the external boundary at 650 fs in order to filter out the sheath/plasma electrons.
Electron density maps of electrons with energies greater than 1 MeV at the rear of the target at four different time steps. (a) and (b) show the ‘ballistic’ electrons that escape the target. The red dotted line represents the front of these electrons, which is travelling at the speed of light. (c) and (d) are taken at much later time in the simulation. At this time the rear surface sheath has begun to expand. This expansion is much slower, but contains much more electrons than the ballistic escaping electrons.

Spatial maps of the electric field at the rear of the target at four time steps that coincide with those shown in Figure 9. Initially the electric field is strong, (a) and (b), restricting the electrons from escaping. Those that do, escape ballistically, as shown in Figures 9(a) and 9(b). At later times, (c) and (d), the sheath field is expanding out of the rear of the target, allowing the plasma electrons to also expand.

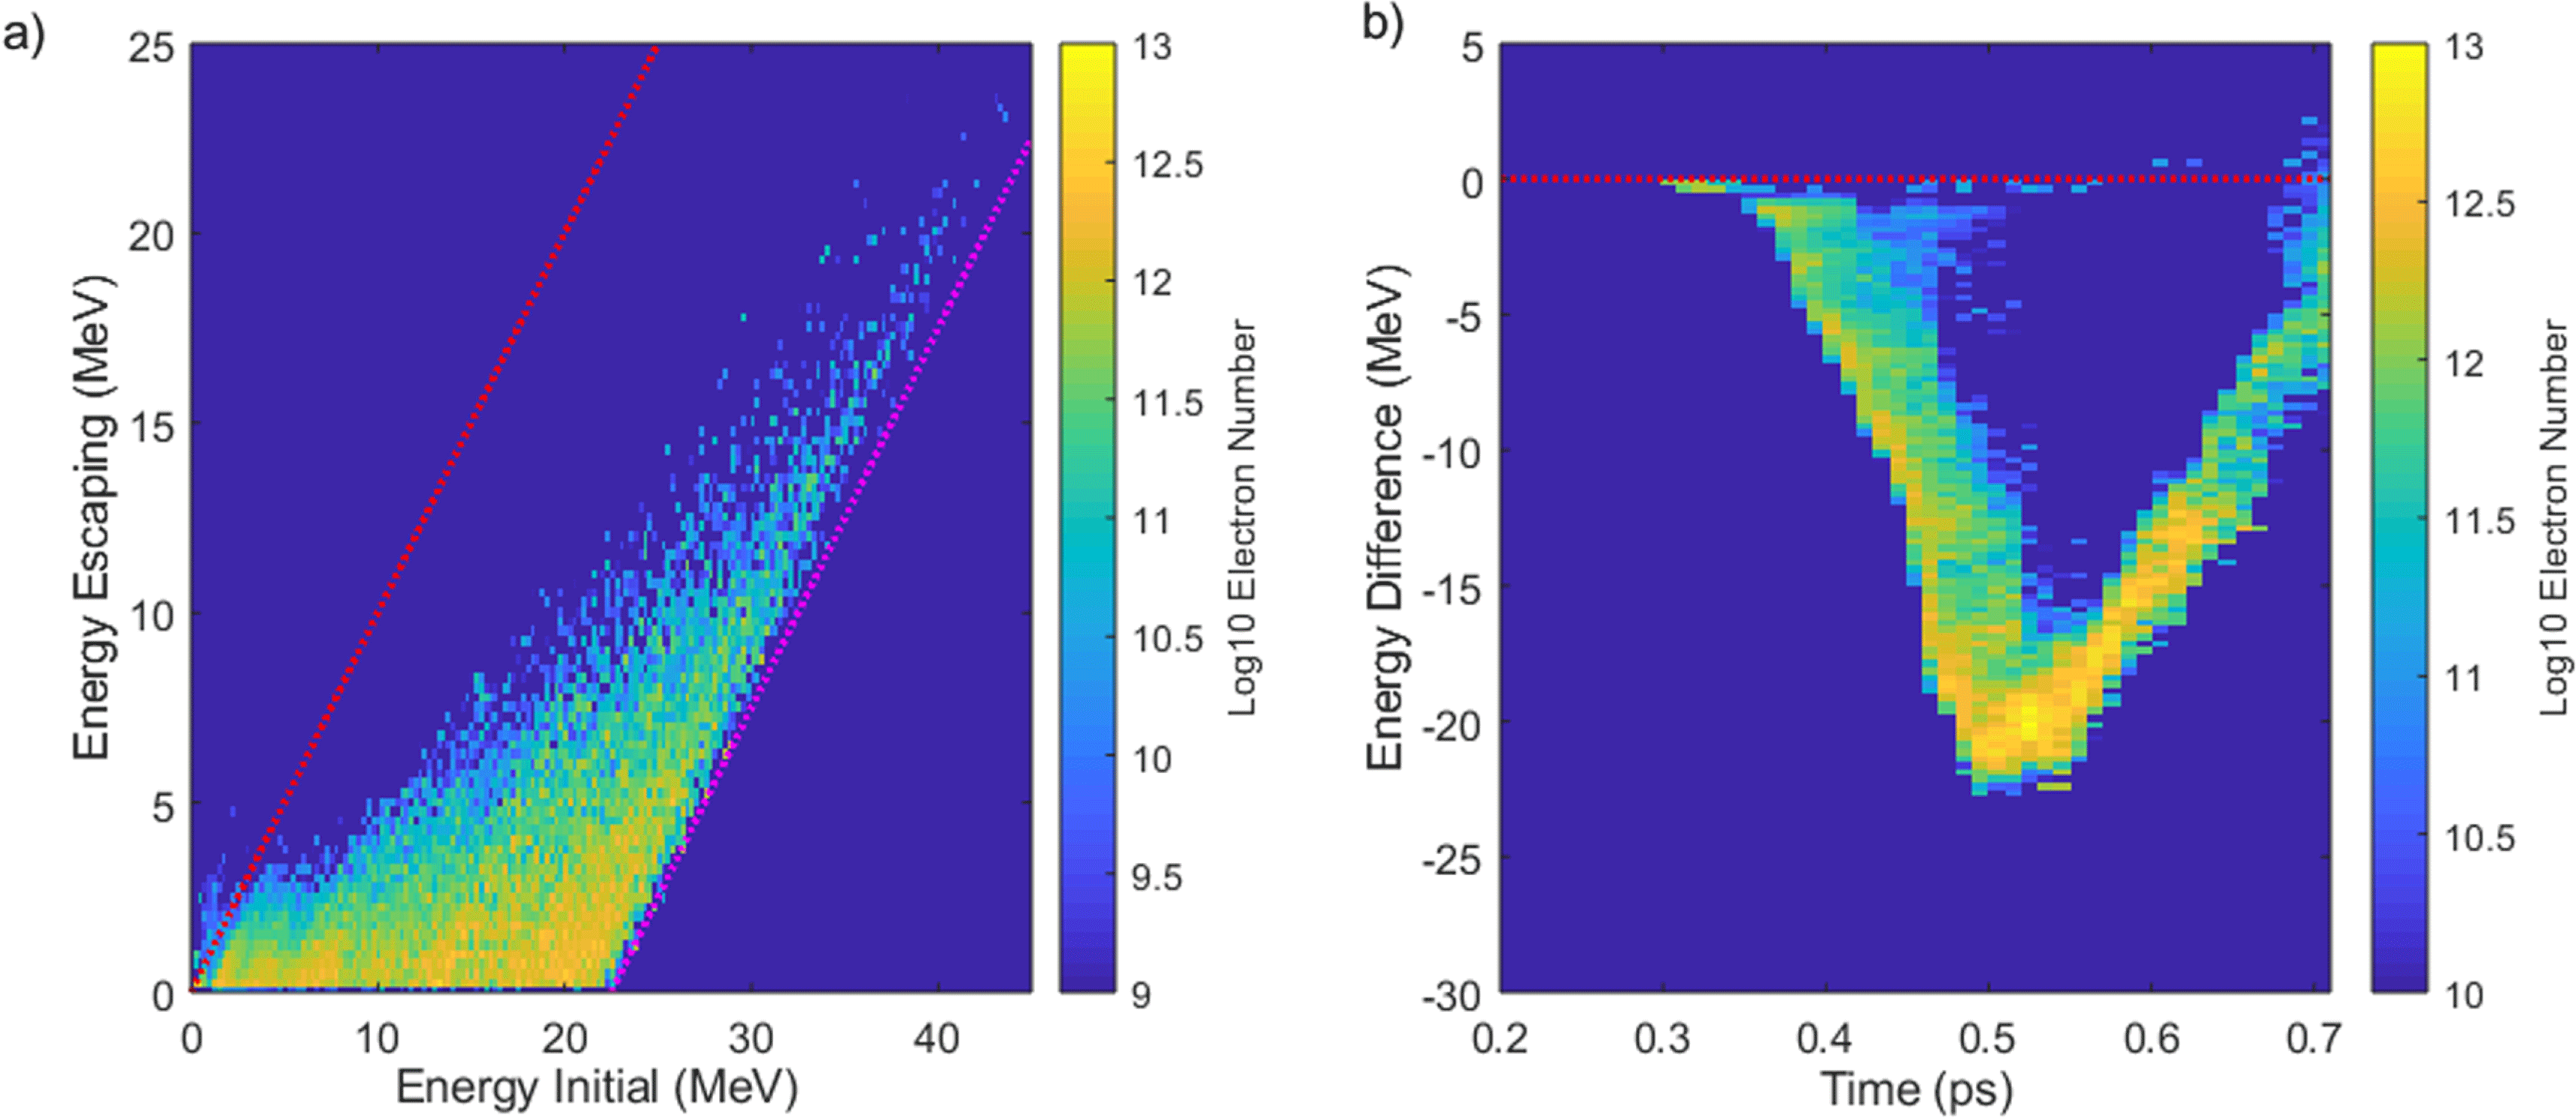
(a) The initial internal electron energy plotted against the ballistic escaping energy. All these electrons appear to lose energy upon leaving the target. (b) The energy difference between the escaping electrons as a function of the time at which they pass the external boundary.
The kinetic energy and electric field in the $x$
direction as functions of position for an escaping electron. The electron is able to overcome the field, and in doing so loses a significant portion of its energy.
$x$
direction as functions of position for an escaping electron. The electron is able to overcome the field, and in doing so loses a significant portion of its energy.

The change in energy of the escaping electrons as a function of the integrated electric field in the $x$
direction that each experiences between the rear surface and the external boundary at
$x$
direction that each experiences between the rear surface and the external boundary at $60~\unicode[STIX]{x03BC}\text{m}$
. The small population of electrons that appears below the main distribution is the earliest electrons that are part of the expanding plasma.
$60~\unicode[STIX]{x03BC}\text{m}$
. The small population of electrons that appears below the main distribution is the earliest electrons that are part of the expanding plasma.

Figure 11(a) shows the initial energy of the electrons as a function of their individual escaping energy for the $10^{20}~\text{W}/\text{cm}^{2}$
simulation. Similar to the refluxing analysis for Figure 5, the red dotted line represents energy equality, with energy loss occurring to the right and energy gain occurring to the left. This shows that these electrons predominantly lose energy leaving the target; very few retain the same energy. The point where the internal-escaping electrons and the internal electrons are the same can be described as a threshold energy where an electron is guaranteed to escape. For the
$10^{20}~\text{W}/\text{cm}^{2}$
simulation. Similar to the refluxing analysis for Figure 5, the red dotted line represents energy equality, with energy loss occurring to the right and energy gain occurring to the left. This shows that these electrons predominantly lose energy leaving the target; very few retain the same energy. The point where the internal-escaping electrons and the internal electrons are the same can be described as a threshold energy where an electron is guaranteed to escape. For the $10^{20}~\text{W}/\text{cm}^{2}$
simulation in Figure 8, we see that this threshold energy is approximately 22 MeV. The pink dotted line of Figure 11(a) begins at
$10^{20}~\text{W}/\text{cm}^{2}$
simulation in Figure 8, we see that this threshold energy is approximately 22 MeV. The pink dotted line of Figure 11(a) begins at ${\sim}22~\text{MeV}$
. The energy difference as a function of time at crossing the external boundary is shown in Figure 11(b); the maximum energy difference is again
${\sim}22~\text{MeV}$
. The energy difference as a function of time at crossing the external boundary is shown in Figure 11(b); the maximum energy difference is again ${\sim}22~\text{MeV}$
.
${\sim}22~\text{MeV}$
.
As we discussed in Section 4, the energy difference, in this case energy loss, is due to the electric field. The escaping electrons must overcome the additional electric field in order to escape. As with the refluxing electrons, the kinetic energy and field encountered for a single escaping electron have been plotted in Figure 12. The electron is able to overcome the field at the expense of its kinetic energy. The highest amount of energy loss occurs when the field is peaked. As the strength of the field reduces, so does the energy loss. We can track the entire population of ballistically escaping electrons and the summation of the longitudinal electric field that they experience between the rear of the target and the $60~\unicode[STIX]{x03BC}\text{m}$
boundary. We compare this to the change in energy that the electrons experience between the two diagnostic boundaries in Figure 13. As expected, there is a strong correlation between the field experienced and the energy loss of the electron. The small population of electrons that appears below the main bunch is the earliest plasma electrons that have expanded past the boundary.
$60~\unicode[STIX]{x03BC}\text{m}$
boundary. We compare this to the change in energy that the electrons experience between the two diagnostic boundaries in Figure 13. As expected, there is a strong correlation between the field experienced and the energy loss of the electron. The small population of electrons that appears below the main bunch is the earliest plasma electrons that have expanded past the boundary.
As with the refluxing electrons, we also see similar trends with the escaping electrons for the two other additional intensity simulations we have conducted. The threshold energy for all electrons to escape for the $1\times 10^{19}~\text{W}/\text{cm}^{2}$
simulation is
$1\times 10^{19}~\text{W}/\text{cm}^{2}$
simulation is ${\sim}8~\text{MeV}$
, lower than that for
${\sim}8~\text{MeV}$
, lower than that for $1\times 10^{20}~\text{W}/\text{cm}^{2}$
and lower than the
$1\times 10^{20}~\text{W}/\text{cm}^{2}$
and lower than the ${\sim}65~\text{MeV}$
for
${\sim}65~\text{MeV}$
for $1\times 10^{21}~\text{W}/\text{cm}^{2}$
. This threshold is growing as the peak field on the rear surface is also increasing as a function of intensity (Figure 2), making it more difficult for lower-energy electrons to overcome and propagate into the vacuum.
$1\times 10^{21}~\text{W}/\text{cm}^{2}$
. This threshold is growing as the peak field on the rear surface is also increasing as a function of intensity (Figure 2), making it more difficult for lower-energy electrons to overcome and propagate into the vacuum.
As stated before, the so-called ballistic electrons only make up a very small percentage of the population outside the target. The majority of the electrons that are outside the target at the end of the simulation are part of the plasma expansion, as can be seen in Figure 9. The ballistic electrons represent ${\sim}1\%$
of the initial internal hot-electron population.
${\sim}1\%$
of the initial internal hot-electron population.
Experimentally, the measured escaping electrons represent a much higher number; approaching 15% of the entire incident laser energy for certain conditions[Reference Rusby, Wilson, Gray, Dance, Butler, MacLellan, Scott, Bagnoud, Zielbauer, McKenna and Neely41]. The difference between the experimentally measured escaping electrons and the ballistic escaping electrons analysed is likely due to the vast number of plasma/sheath electrons. As stated by Link et al., the plasma electrons away from the target will contribute to a larger number of the measured escaping electrons with low energies, which have little effect on the target charging process that affects the refluxing and ballistic electrons. Our simulations do not run for a sufficient time to accurately determine the total number of escaping electrons from this plasma, but from Figure 9 we can at least state they are far more plentiful than the ballistic electrons.
6 Conclusions
We have simulated, using 2D PIC simulations and particle tracking, the dynamics of the hot electrons and the two created populations that form upon reaching the rear surface of a solid target, the refluxing and escaping electrons. The refluxing electrons, those that return into the target after experiencing the fields on the rear surface, have been shown on average to lose energy, resulting in a cooling of the spectra. This is confirmed across three different intensities from $10^{19}$
to
$10^{19}$
to $10^{21}~\text{W}/\text{cm}^{2}$
. However, individually a refluxing electron can gain or lose energy, depending on the evolving electric field that it experiences while refluxing. We have shown this by observing the energy an electron possesses upon passing a logical diagnostic in our target and recording the energy and the time at which these transits happen. We have also tracked the electric field that an individual electron experiences. We present the case where the electron gains or loses energy to show that the difference in the field is responsible. However, the majority of electrons do not gain or lose much energy at all, resulting in many returning almost in an elastic reflection back into the target.
$10^{21}~\text{W}/\text{cm}^{2}$
. However, individually a refluxing electron can gain or lose energy, depending on the evolving electric field that it experiences while refluxing. We have shown this by observing the energy an electron possesses upon passing a logical diagnostic in our target and recording the energy and the time at which these transits happen. We have also tracked the electric field that an individual electron experiences. We present the case where the electron gains or loses energy to show that the difference in the field is responsible. However, the majority of electrons do not gain or lose much energy at all, resulting in many returning almost in an elastic reflection back into the target.
The escaping electron population analysed here is a so-called ‘ballistic’ population of electrons, which leave the target at near the speed of light. These electrons must overcome the electrostatic potential that is set up on the rear and, in doing so, lose a significant percentage of their initial energy. As such, the escaping electrons are shown to be the highest-energy electrons at any given time reaching the rear of the target, as they have the capacity to overcome the field. This was again demonstrated using particle tracking across the initial internal boundary and second external boundary. A time limit is set on the external boundary that allows us to isolate the ‘ballistic’ electrons from the plasma electrons that are shown to propagate away from the target at a much slower speed but with much greater number.
The effects we observe here largely depend on the electric field that is present on the rear surface of the target. To fully understand the escaping electron dynamics at the rear target surface, further studies will be required, examining the effects of the surface morphology and contaminant layer composition, as well as laser parameters such as the pulse duration and focal spot size.
Acknowledgements
We gratefully acknowledge funding from EPSRC Grant Nos. EP/J003832/1, EP/K022415/1, EP/R006202/1 and the use of the Scarf simulation cluster. Data associated with research published in this paper can be accessed at: http://dx.doi.org/10.5286/edata/721.







 Open access

