


Introduction
Deficits in executive functioning are common in late-life depression (LLD) and associated with a range of negative clinical outcomes, including poor antidepressant response, suicidality, and conversion to dementia (Alexopoulos, Reference Alexopoulos2019). Aging, regional brain atrophy, genetics, medical comorbidities including inflammation, and vascular risk processes contribute to dysfunction in fronto-subcortical brain systems such as cognitive control and reward networks, and in turn influence the cognitive presentation and clinical outcomes (Alexopoulos, Reference Alexopoulos2019; He et al., Reference He2021). These executive deficits persist despite adequate treatment and resolution of the depressive symptoms, making the individual vulnerable to depression relapse and recurrence (Alexopoulos, Reference Alexopoulos2019) and hampering functional recovery (Bortolato et al., Reference Bortolato2019).
However, there is variability in the cognitive presentation of LLD. Not all individuals with LLD exhibit executive deficits, and difficulties in other cognitive domains (e.g. memory) may be present (Hickie et al., Reference Hickie2005; Thomas et al., Reference Thomas2009). These different cognitive presentations suggest different mechanisms, where cognitive performance may be less associated with vascular processes and more associated with Alzheimer’s disease pathology, such as lower temporal lobe/hippocampal volumes (Hickie et al., Reference Hickie2005; Takamiya et al., Reference Takamiya2021), amyloid or tau burden, and APOE e4 allele (Rhodes et al., Reference Rhodes2021). Furthermore, some individuals with LLD exhibit normal cognitive functions similar to their non-depressed same-aged peers (Morin et al., Reference Morin2019; Opdebeeck et al., Reference Opdebeeck, Quinn, Nelis and Clare2015), suggesting that, just as there is heterogeneity in clinical presentation (Alexopoulos, Reference Alexopoulos2019; Gunning et al., Reference Gunning, Oberlin, Schier and Victoria2021), there is heterogeneity in LLD’s cognitive presentation. Much research to date has focused on differences in cognitive performance between depressed individuals and psychiatrically healthy controls (Rock et al., Reference Rock, Roiser, Riedel and Blackwell2014) and not within depressed cohorts. This may contribute to inconsistent cognitive findings across studies.
Data-driven statistical approaches, such as cluster analysis, allow for the identification of homogenous subgroups within a larger heterogeneous data set and group individuals in a way that maximizes within subgroup and minimizes between subgroup similarities (Windgassen et al., Reference Windgassen, Moss-Morris, Goldsmith and Chalder2018). When examining cognition in particular, these subgroups have been termed “cognitive phenotypes.” Previous research using cluster analysis and other similar methods has examined cognition within depression across the lifespan (ages 18 to 70) (Martin et al., Reference Martin2020; Pu et al., Reference Pu, Noda, Setoyama and Nakagome2018), identifying three cognitive phenotypes: a) cognitively “intact” or with an isolated cognitive weakness, b) cognitively “reduced” with modest deficits in a subset of cognitive functions, and c) cognitively “impaired” with deficits across most/all cognitive domains. Martin et al. (Reference Martin2020) reported demographic differences between the cognitive phenotypes (e.g. age, education, predicted intelligence), but no statistically significant differences in clinical factors (e.g. age of depression onset or length of current episode, presence of melancholia or anxiety) with the exception of depression severity. They also investigated whether patterns of responses on the depression rating scale differed by cognitive phenotype, and they found no statistically significant differences across items. Specific to LLD, findings have been mixed. One group reported three cognitive phenotypes (memory impairment, executive/memory impairment, and attention/memory impairment) (Lockwood et al., Reference Lockwood, Alexopoulos, Kakuma and Van Gorp2000) and another reported two phenotypes (high normal vs. lower normal) (Morin et al., Reference Morin2019). In the Morin et al. (Reference Morin2019) study, the only factor that predicted group membership was that lower cognitive status was associated with the APOE e4 allele.
Limitations of the previous work include, in some instances, drawing conclusions from individual cognitive tests. This can be problematic, as patterns of cognitive performance within and across cognitive domains and not on a single test are more clinically meaningful (Harvey, Reference Harvey2012), and low scores on individual cognitive tests within a large cognitive battery in non-demented older adults are common (Mistridis et al., Reference Mistridis2015). Together, this supports the use of cognitive domain composite scores for the current study, which combines several individual test scores into a single cognitive domain score. This limits the number of comparisons (thereby reducing type I error), reduces the influence of floor or ceiling effects from any one test, and also allows for identification of meaningful cognitive patterns at the group level.
The purpose of the current study was to investigate cognitive heterogeneity within LLD using a data-driven approach (i.e. cluster analysis) to identify cognitive phenotypes. To better understand the identified cognitive phenotypes, and to compare our findings with the broader literature, we also examined whether the identified phenotypes differed in sociodemographic and clinical characteristics. We hypothesized we would observe at least two cognitive phenotypes, one with relatively preserved cognitive functions and the other with deficits predominantly in executive functioning. We were also interested in investigating whether the cognitive phenotypes were associated with functional status and subjective cognitive complaints, given that these outcomes are related to depressive symptomology (Verhaak et al., Reference Verhaak, Dekker, de Waal, van Marwijk and Comijs2014; Zlatar et al., Reference Zlatar, Muniz, Galasko and Salmon2018) and not examined in previous studies.
Methods
Participants
Participants were recruited from clinical referrals and community advertisements at Vanderbilt University Medical Center who enrolled in two separate studies with similar entry and exclusionary criteria. All participants were aged 60 years or older without a diagnosis of dementia or significant cognitive impairment, as assessed by review of their medical records and a score of 24 or greater on the Mini-Mental Status Examination (MMSE) (Folstein et al., Reference Folstein, Folstein and McHugh1975). Participants with LLD had a DSM-IV-TR diagnosis of Major Depressive Disorder (determined via the Mini-International Neuropsychiatric Interview; MINI) (Sheehan et al., Reference Sheehan1998) and a score of 15 or greater on the Montgomery Asberg Depression Rating Scale (MADRS) (Montgomery and Asberg, Reference Montgomery and Asberg1979). Exclusionary criteria included acute suicidality, other DSM-IV-TR Axis I diagnoses (with the exception of concurrent anxiety), acute grief, current or history of psychosis, history of substance abuse or dependence over the previous three years, neurological disorders (e.g. stroke, Parkinson’s disease), chronic untreated medical conditions (e.g. diabetes, hypothyroidism), current involvement in psychotherapy, electroconvulsive therapy in the previous six months, or MRI contraindications. For both studies, participants with LLD were tapered off ineffective antidepressants prior to the initiation of any study procedures and were off medications for at least two weeks prior to clinical assessments.
Healthy never depressed elders (NDE; n = 56) did not meet current or historical criteria for any DSM-IV-TR Axis I disorder, nor did they have history of any mental health treatment, along with the other exclusionary criteria outlined above. The Vanderbilt University Institutional Review Board approved both of the studies. All study participants provided both written and verbal informed consent. These studies were registered with ClinicalTrials.gov (NCT01896934 and NCT02332291). We have previously reported data from both studies (Abi Zeid Daou et al., Reference Abi Zeid Daou, Boyd, Donahue, Albert and Taylor2017, Reference Abi Zeid Daou, Boyd, Donahue, Albert and Taylor2018; Christman et al., Reference Christman2020; Gandelman et al., Reference Gandelman2019; Taylor et al., Reference Taylor2020).
Measures
Sociodemographic and clinical factors
Sociodemographic (age, sex, years of education, race) and clinical factors related to depression history (family history of depression or bipolar disorder) were obtained via an interview, the MINI, and a review of available medical records. Depression severity was assessed with the MADRS. We also determined age of initial depression onset and duration of current depressive episode using a life-charting approach and supplemented with medical record data (Christman et al., Reference Christman2020). Medical comorbidity was determined by the Cumulative Illness Rating Scale for Geriatrics (Miller et al., Reference Miller1992), and vascular risk was quantified using the Framingham Study stroke risk prediction tool (Wolf et al., Reference Wolf, D'Agostino, Belanger and Kannel1991).
Functional status
The WHO Disability Assessment Schedule 2.0 (WHODAS 2.0) (Ustun & World Health Organization, 2010) was used to measure functional status. This questionnaire is comprised of six domains where participants rate the level of difficulty they have in performing various activities on a five-point Likert scale (1 = no difficulty to 5 = extreme). The six domains include cognition, mobility, self-care, getting along (or socialization), life activities, and participation (in the community and society). The simple scoring method was used, such that scores for each item are added up without weighting of individual items, which allows for a global measure of functional status. Scores range from 36 to 180 when all items are answered, with higher scores indicating greater disability. The WHODAS 2.0 is valid and reliable measure to assess functional status in a variety of settings and populations (Federici et al., Reference Federici, Bracalenti, Meloni and Luciano2017). This scale was added over the course of the study, so it is only available in a subsample of participants.
Subjective cognitive measures
The PROMIS Applied Cognition – Abilities Scale (Saffer et al., Reference Saffer, Lanting, Koehle, Klonsky and Iverson2015) was used to characterize cognitive complaints broadly (i.e. across multiple cognitive domains) over the previous week, which has been validated for use in older adult populations. Participants rate their responses on 8 items using a scale ranging from 1 (Not at all) to 5 (Very much), with total scores ranging from 8 to 40. Higher scores indicate better perceived cognitive functioning. This measure was only available in a subsample of participants due to addition later in the course of the study.
Objective cognitive measures
All participants completed paper-and-pencil cognitive tests focused on cognitive domains affected by aging and LLD and used in our previous work (Christman et al., Reference Christman2020; Gandelman et al., Reference Gandelman2019). These included the Wechsler Adult Intelligence Scale-III (WAIS-III) Digit Span (forward and backward), Symbol-Digit Modality Test (SDMT), Golden Stroop, Trail Making Test (Parts A and B), Shipley Vocabulary subtest, Wechsler Memory Scale-Revised (WMS-R) Logical Memory (LM), Benton Visual Retention Test (BVRT), Initiation/Perseveration (I/P) subtests of the Dementia Rating Scale (DRS), and letter fluency (FAS trials), along with several measures from the Consortium to Establish a Registry for Alzheimer’s Disease (CERAD; 15-item Boston Naming Test (BNT), wordlist memory, and constructional praxis).
Statistical analysis
Statistical analyses were conducted using SPSS 27.0 software (IBM Corp., Armonk, NY, USA). Prior to the cluster analyses, the individual cognitive test scores were normed against the entire sample of LLD and NDE and standardized z-scores were obtained without correcting for demographics. Time to completion for both Trails A and B was reversed scored prior to standardization so that all measures were in the same direction (i.e. higher scores equate to better performance). Five empirically derived cognitive domain composites (Lezak et al., Reference Lezak2012) were developed from the individual tests by averaging the z-scores of the tests within each domain. These consisted of attention/working memory (WAIS-III Digit Span forward and backward), processing speed (SDMT total correct, Trails A time to completion, and Stroop Color Naming total correct), language (BNT-15 total correct, Vocabulary total correct, and Stroop Word Reading total correct), episodic recall (CERAD wordlist delayed recall total correct, CERAD constructional praxis delayed recall total correct, WMS-R LM-II total correct, and BVRT immediate recall total correct), and executive functions (DRS I/P total correct, FAS total correct, Stroop Color-Word total correct, and Trails B time to completion). Internal consistency (Cronbach’s α) of the calculated domain composites were attention/working memory = 0.702, processing speed = 0.740, language = 0.256, episodic recall = 0.759, and executive functions = 0.637. The obtained standardized cognitive domain variables were subsequently used in the analyses
Differences between LLD and NDE in sociodemographic, clinical, and cognitive variables were examined using independent sample t-tests for continuous variables and chi-square tests for categorical variables (see Supplemental Table 1). As the purpose of this study was to investigate cognitive phenotypes within LLD (and not necessarily between LLD and NDE), the NDE group in this study were only used for comparative purposes to describe the overall sample.
A series of cluster analyses were conducted to classify and cross-validate observed patterns based on the standardized cognitive domain variables. Hierarchical agglomerative clustering via Ward’s method with squared Euclidean distance was first used (Murtagh and Legendre, Reference Murtagh and Legendre2014; Ward, Reference Ward1963). The optimal number of clusters was determined by identifying clusters with large increases in the agglomeration distance coefficient, along with visual inspection of the dendrogram. Cluster solutions were cross-validated using K-means clustering, whereby individuals are iteratively assigned to the cluster they are most similar to based on cluster means and simple Euclidean distance metrics (Steinley, Reference Steinley2006). Four separate cluster solutions were explored, ranging from two to five clusters, via examination of the final cluster centroids and number of cases in each cluster. Consensus between the results of the hierarchical and k-means cluster analyses was determined with cross-tabulations and chi-square independence tests with cluster membership. All cases were retained in the initial analyses; however, one participant was determined to be an outlier (i.e. participant was identified as a separate, unique cluster across solutions and techniques) and was removed before re-assessing final cluster solutions.
After determining the optimal cluster solution, the derived clusters from the hierarchical analysis (i.e. “cognitive phenotypes”) were compared on sociodemographic and clinical factors, functional status, subjective cognitive measures, and cognitive composites to understand group differences between groups via Kruskal–Wallis (due to the non-normality of several variables) and chi-square tests. We then conducted a mixed analysis of covariance (ANCOVA) with the individual cognitive composites as the repeated factor and cognitive phenotype as the between-subject factor, with any significant sociodemographic or clinical factors identified in the previous analysis as covariates (after checking for the normality of the residuals). Effect sizes were calculated using partial eta squared (η p 2 ), with 0.01 suggesting small effects, 0.06 medium effects, and > 0.14 large effects (Cohen, Reference Cohen1969). To determine LLD cognitive phenotype membership given any significant sociodemographic or clinical factors in the initial analysis, a multinomial logistic regression was conducted, with the “High Normal” group considered as the reference category.
Lastly, exploratory analyses examined whether the pattern of responses on individual MADRS items differed between cognitive phenotypes using a multivariate ANCOVA (MANCOVA) and also further explored the “High Normal” cognitive phenotype using similar methods as above (i.e. Mann–Whitney U-tests for differences in sociodemographic and clinical characteristics, mixed ANCOVA for differences in cognitive performance; see Supplemental Methods).
Results
Overall sample
The LLD had significantly lower education, were predominantly Caucasian, had greater family history of depression, more medical comorbidities, and had higher scores on the MADRS, as well as greater perceived disability and overall subjective cognitive complaints when compared to the NDE group (Supplemental Table 1). The LLD group also performed significantly lower on the processing speed and executive function domains compared to NDE (Supplemental Table 1), but the scores overall were still within the normal range.
Cluster solutions
Results of Ward’s method for hierarchical clustering suggested a three- or four-cluster solution based on examination of the dendrogram and agglomeration coefficient changes, along with number of cases per cluster. To cross-validate, k-means cluster analysis similarly indicated that three or four clusters should be retained. Comparison of the two clustering techniques revealed a highly similar three-cluster solution, with greater agreement in the proportion of cases assigned to the same cluster in the three- (81–97%) versus four- (74–100%) cluster solution. A chi-square test of independence indicated that there was a significant relationship between likelihood of being assigned to the same cluster using each clustering method in the three-cluster solution, X 2 (4, N = 119) = 160.78, p < 0.001. Based on these findings, we selected three clusters as our optimal cluster solution, given they provided the most appropriate balance between sample size and clinical usefulness in terms of the cognitive patterns, and used the hierarchical clusters for all subsequent analyses. Using graphical exploration of the cognitive domain composites by cluster, different cognitive profiles were observed, reflecting “High Normal” (n = 47), “Reduced Normal” (n = 35), and “Low Executive Function” (n = 37) groups
Group differences in sociodemographic, clinical factors, and cognitive functions
The “High Normal” group was significantly younger, more educated, predominantly Caucasian, and had fewer vascular risk factors and a higher MMSE compared to the “Low Executive Function” group (p’s < 0.003; Table 1). The “High Normal” group also were significantly more educated than “Reduced Normal” group. No group differences were observed on other sociodemographic or clinical factors, including depression-related variables, functional status, or subjective cognition. In terms of cognitive functions, the “High Normal” group performed significantly better across all cognitive composites compared to both the “Reduced Normal” and “Low Executive Function” groups (p’s < 0.05). The “Reduced Normal” group performed better than the “Low Executive Function” group measures of attention/working memory, processing speed, and executive functions (p’s < 0.001).
Differences in sociodemographic, clinical factors, and cognitive domain functions across clusters

Notes: MADRS: Montgomery Asberg Depression Rating Scale; WHODAS: WHO Disability Assessment Schedule; PROMIS: PROMIS Applied Cognition – Abilities Scale; MMSE: Mini-Mental Status Examination. Due to missing data, the following variables have different sample sizes: Age at depression onset (n’s = 46, 36, 34), Length of current episode (n’s = 46, 33, 34), Family history of depression (n’s = 47, 36, 35), Family history of bipolar disorder (n’s = 46, 35, 35), WHODAS 2.0 (n’s = 39, 30, 21), PROMIS (n’s = 31, 24, 15), and MMSE (n’s = 46, 37, 35).
In the subsequent mixed ANCOVA analyses controlling for covariates that were significantly different between groups (i.e. age, education, race, Framingham score, and MMSE) and overall level of depression via the MADRS, group membership significantly predicted performance across the cognitive domains (p’s < 0.001, η p 2 ’s > 0.18), with a similar pattern of findings as reported above with the exception of processing speed that no longer differed between the “High Normal” and “Reduced Normal” groups (Table 2 and Figure 1a).
Subgroups in late-life depression based on cluster analysis of neurocognitive performance. (a) Three cognitive phenotypes identified in the full depression sample. (b) Exploratory analysis of “High Normal” phenotype showing significant differences in attention/working memory performance. Both sets of results are presented after covariate adjustment.

ANCOVA results of cluster group predicting cognitive domain performance
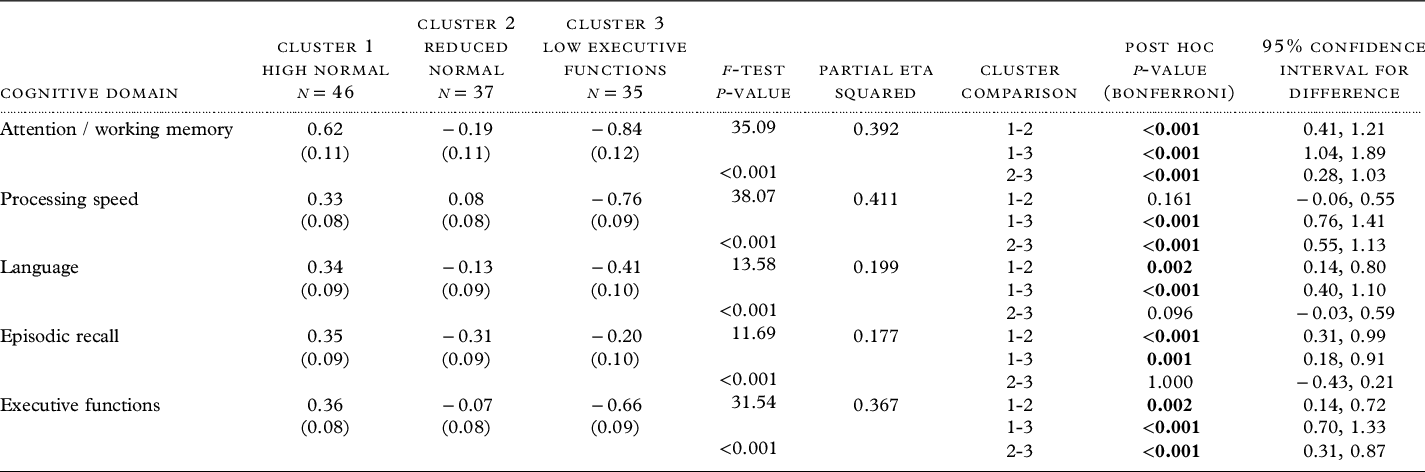
Note: z-score cognitive composites, with mean of 0 and SD of 1. Estimated mean and standard error reported, controlling for age, years of education, race, Framingham score, Mini-Mental Status Examination, and total Montgomery Asberg Depression Rating Scale. Df for all models = 2, 109. Bold represents post hoc significance at p < 0.05.
Prediction of group membership
While the model included age, education, race, Framingham score, MMSE, and MADRS, only age, education, and MMSE significantly influenced group membership (Model X 2 (12) = 69.51, p < 0.001). Using the “High Normal” cluster as the reference group, participants older in age and with less education were more likely to be in the “Reduced Normal” group and those older in age, with less education, and lower MMSE scores were more likely to be in the “Low Executive Function” group (Table 3).
Predicting cognitive phenotype membership: Multinomial logistic regression

Note. Model X 2 (12) = 69.51, p < 0.001. Model included age, education, race, Framingham score, MMSE, and MADRS. Cluster 1 (High Normal) was used as the reference group. OR: odds ratio; CI: confidence interval; MMSE: Mini-Mental Status Examination; MADRS: Montgomery Asberg Depression Rating Scale.
Exploration of cognitive phenotypes and depressive symptom patterns
When examining response patterns on the MADRS, the main effect of cognitive phenotype was not statistically significant (F(20, 216) = 0.77, p = 0.752, η p 2 = 0.07). This remained unchanged when repeated with age, education, race, Framingham score, MMSE, and total MADRS as covariates (F(18, 204) = 1.18, p = 0.279, η p 2 = 0.09; Supplemental Figure 1a).
Exploration of the “High Normal” phenotype
We further explored the “High Normal” cognitive phenotype, as the four-cluster solution suggested this group may differ in attention/working memory abilities (but the sample sizes overall were too small to be used in primary analyses). The two subgroups (“High Attention/Normal” [n = 26] and “Low Attention/Normal” [n = 21]) significantly differed in performance on attention / working memory (p < 0.001), but not across the other cognitive composites. The length of the current depressive episode was significantly less for the “Low Attention/Normal” group compared to the “High Attention/Normal” group (p = 0.032), but the groups did not significantly differ on any other sociodemographic or clinical factors, functional status, or subjective cognition (Supplemental Table 2). In subsequent analyses controlling for length of current depressive episode and total MADRS, cognitive phenotype significantly predicted performance in the attention/working memory domain (F(1, 42) = 109.25, p < 0.001, η p 2 = 0.72), but not for other cognitive domains (p’s > 0.222; Figure 1b). These two cognitive phenotypes did not significantly differ in their response pattern on the MADRS (F(10, 36) = 1.57, p = 0.154, η p 2 = 0.30). This remained unchanged when repeated with length of depressive episode and total MADRS as covariates (F(9, 34) = 1.87, p = 0.091, η p 2 = 0.33; Supplemental Figure 1b).
Discussion
This study investigated cognitive phenotypes in a clinical cohort of elders with LLD. Using cluster analyses, we identified three cognitive phenotypes in LLD (with large to very large effects). These slightly differed in sociodemographic and clinical factors, but not in the quality of specific symptoms reported, functional status, or subjective cognitive complaints. After covariate adjustment, the “High Normal” phenotype had cognitive performance > 0.30 standard deviations (SDs) above the mean across the five cognitive domains assessed (i.e. attention/working memory, processing speed, language, episodic recall, and executive functions), with a relative strength in attention/working memory. The “Reduced Normal” phenotype generally had cognitive performances at or just below the mean, with a relative weakness in episodic recall. The “Low Executive Function” phenotype demonstrated lowest scores across attention/working memory, processing speed, and executive function domains (>0.65 SDs below the mean). These data demonstrate partial support for our hypothesis, as we found a group defined by preserved cognitive functions and another with weakness predominantly in executive functions. We also identified a third intermediary group with lower cognitive scores overall, but that were still considered within the “normal” range.
Past meta-analyses suggest that adults with depression perform 0.5 to 1.0 SDs below healthy comparison subjects on cognitive tasks (Rock et al., Reference Rock, Roiser, Riedel and Blackwell2014), particularly on measures of attention and executive functions, with depression-related executive dysfunction greatest in older ages (Dotson et al., Reference Dotson2020). By using z-score cognitive domain composites, instead of single tests or dichotomous “intact vs. impaired” classification, our study demonstrated that cognitive functions in LLD lie on a continuum, with some individuals exhibiting preserved cognitive functions and others having lower performance in selective cognitive domains. Using similar clustering methods in an age diverse depression sample (ranging from 18 to 70 years), Martin et al. (Reference Martin2020) found a “cognitively impaired” subgroup that performed > 1.0 SD below the mean on all cognitive outcome measures, with verbal learning and memory largely affected. In contrast, both the “Reduced Normal” and “Low Executive Function” phenotypes in the current study did not meet this liberal cutoff for clinically significant cognitive impairment (Jak et al., Reference Jak2009). While our study demonstrates a range of cognitive presentations in LLD, we did not find a globally impaired group, which may be an artifact of sample or methodological differences across studies (i.e. use of cognitive composites versus individual cognitive tests).
The observed “Low Executive Function” phenotype is consistent with the ‘depression-executive dysfunction syndrome’ characterized by Alexopoulos and colleagues (Alexopoulos, Reference Alexopoulos2019; Lockwood et al., Reference Lockwood, Alexopoulos, Kakuma and Van Gorp2000; Morimoto et al., Reference Morimoto2020). This phenotype has significantly higher vascular burden compared to the “High Normal” phenotype based on their Framingham score, and it is hypothesized that this subgroup may also have greater white matter changes evident on neuroimaging that may contribute to this cognitive presentation (Alexopoulos, Reference Alexopoulos2019; Oberlin et al., Reference Oberlin2022; Taylor et al., Reference Taylor, Aizenstein and Alexopoulos2013). Interestingly, we found two phenotypes with relative preservation of cognitive functions. While cognitive functions were entirely within normal limits, the “Low Normal” group had a relative weakness in episodic recall, which is similar to what was seen in the “lower cognitive class” of the Morin et al. (Reference Morin2019) study. Their study found APOE e4 allele status predicted membership in this group and suggested they may be at greater risk for cognitive decline despite currently normal cognitive performance. We do not have similar genetic data available, but this is an interesting avenue for future exploration and consideration for this phenotype’s potential vulnerability to develop Alzheimer’s disease (Diniz et al., Reference Diniz, Butters, Albert, Dew and Reynolds2013). We also observed the presence of a group of individuals with entirely preserved cognitive functions, where protective and resiliency factors related to cognition may be studied (Laird et al., Reference Laird2019a, Reference Laird, Lavretsky, Wu, Krause and Siddarth2019b). This preserved group has also been shown in age diverse (Martin et al., Reference Martin2020) and geriatric depression samples (Morin et al., Reference Morin2019), as well as in bipolar disorder (Lima et al., Reference Lima2019; Montejo et al., Reference Montejo2022).
Although the cognitive phenotypes differed in cognitive performance, they did not differ on many sociodemographic or clinical measures. Factors unique to depression, such as age at depression onset (Mackin et al., Reference Mackin2014), did not differentiate cognitive phenotype. Concordant with past studies (Lockwood et al., Reference Lockwood, Alexopoulos, Kakuma and Van Gorp2000; Morin et al., Reference Morin2019), we also did not observe that overall depression severity distinguished between phenotypes. This supports that cognitive dysfunction may occur independent from current depression severity in older adults and is in accord with literature showing that depression severity is not strongly associated with cognitive functioning (Keilp et al., Reference Keilp, Madden, Gorlyn, Burke, Oquendo and Mann2018; McClintock et al., Reference McClintock, Husain, Greer and Cullum2010; Szymkowicz et al., Reference Szymkowicz, Dotson and Vanderploeg2020). Similar to the Martin et al. (Reference Martin2020) study, we additionally did not find that clinician ratings of depression symptom severity on individual MADRS items differentiated between the cognitive phenotypes. Unfortunately, data on other measures relevant for recurrent depression were not assessed, such as measures of chronicity, accumulated severity, or inpatient history, which may have interesting implications and should be investigated in future studies.
Previous evidence suggests relationships between level of cognitive dysfunction and disability in depression (LaMonica et al., Reference LaMonica2019; Riddle et al., Reference Riddle, McQuoid, Potter, Steffens and Taylor2015). However, our study and others (Pu et al., Reference Pu, Noda, Setoyama and Nakagome2018) did not find support for self-report of functional status significantly differentiating between cognitive phenotypes. Regardless of phenotype, participants in the current study reported mild disability that was on average significantly higher than the NDE group who reported minimal average disability. This may be due to our sample not having a subgroup that crossed a threshold for true cognitive impairment and would be expected to have higher ratings of disability.
Finally, there is a mixed evidence on the importance of subjective cognitive complaints in older adults. Some studies suggest relevance of cognitive complaints to preclinical Alzheimer’s disease (Lin et al., Reference Lin, Shan, Jiang, Sheng and Ma2019; Rabin et al., Reference Rabin, Smart and Amariglio2017), and others sugges the symptoms are more related to depressive symptoms and not cognitive decline (Sabatini et al., Reference Sabatini, Woods, Ukoumunne, Ballard, Collins and Clare2021; Zlatar et al., Reference Zlatar, Muniz, Galasko and Salmon2018). In the current study, compared to NDE, participants with LLD reported greater subjective cognitive complaints; however, the severity of complaints did not differentiate the cognitive phenotypes. Regardless of how well (or poorly) participants performed on objective cognitive measures, they rated their perceived cognitive difficulties comparably, which may reflect depression-related factors such as pessimism, rumination, and low self-efficacy (Schlosser et al., Reference Schlosser, Demnitz-King, Whitfield, Wirth and Marchant2020; Smit et al., Reference Smit, Koerts, Bangma, Fuermaier, Tucha and Tucha2021). This suggests that relying on reports of subjective cognitive complaints is not the ideal methodology for identifying subtle neurocognitive dysfunctions in otherwise functional individuals.
The current study had several strengths, including the use of a well-defined cohort of depressed elders who were off antidepressant medications at the time of testing and who underwent detailed clinical evaluations. Additionally, all participants underwent a clinically relevant neuropsychological battery that we were able to use to derive empirically supported cognitive domain composites and we had access to psychiatrically healthy NDE in order to locally norm the cognitive data.
Despite these strengths, there are limitations. First, our sample was predominantly Caucasian, so it is unclear how these cognitive phenotypes may present in more diverse geriatric depression samples, where factors such as degree of acculturation or impact of systemic racism may play a larger role in cognitive, behavioral, and health outcomes (Martinez-Miller et al., Reference Martinez-Miller2020; Miller et al., Reference Miller, Yang, Farrell and Lin2011; Ray et al., Reference Ray2022). Our sample was well-educated overall (> high school, on average), and we cannot generalize these findings to those LLD with lower educational levels. Measures of performance validity or estimated premorbid cognitive functioning were not available, and thus, we are limited in our ability to discuss effects or implications of these. Some items (e.g. mood questionnaires, subjective cognition) were not administered to the entire sample, which may have affected findings. It may be worth investigating relationships between cognitive phenotypes and specific mood symptoms or profiles in the future using a larger data set. The cross-sectional design precludes our ability to infer causality or determine whether these cognitive phenotypes change with time or treatment. The current study is based on a clinical sample of LLD, which may not represent community-based older adults with non-clinical or subthreshold depressive symptoms. Importantly, these cognitive phenotypes have not been validated in an independent sample, which is an important area for future investigation.
In conclusion, results of the current study identified three LLD subgroups based on neurocognitive performance. Identification of cognitive phenotypes in LLD may help with tailoring treatments or interventions based upon specific presentation (e.g. use of neurobiologically informed cognitive remediation for dysexecutive cognitive profiles (Morimoto et al., Reference Morimoto2020), psychoeducation, and cognitive-behavioral therapy for preserved cognitive profiles (Dafsari et al., Reference Dafsari2019)). Use of cognitive phenotypes may also allow for better selection of participants for pharmacological and non-pharmacological clinical trials, as well as allow for a more targeted assessment of clinical predictors and underlying mechanisms of each cognitive phenotype.
Conflict of interest
None.
Author contributions
SMS was involved with conception and design of this substudy, data analysis and interpretation, and manuscript preparation. CR was involved with manuscript preparation. DME and HK also assisted with data analysis and interpretation. WDT was involved with conception and design of the parent studies, as well as this substudy, data interpretation, and manuscript preparation. All authors approved the final version of this manuscript.
Acknowledgements
This work was supported by NIH grants R01MH102246, R01MH121620, and R21MH099218. It also utilized resources supported by the National Center for Advancing Translational Science, grants UL1TR000445 and UL1TR002243. Dr Taylor would additionally like to acknowledge salary support from the Tennessee Valley Healthcare System Geriatric Research Education and Clinical Center (GRECC).
Supplementary material
To view supplementary material for this article, please visit https://doi.org/10.1017/S1041610222000515


 Open access