

A growing body of obesity research focuses on the food environment and how increased access to nutritious foods might enable people to make better food choices. Much of the existing research on children's food environments has centred on the school food environment, with a focus on the foods that children consume during school hours(Reference Finkelstein, Hill and Whitaker1, Reference Story, Nanney and Schwartz2). However, the school food environment extends beyond the school walls, and into the immediate neighbourhoods that surround schools, especially for those children who walk or bike to and from school.
Fast-food outlets(Reference Austin, Melly and Sanchez3, Reference Simon, Kwan and Angelescu4) and convenience stores(Reference Zenk and Powell5) are concentrated around schools. Their presence near schools increases student access to high-fat foods. Students are particularly exposed to the food environment around their school during travel to and from school, as well as during the lunch hour when schools have an ‘open campus’ policy permitting students to leave campus for lunch(Reference Wechsler, Brener and Kuester6). Given the evidence that lower-income and minority children have higher rates of walking to school than do their counterparts(Reference McDonald7), the food environment around schools may be particularly relevant for them. Research with US schoolchildren in Philadelphia showed that as many as 48 % of these inner-city children routinely bought snacks at corner stores after school(Reference Karpyn, Sherman and Foster8).
The present study examines the range of food outlets around lower-income schools compared with higher-income schools and compares the availability of nutritious food items in food stores encountered near these schools. In addition, the present study aimed to determine whether stores accepting vouchers for the Special Supplemental Nutrition Program for Women, Infants, and Children (a federal programme in the USA for improving health and nutrition of low-income mothers, known as WIC)(9) differ in their availability of nutritious items when compared with stores that do not accept WIC vouchers.
Methods
Setting
Oakland is a mid-sized city having a population of 425 068 in the Bay Area of Northern California(10). The median annual household income is $47 179 ($50 007 is the US average), with 16 % of families living below the federal poverty line (9·8 % is the US average)(11). Oakland has a neighbourhood-based school districting system that lends itself to a higher number of children living within a walking distance from school. The typical age range for an elementary-school child in the USA is between 5 and 12 years of age.
Sampling
During the spring of 2008, stores were selected for an audit of ‘healthy’ food items on the basis of their proximity to public elementary schools in Oakland. All fifty-two elementary schools in the district were ranked on the percentage of students eligible for a free or reduced-price lunch (FRPL) as part of the National School Lunch Program. Schools with higher percentages of students eligible for FRPL were considered ‘lower-income schools’ and those with lower percentages of FRPL-eligible children were classified as ‘higher-income schools’. We used the highest quartile for lower income and the lowest tertile for higher income. We used the lowest tertile for the higher-income category because the lowest quartile did not provide enough schools with stores inside the designated buffer for a meaningful comparison. (Higher-income schools were more often located in residential neighbourhoods with fewer stores.)
Polygonal network buffer zones were created around the lower- and higher-income schools representing a one-quarter-mile (400 m) walk from each school entrance. Within each school's buffer zone, we documented all food outlets (locations where food or snacks could be purchased or consumed) in order to capture the range of locales from where a child (with or without an accompanying adult) might purchase a food item after school, particularly on their route between home and school.
Store checklist tool
A subset of the overall number of food outlets documented were food stores, and as such were eligible for an audit of food items using the Healthy Food Items Checklist developed by the Robert Wood Johnson Working Group on Corner Stores to assess healthy food availability in urban food stores(Reference Laska, Borradaile and Tester12). This tool was intended for use in stores where food can be purchased but not in restaurants/eateries; for our analysis we included small food stores (corner stores, convenience stores and liquor stores), larger stores (supermarkets) and other locations such as gas stations and drug stores. These stores were categorised as being (i) single aisle (one aisle); (ii) small (two to five aisles); or (iii) large (six aisles or more).
There are a total of twenty-eight nutritious food items and beverages on the checklist that fall into five main domains: (i) fresh fruit and vegetables; (ii) processed fruit and vegetables; (iii) healthy beverages and low-fat dairy; (iv) healthy snacks; and (v) other healthy staple foods (see Table 1). We also indicated when a store accepted food vouchers for WIC, which is a federal assistance programme for low-income pregnant women, breast-feeding women and infants and children below the age of 5 years.
Healthy Food Items Checklist used for comparison of food stores surrounding lower- and higher-income schools
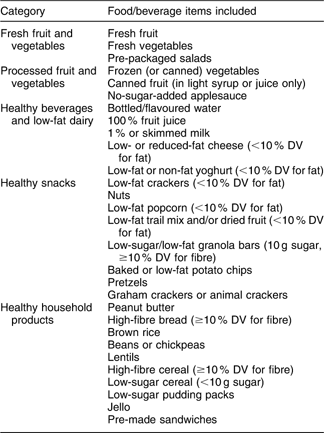
DV, daily value.
Analysis
The number of items present in each of the five domains was summed, and this sum was used as the domain score for each of the stores. We conducted two-sided t tests of the mean domain scores in these stores, stratifying by income status of schools and by stores' acceptance of WIC vouchers.
Results
School demographics
The thirty selected schools ranged from 0 % to 88 % eligibility for FRPL. There were a total of thirteen lower-income schools (FRPL eligibility: 74–88 %, mean: 79 %) and seventeen higher-income schools (FRPL eligibility: 0–55 %, mean: 30 %; see Table 2).
Characteristics of lower- and higher-income schools and their surrounding food outlets
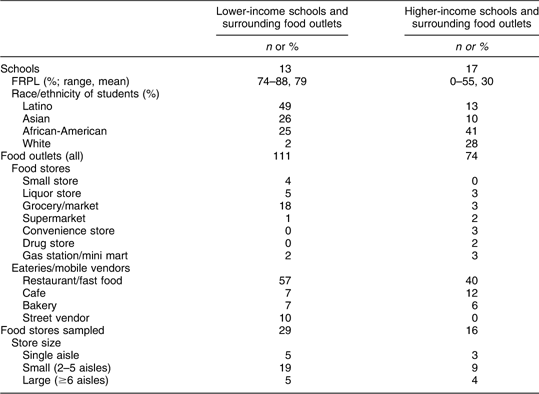
FRPL, free or reduced-price lunch.
Store characteristics
Within a quarter-mile distance from the thirteen lower-income schools, we encountered a total of 111 food outlets (mean of 8·5 per school, range from 1 to 36). These included eateries as well as a number of mobile food vendors selling items such as ice cream, candy, chips, shaved ice and roasted corn from mobile carts. There were thirty food stores, although one store owner declined to have the audit performed in his store. The twenty-nine stores sampled were all classified by type and size of store. Most stores were mid-sized (two to five aisles) and were mainly small grocery stores and convenience stores, with a few gas stations and liquor stores. Roughly half of these twenty-nine stores had signage indicating that WIC was accepted.
Within a quarter-mile distance from the seventeen higher-income schools, we encountered a total of seventy-four food outlets (mean of 3·4 per school, range from 0 to 34). There were sixteen food stores, which were mostly mid-sized stores. Three stores had signage indicating that they accepted WIC (Table 2).
Healthy Food Items Checklist scores
A comparison of the mean scores on each of the five domains of the Healthy Food Items Checklist is provided in Table 3. Scores are shown stratified by income level of school and by WIC signage status.
Comparisons of scores on each of the five domains between food stores, stratified by income status of nearby school and store acceptance of WIC vouchers
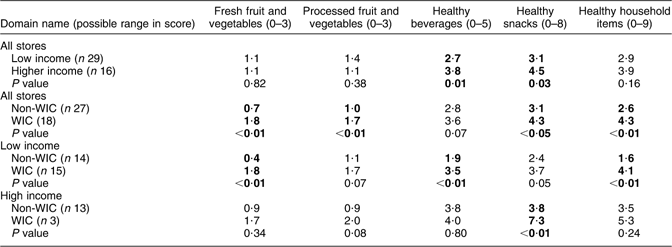
WIC, Special Supplemental Nutrition Program for Women, Infants, and Children.
Bold typeface denotes P values ≤0·05, indicating that the difference between means is statistically significant.
Stores near higher-income schools had significantly higher scores in the healthy beverages/low-fat dairy and healthy snacks domains. For example, low-fat or skimmed milk was found in 45 % of the higher-income stores but was not found in any of the lower-income stores. Low-fat crackers and low-fat granola bars, each an example of items on the healthy snacks domain, were found in 69 % and 44 %, respectively, of the higher-income stores but in only 31 % and 21 % of the lower-income stores. However, despite the significant difference in domain scores, it is worthwhile to point out that one item on the snacks domain was common in both lower- and higher-income stores. Snack-sized nuts were a healthy snack alternative found in both types of store (90 % and 81 % of lower- and higher-income stores, respectively).
Overall, two-fifths of the stores had signage indicating that they accepted WIC coupons. Although only a few stores surrounding higher-income schools accepted WIC, roughly half of the stores surrounding lower-income schools did so. Stores accepting WIC scored higher than non-WIC stores on all domains, except for the healthy beverages/dairy domain.
Stratification of the lower-income stores by WIC status shows a significant difference in scores on the Healthy Food Items Checklist. Across every domain, the score was higher for WIC stores compared with non-WIC stores that surrounded lower-income schools, and this difference was statistically significant in three of the five domains (Table 3).
Discussion
The present study of healthy food availability near higher- and lower-income schools in an urban setting highlighted the existing disparities that follow socio-economic status as well as the contribution that stores participating in a federal benefits programme such as WIC can make to the community food environment.
Students attending lower-income schools were exposed to a higher overall number of food outlets. Food stores around these lower-income schools were stocked with fewer low-fat dairy products, low-sugar beverages and healthy snacks. This suggests that, compared with their counterparts in more affluent areas, children from lower-income schools have access to more opportunities to purchase food, but fewer healthy food options, on their way to and from school.
Few of the stores near higher-income schools accepted WIC. However, WIC acceptance was associated with higher scores on the domains examined, suggesting that, although neighbourhood income does seem to matter when it comes to healthy food availability, stores that accept WIC offer more healthy snacking options, and may be particularly valuable for children in lower-income areas (even though the WIC programme itself by definition targets children before school age). These data were collected before the 2009 changes in the current WIC benefits package that include new allowances such as a provision for fresh fruit and vegetables, an emphasis on whole grains and stronger guidance and limitations on juice and whole milk. These findings compel us to determine whether this relative benefit improves even more after changes in reauthorisation. Food stores that have the capacity to offer WIC benefits may be logical targets for community-based (or even school-based) interventions that could benefit the larger community.
There are important limitations to our findings. As a study in a single city, we cannot generalise these findings to other cities or regions in the USA; however, these findings may be generaliseable to other mid-sized cities that have a neighbourhood-based school-zoning approach that promotes walking to and from school. Another limitation is the difficulty in disentangling socio-economic factors from built environment characteristics. Although some of the higher-income schools were located in dense, walkable neighbourhoods, most were located in less-dense areas with less commercial zoning, and thus with fewer food outlets (including fewer food stores) nearby. In order to have a sufficient number of food stores in higher-income areas, we broadened our criteria to include a larger slice of schools in the higher-income group. However, this would more likely have diluted any differences between lower- and higher-income stores than have incurred a larger effect size.
Access to nutritious food options has been shown in previous research to be more limited for lower-income populations(Reference Baker, Schootman and Barnridge13, Reference Horowitz, Colson and Hebert14), and this trend is confirmed in our single-city study. This disparity in access has implications for the purchasing options that children have within the food environments near schools. It appears that some food stores surrounding lower-income schools can be better than others for schoolchildren, and policies such as WIC that encourage stores to stock a larger variety of nutritious food items are needed. Research considering the impact of federal policies, such as the change in the WIC package on healthy food availability, will be an important barometer to determine the impact of such policies on food access.
Acknowledgements
Funding for this research was provided by Healthy Eating Research (Grant ID 63049), a national programme of the Robert Wood Johnson Foundation. The authors have no conflict of interest to declare. The Healthy Food Items Checklist was developed by the Corner Stores Working Group, with support from the Robert Wood Johnson Foundation Healthy Eating Research Program. J.M.T. was responsible for conceptualisation of the study and writing the manuscript. L.C.P. contributed to data collection and to an initial version of the manuscript, and all authors contributed to interpretation of findings and revision of the manuscript.


