


Tima (ISO 639-3: tms) is a Niger-Congo language spoken by roughly 7,000 people in the Nuba mountains of Sudan, in north-eastern Africa, as well as in smaller communities in the bigger towns of Sudan such as Khartoum and Port Sudan. It is part of the Katla language group which includes the languages Katla and Julut as well as Tima, with Tima being the most distinct of the three. All three languages are regarded as endangered, mainly due to the spreading influence of Arabic in recent decades, but also due to greater speaker mobility. Broadly speaking, there is a decline in speaker fluency from older to younger speakers of Tima. The Tima people are not only exposed to Arabic as the lingua franca and official language of Sudan, but also to English and Kiswahili. These latter languages were introduced into the school system during the extremely difficult circumstances of the second civil war (1983–2005), when teachers from Kenya came to the Tima region (in addition, many Tima people went to Kenya for further education).Footnote 1
Tima has a relatively small number of lexical roots, a fact which is compensated for by making use of metaphors, metonymy and synecdoche (see Schneider-Blum Reference Schneider-Blum2012; Schneider-Blum & Dimmendaal, to appear) as well as by altering the roots’ basic meanings through derivation. However, a good number of words from Arabic (or via Arabic) have entered the lexicon, with the new words mostly being morphophonologically adapted to the Tima system (see Hashim et al. Reference Hashim, Alamin and Schneider-Blum2020).
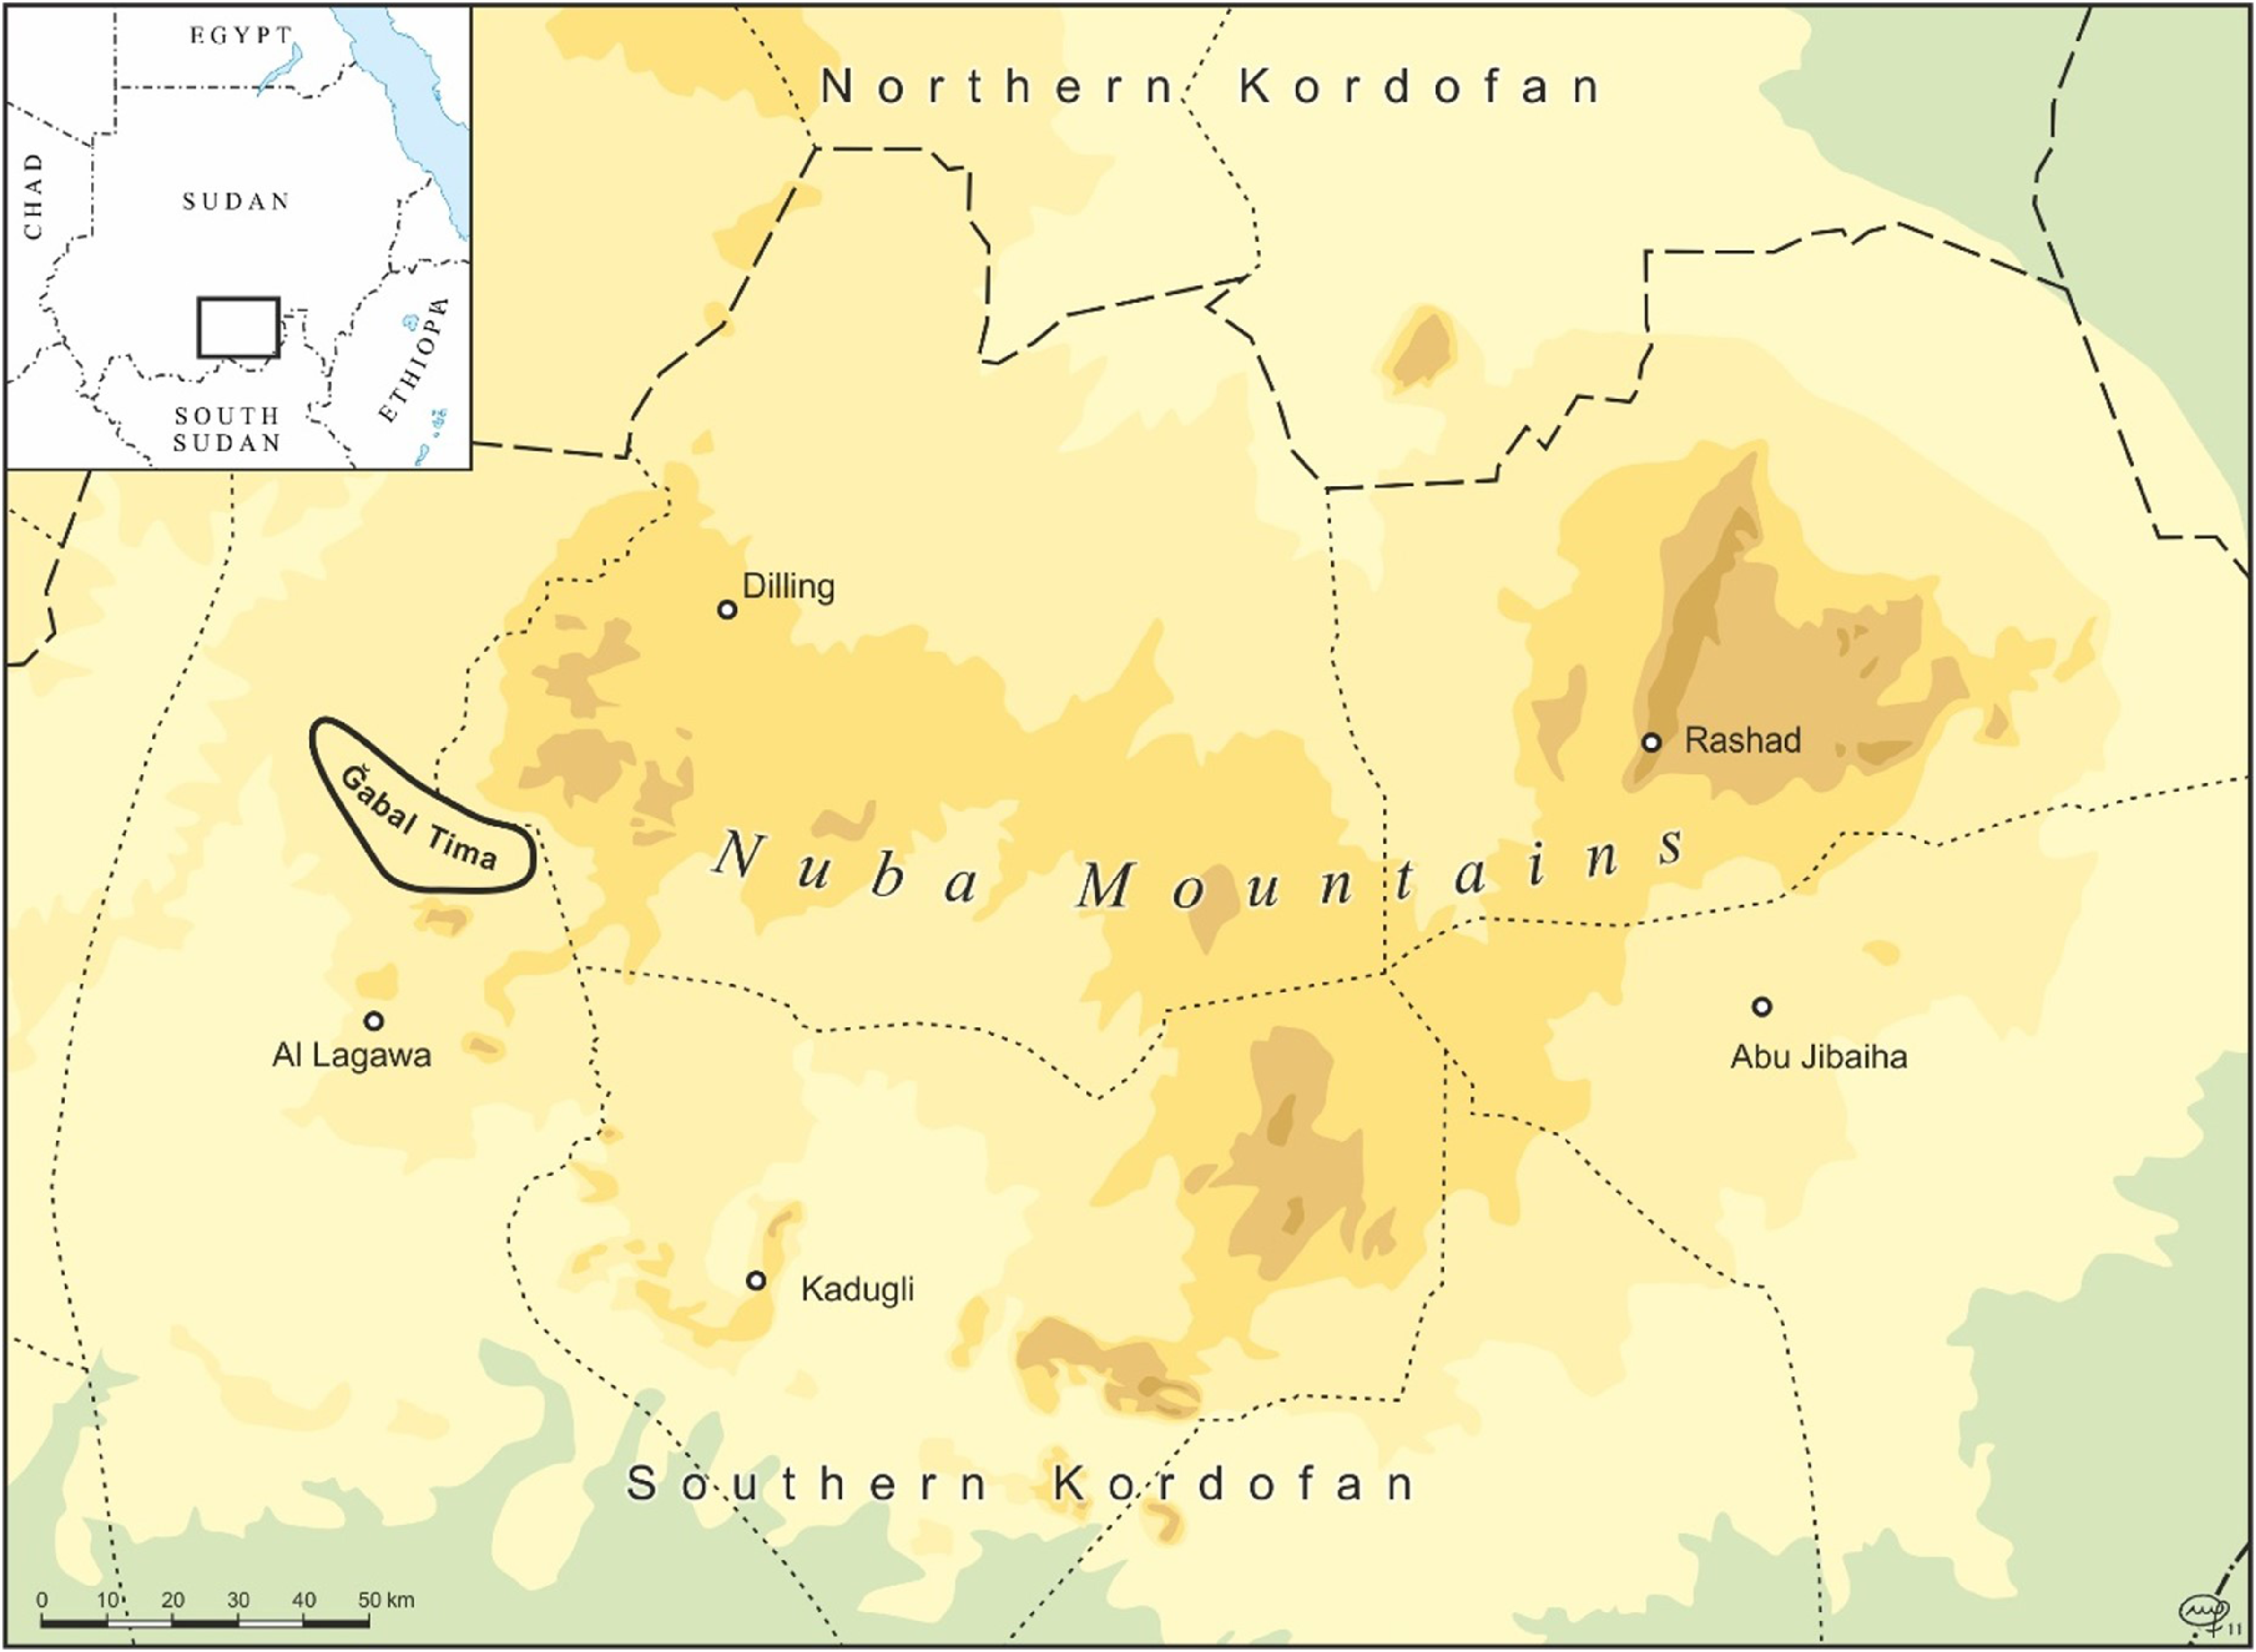
Figure 1 shows the area where Tima is spoken in the Nuba mountains of Sudan.
Map of the Nuba Mountains with the Tima-speaking area in Sudan.
Tima has twenty-one consonants; a two-way tonal contrast High, Low (plus downstepped High); and twelve vowels, made up of six pairs contrasting in ATR (Advanced Tongue Root) (Bashir Reference Bashir2010; Dimmendaal Reference Dimmendaal and Dimmendaal2009; Schneider-Blum Reference Schneider-Blum2013). The Tima twelve-vowel ATR system is typologically unusual, and includes a low central vowel pair, as well as a high central vowel pair; both of these (but especially the high central pair) are a rare contrast in an ATR system (see Casali Reference Casali2008 and Rose Reference Rose, Schneider-Blum, Hellwig and Dimmendaal2018 for discussion of ATR harmony in the Niger-Congo and Nilo-Saharan language families of sub-Saharan Africa, and Rolle et al. Reference Rolle, Lionnet and Faytak2020 for a broader view of ATR systems in the region).
The main speaker of this Illustration is Mr Hamid Kafi Daldum, a community language worker and security guard, born in 1968. Additional recordings by Mr Nasraldeen Abdallah Korsha (born 1943, died 2018) and Mr Kano Morto (born c. 1960) were also used for the quantitative data presented below. Additional recordings by Mr Darjawad Ismail Tutu (born 1972), Mr Durban Maki (born 1941), Mr Babo Tima (born 1965), Mr Alhaj Tuutu Jubaara (DOB unknown), and Mr Zacharia Said (born c. 1940) were also used for this Illustration. The story was narrated by Mr Adlaan Misiriya (DOB unknown). The recordings for this Illustration were collected between 2007 and 2010, as part of a language documentation and dictionary project.Footnote 2
Consonants

The consonants of Tima include ten plosives, with voiced and voiceless pairs at the bilabial, alveolar, palatal and velar places of articulation. However, the voiced velar /ɡ/ is a marginal phoneme, and comparatively rare. The voiced palatal /ɟ/ is also relatively uncommon. The retroflex plosive /ʈ/ does not have a voiced counterpart (nor does the glottal stop, by definition). Note that the orthography uses an IPA dental symbol <t̪> for the voiceless denti-alveolar /t/, while the regular printed <t> represents the retroflex plosive /ʈ/. However, while the phonemic /ʈ/ is indeed retroflex for many speakers, it is not universally so, and in actual fact speaker HKD in this Illustration does not make a clear contrast between denti-alveolar /t/ and ‘retroflex’ /ʈ/. In our transcriptions of these sounds, we will use the IPA symbols, and add the orthographic presentation in brackets when orthography deviates from the IPA.
It should also be noted that /c/ is affricated, and could be characterized as more alveolo-palatal. In addition, the recordings show that intervocalic /d/ may be realized as [ɾ], and final /l/ may have a fricative release. Please note that we do not provide a narrow phonetic transcription with each item.
Tima also has a bilabial implosive (which is not lexically frequent); four nasal consonants (bilabial, alveolar, palatal and velar); a contrast between an alveolar and a retroflex tap/flap; a single lateral; the glides /j w/; and the glottal /h/ (which is quite frequent). Note that Tima has no oral fricatives. In particular, the absence of the fricative /s/ may be noted – it has been suggested by Dimmendaal (Reference Dimmendaal and Dimmendaal2009: 334) that /h/ in Tima is the result of a historical shift *s > h.
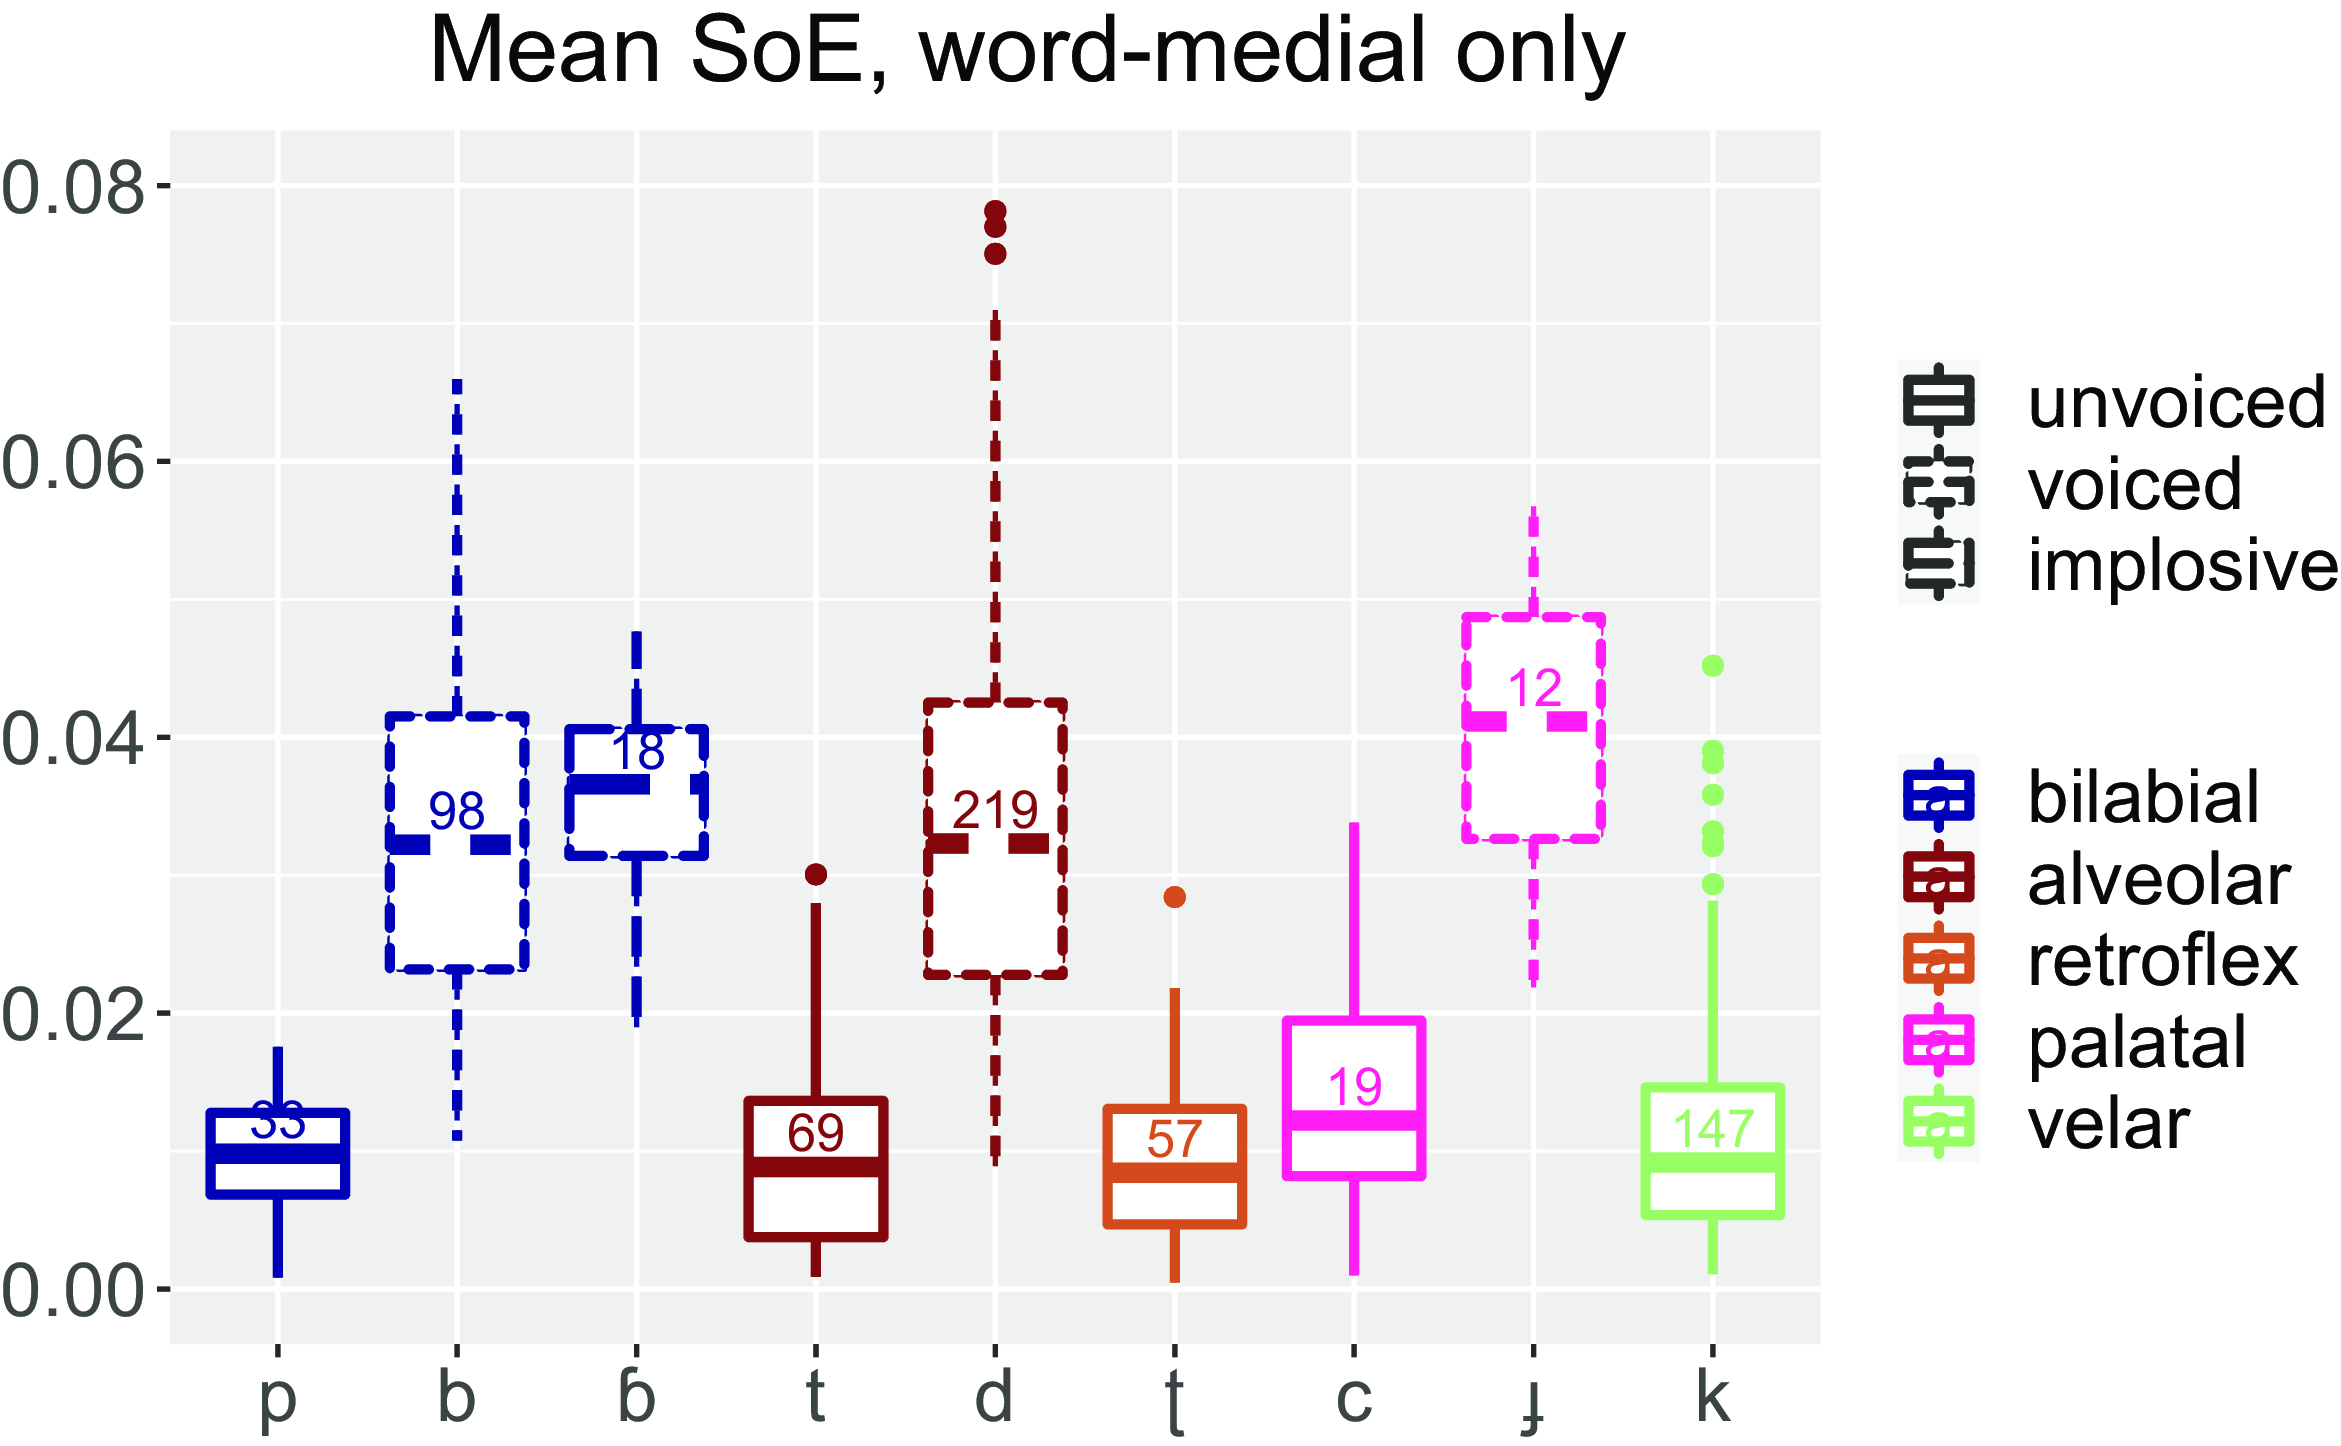
The following give examples of the plosives and of the implosive in initial, intervocalic, and final position. Note that word-final /ʈ/ and /c/ are extremely rare. Note also that although an example is not given of an initial glottal stop, this sound is in fact often heard at the start of a vowel-initial word, and also word-final after a vowel.

Plosives are rarely attested in word-final position – moreover, voiced plosives and the bilabial implosive are not attested in this position. Of the voiceless plosives in word-final position, /k/ is by far the most common (154 out of the 160 word-final voiceless plosive tokens in our database are /k/). However, author GS-B has noticed a ‘loss in progress’, where final /k/ is often unreleased or inaudible (see for example the word /kàlʊ̀wàtɛ̀k/ nightjar in the list above, or /k̀mʌ̀ɲúk/ liver given below for the vowel examples). When questioned, speakers claim that the sound is present; and when a noun is encliticised by demonstratives, for example, the /k/ is audible.
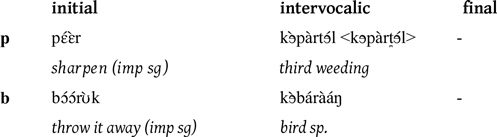
Figure 2 shows boxplots for burst/aspiration duration (i.e. positive Voice Onset Time, or VOT) for the voiced and voiceless plosives of Tima, as well as for the bilabial implosive /ɓ/ (the voiced velar /ɡ/ is not included due to very small token numbers). As can be seen on the figure, voiced plosives tend to have a VOT of about 10–20 ms, whereas the voiceless plosives tend to have a VOT of about 20–30 ms for the bilabial, alveolar and retroflex, and about 30–55 ms for the palatal and velar. These differences in VOT for place of articulation are cross-linguistically typical (cf. Cho & Ladefoged Reference Cho and Ladefoged1999; Cho et al. Reference Cho, Whalen and Docherty2019), and in general it can be said that the voiceless stops are not heavily aspirated. It is notable that both the voiced bilabial /b/ and the implosive /ɓ/ have similar very short VOT values of around 10 ms.
Burst/aspiration duration for 1315 tokens of the voiced and voiceless plosives and the bilabial implosive of Tima. Data are from word-initial and word-medial position. Numbers in the boxes indicate numbers of tokens.
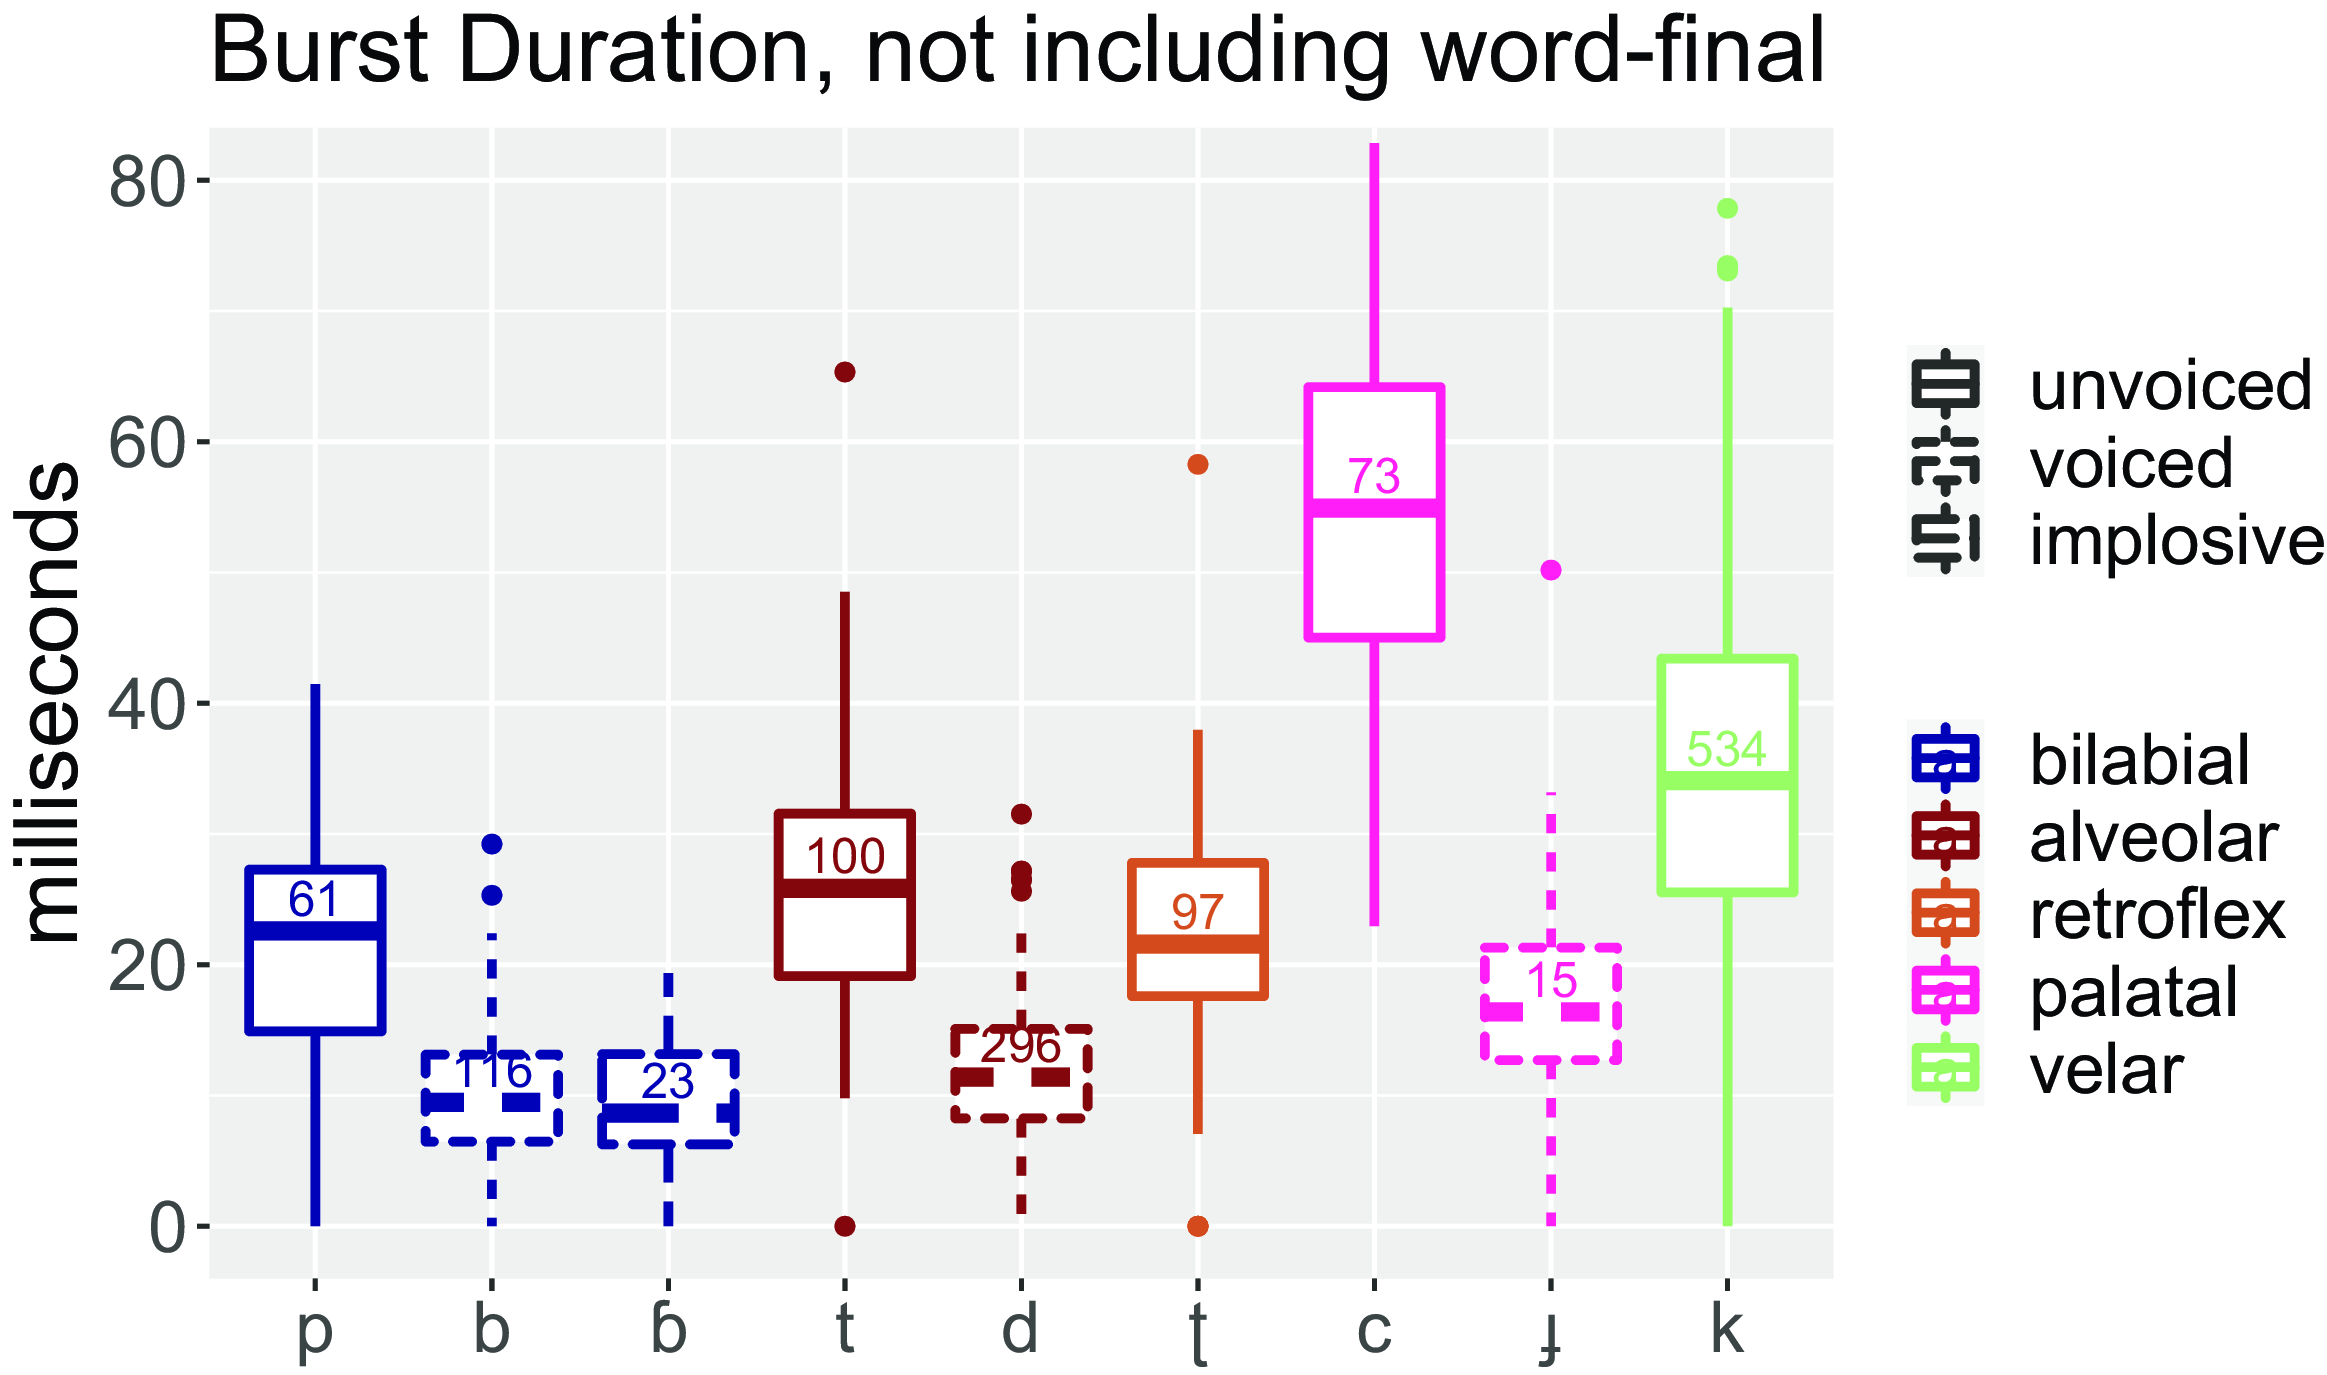
Figure 3 shows boxplots for mean Strength of Excitation (SoE) across the stop closure for word-medial tokens only. SoE is measured at the instant of significant excitation of the vocal-tract system during production of speech, and therefore represents the relative amplitude of impulse-like excitation.
Mean Strength of Excitation for 672 tokens of the voiced and voiceless plosives and the bilabial implosive of Tima. Data are from word-medial position only. Note that there are only eighteen tokens of /ɓ/ and twelve of /ɟ/. Numbers in the boxes indicate numbers of tokens.
It can be seen that the voiced plosives routinely have a much higher mean SoE than the voiceless plosives. Indeed, the very low value of about 0.01 for the voiceless plosives of Tima suggests a voiceless sound. This suggests that there is a ‘true voicing’ contrast in Tima (as noted above, the voiceless stops are not heavily aspirated). Finally, one may note that there appears to be evidence for a greater SoE for the bilabial implosive /ɓ/ as compared to the regular voiced plosive /b/.
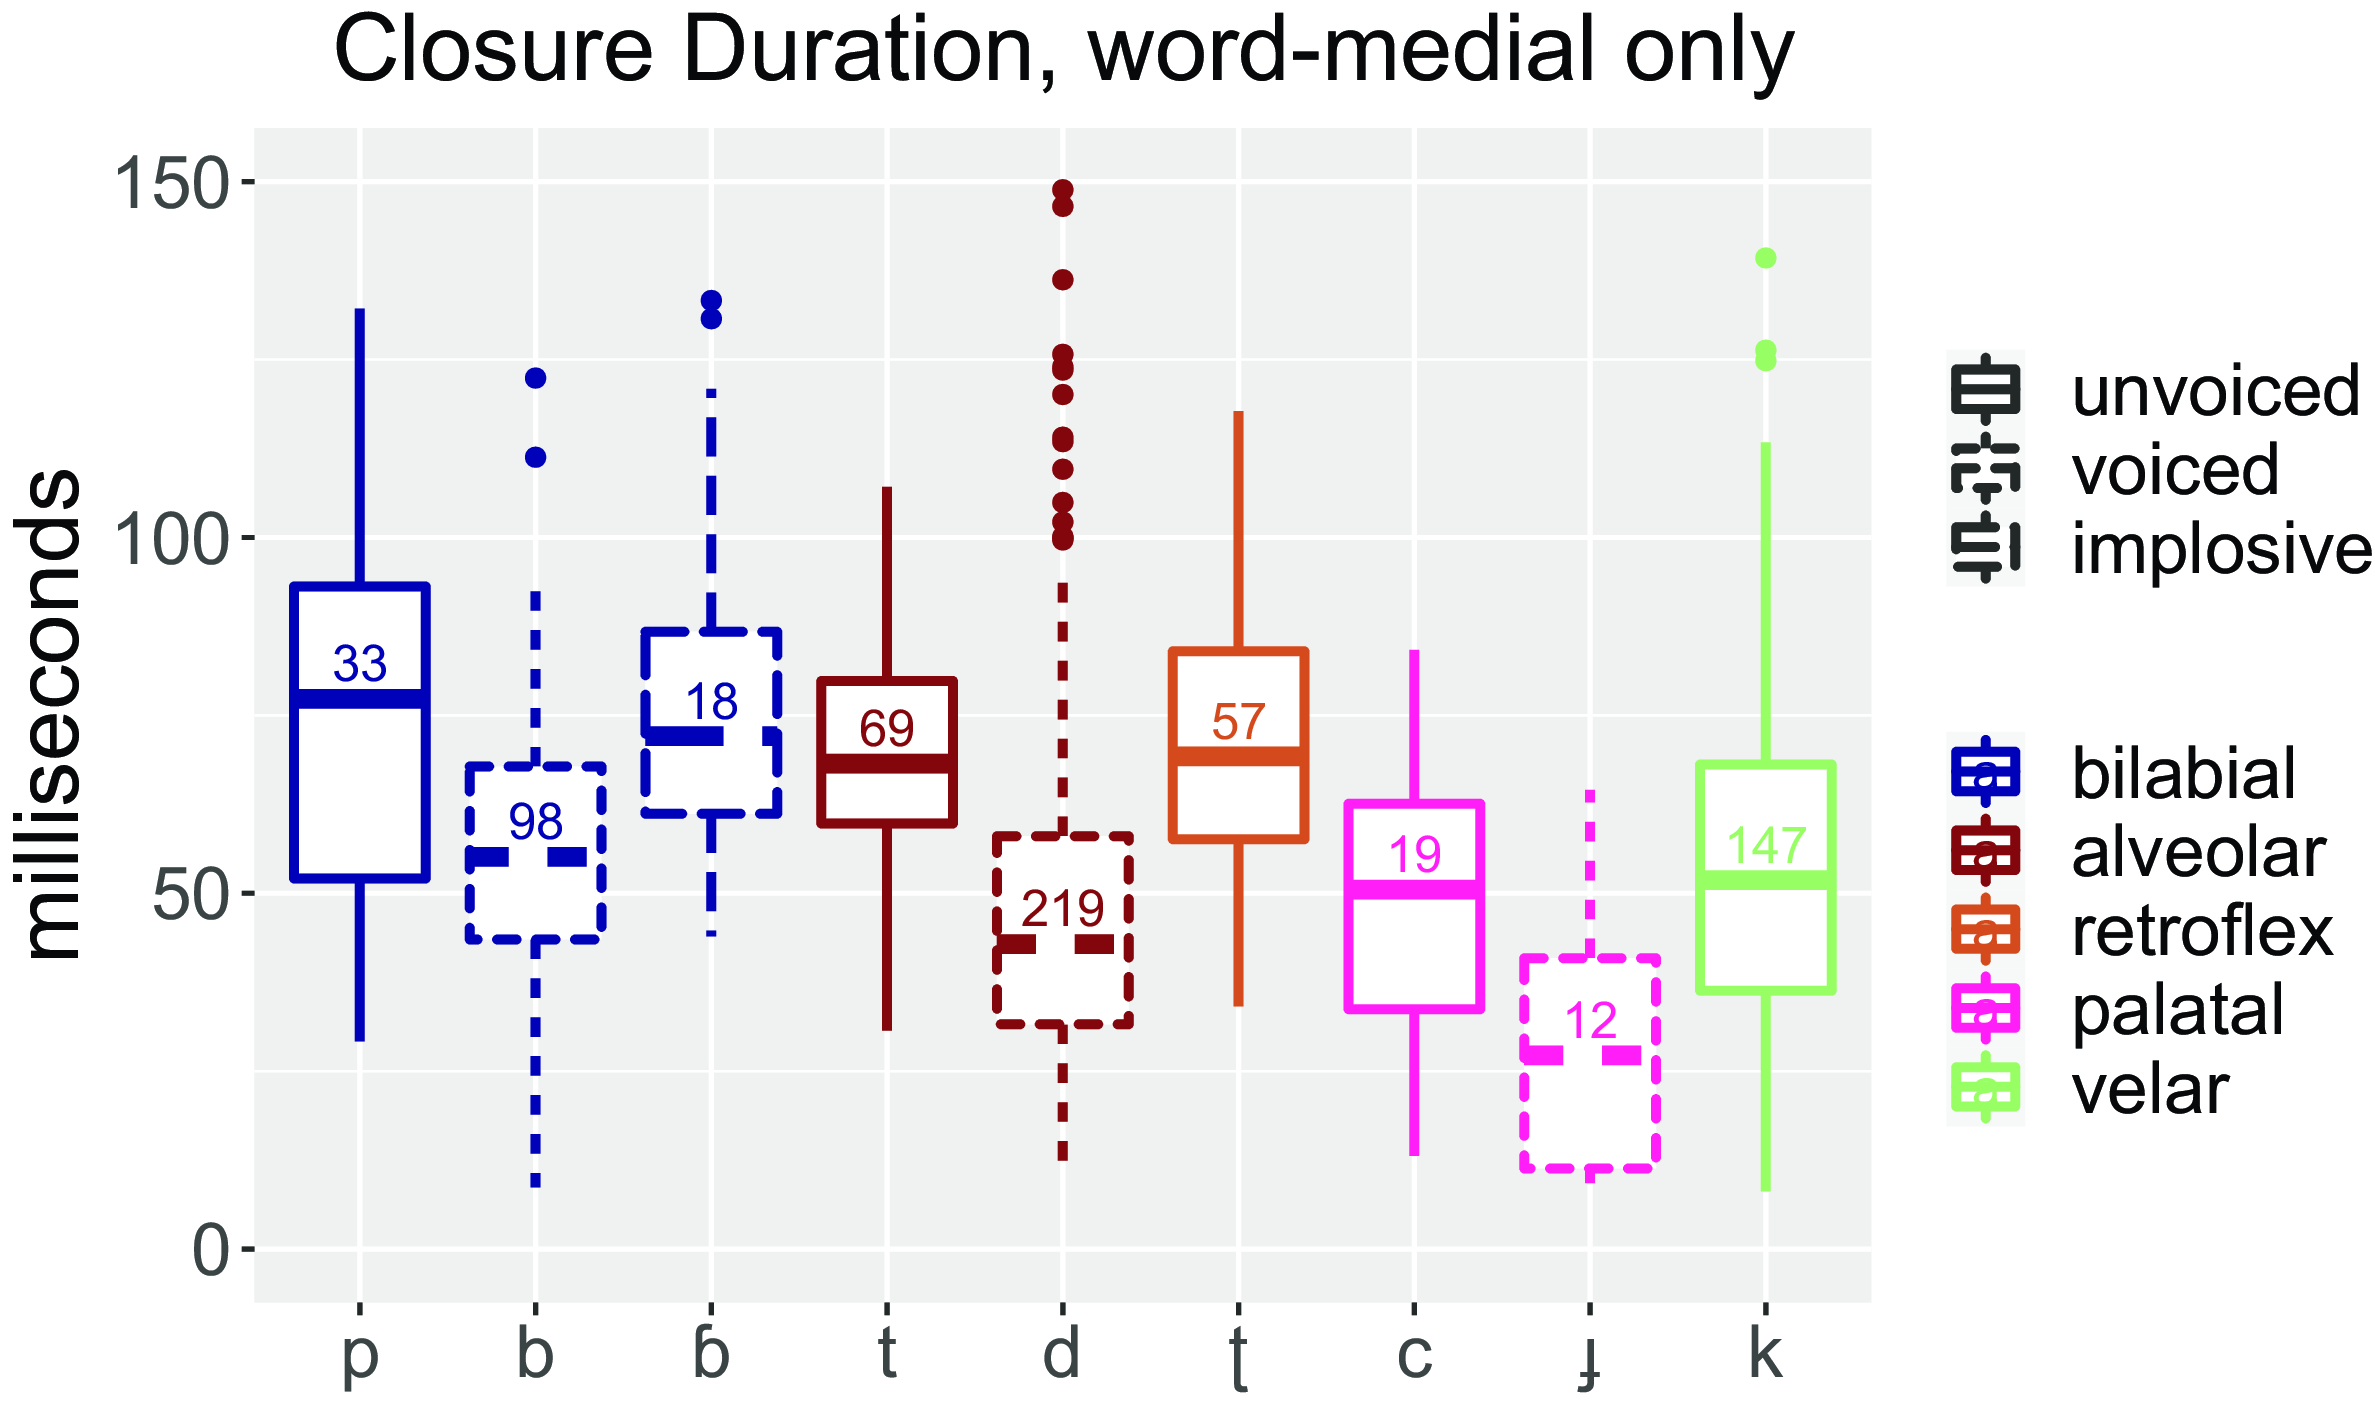
Figure 4 shows the boxplots of closure duration for the same consonant sounds. It can be seen that the voiced plosive closures are noticeably shorter than the voiceless closures (cf. Lisker Reference Lisker1957), and that there is a cross-linguistically common place effect whereby the more posterior places of articulation have a shorter closure than the more anterior places of articulation (Maddieson Reference Maddieson, Hardcastle and Laver1997). However, the most interesting point to note on this plot is that the bilabial implosive /ɓ/ has a noticeably longer closure duration than the regular bilabial /b/ (a mean value of 79 ms for /ɓ/ versus 55 ms for /b/). This is the main acoustic difference we have found between the bilabial plosive and the bilabial implosive. Whilst the SoE data above suggest slightly stronger voicing for the implosive, it is not clear how this (i.e. longer closure duration combined with stronger voicing) is achieved in terms of articulatory strategies – this is a topic for further instrumental investigation. It should also be noted that the bilabial implosive is much less common than the regular bilabial in our data – there are only eighteen word-medial tokens of /ɓ/ compared to ninety-eight tokens of /b/, but even this ratio is likely to be exaggerated, since we made an effort to include as many implosives as possible in our database.
Closure duration for 672 tokens of the voiced and voiceless plosives and the bilabial implosive of Tima. Data are from word-medial position only. Numbers in the boxes indicate numbers of tokens.
The sonorants (and also /h/ – see below) are attested in syllable-initial and syllable-final position. The following gives examples of nasals:Footnote 3

Note that there are two (near-)minimal pairs involving the nasals /m/ and /n/ in word-final position.
Nasals may serve as the nucleus of a syllable and carry tone, for example:

There are many examples of homorganic nasals plus stops (note that aN- is the third person perfective marker):
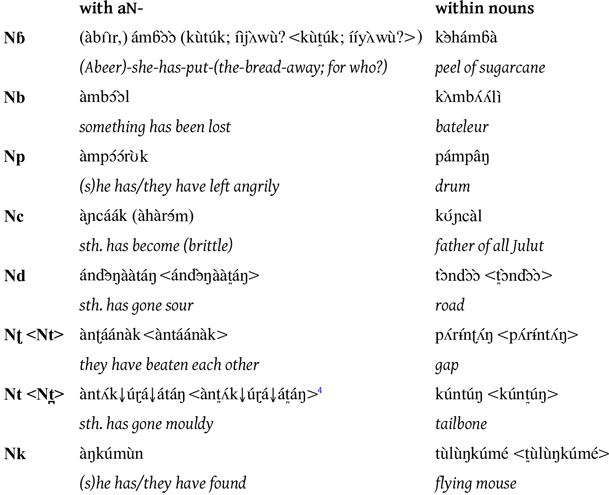
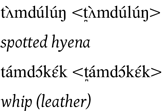
However, there is also the exceptional cluster /md/:Footnote 4
The liquids also occur in both syllable-initial and syllable-final positions. Note that we use the symbol for an alveolar trill /r/, rather than a tap /ɾ/, for typographic convenience, even though most of the productions of this sound tend to be a tap rather than a full trill.

There is a minimal set for the liquids:
Figure 5 shows a near-minimal pair for the contrast between the two rhotics /r/ and /ɽ/ in the words (a) /kúrùh/ push and (b) /kùɽûr/ side arm of the big river. It can be seen that the retroflex /ɽ/ (labelled as ‘R’) has a clearly falling F3 in the preceding vowel when compared with the alveolar /r/, in intervocalic position. In addition, the /r/ in word-final position in the word /kùɽûr/ shows some (perhaps fricated) trilling, with two clear pulses evident in the time-waveform.
Time waveforms and spectrograms for the words (a) /kúrùh/ push and (b) /kùɽûr/ side arm of the big river as produced by speaker HKD. The red line on the time-waveform shows f0 (range 50–250Hz). The spectrogram shows the range 0–5 kHz. Note that in the phonetic labelling, ‘R’ denotes /ɽ/ and ‘H’ marks aspiration.

The following gives examples of the glides /j/ and /w/ and the glottal /h/ in different positions. Note that the word /kúj/ <kúy> is pronounced by older speakers as [kúð] - example pairs of that kind show that younger speakers seem to have reanalysed a previous dental fricative as a palatal glide.

Apart from sequences of nasal plus stop, the only consonant clusters found in Tima are stops plus the glide /w/. Stop-plus-glide clusters are limited to syllable-initial position.


The fricatives [f s z] are only attested in loanwords, e.g.

Mostly, sounds from Arabic that are unfamiliar to the Tima speakers, are adapted to the sound system of Tima. For instance, Arabic [ʃ] and [s] are most often realized as [c], as in:

The postalveolar [ʃ] is regularly used for the Arabic word <shāy> tea that people in Tima would prefix with their plural marker and yield [ɪ̀ʃá:hɪ̀] (here [ɪ̀ʃá:ɪ̀]) <ɪ̀shááhɪ̀> ‘tea’ that alternates with [ɪ̀cá:hɪ̀] <ɪ̀cááhɪ̀>.
Vowels
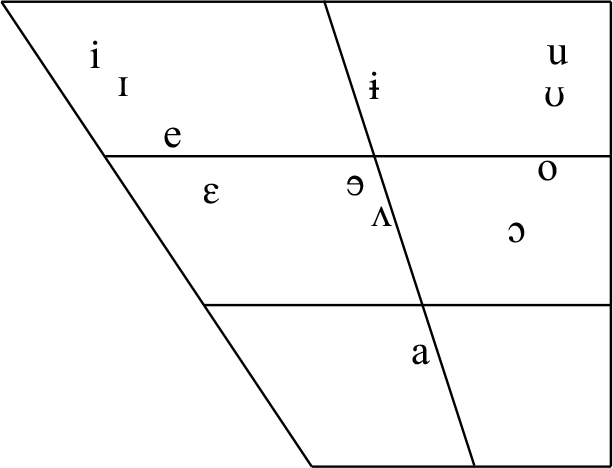
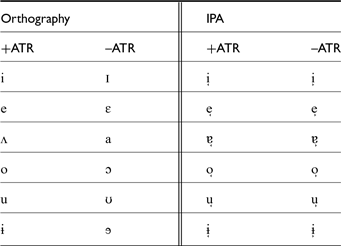
Table 1 shows the vowels of Tima as they are represented in the orthography of the language, and also as they would be represented formally in the International Phonetic Alphabet – namely, with diacritics for ATR. It can be seen that the language orthography makes use of the International Phonetic Alphabet; however, as can be seen from the vowel chart at the beginning of this section, these vowels do not occupy their traditional positions in the quadrilateral of cardinal vowels. Since diacritics are difficult to read, we will continue with using the vowel orthography in this Illustration. However, the reader is alerted that /a/ represents a low central –ATR vowel like [ɐ], and that /ʌ/ represents a mid central schwa-like +ATR vowel (rather than a back vowel).
Different representations of Tima vowels.
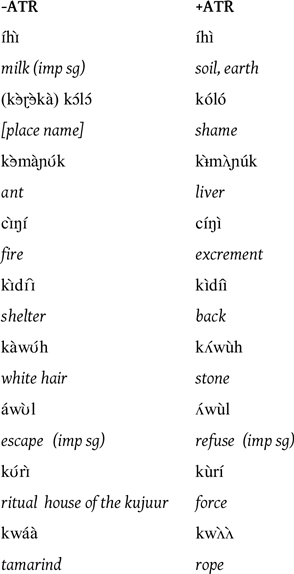
The following examples illustrate the Tima vowels in different positions (see below for discussion of the long/short vowel contrast):Footnote 6 Footnote 7


The following are some (near-)minimal pairs involving the ATR contrast:
As already mentioned, particularly unusual in the Tima system is the presence of a low central vowel pair +ATR /ʌ/ versus –ATR /a/, as well as a high central vowel pair +ATR /ɨ/ versus –ATR /ɘ/. Figure 6 shows the vowel formant results for our three speakers’ data. It can be seen in Figure 6a that the –ATR vowels (in navy) occupy a much larger space than do the +ATR vowels (in brown). The ‘floor’ of the vowel space is raised for the +ATR vowels. In fact, the phonemically low +ATR central vowel /ʌ/ is quite high in the vowel space, at the same level as the mid +ATR vowels /e/ and /o/. In the absence of an ATR system, the vowel /ʌ/ might more accurately be described as a schwa-like vowel. Indeed, it has been observed that for languages having an ATR contrast in the low vowels, the [+ATR] low vowel is often not actually phonetically low (Casali Reference Casali2008).
Vowel plots showing mean formant values for 2213 tokens (note that 279 tokens with measured F2 higher than 2200Hz, and/or F1 higher than 1000Hz, were removed from the database before plotting). Short and long vowel data are combined. (a) Vowels presented separately for +/–ATR, with 95 $\%$
confidence ellipses. (b) Vowels combined on the one plot without ellipses.
$\%$
confidence ellipses. (b) Vowels combined on the one plot without ellipses.
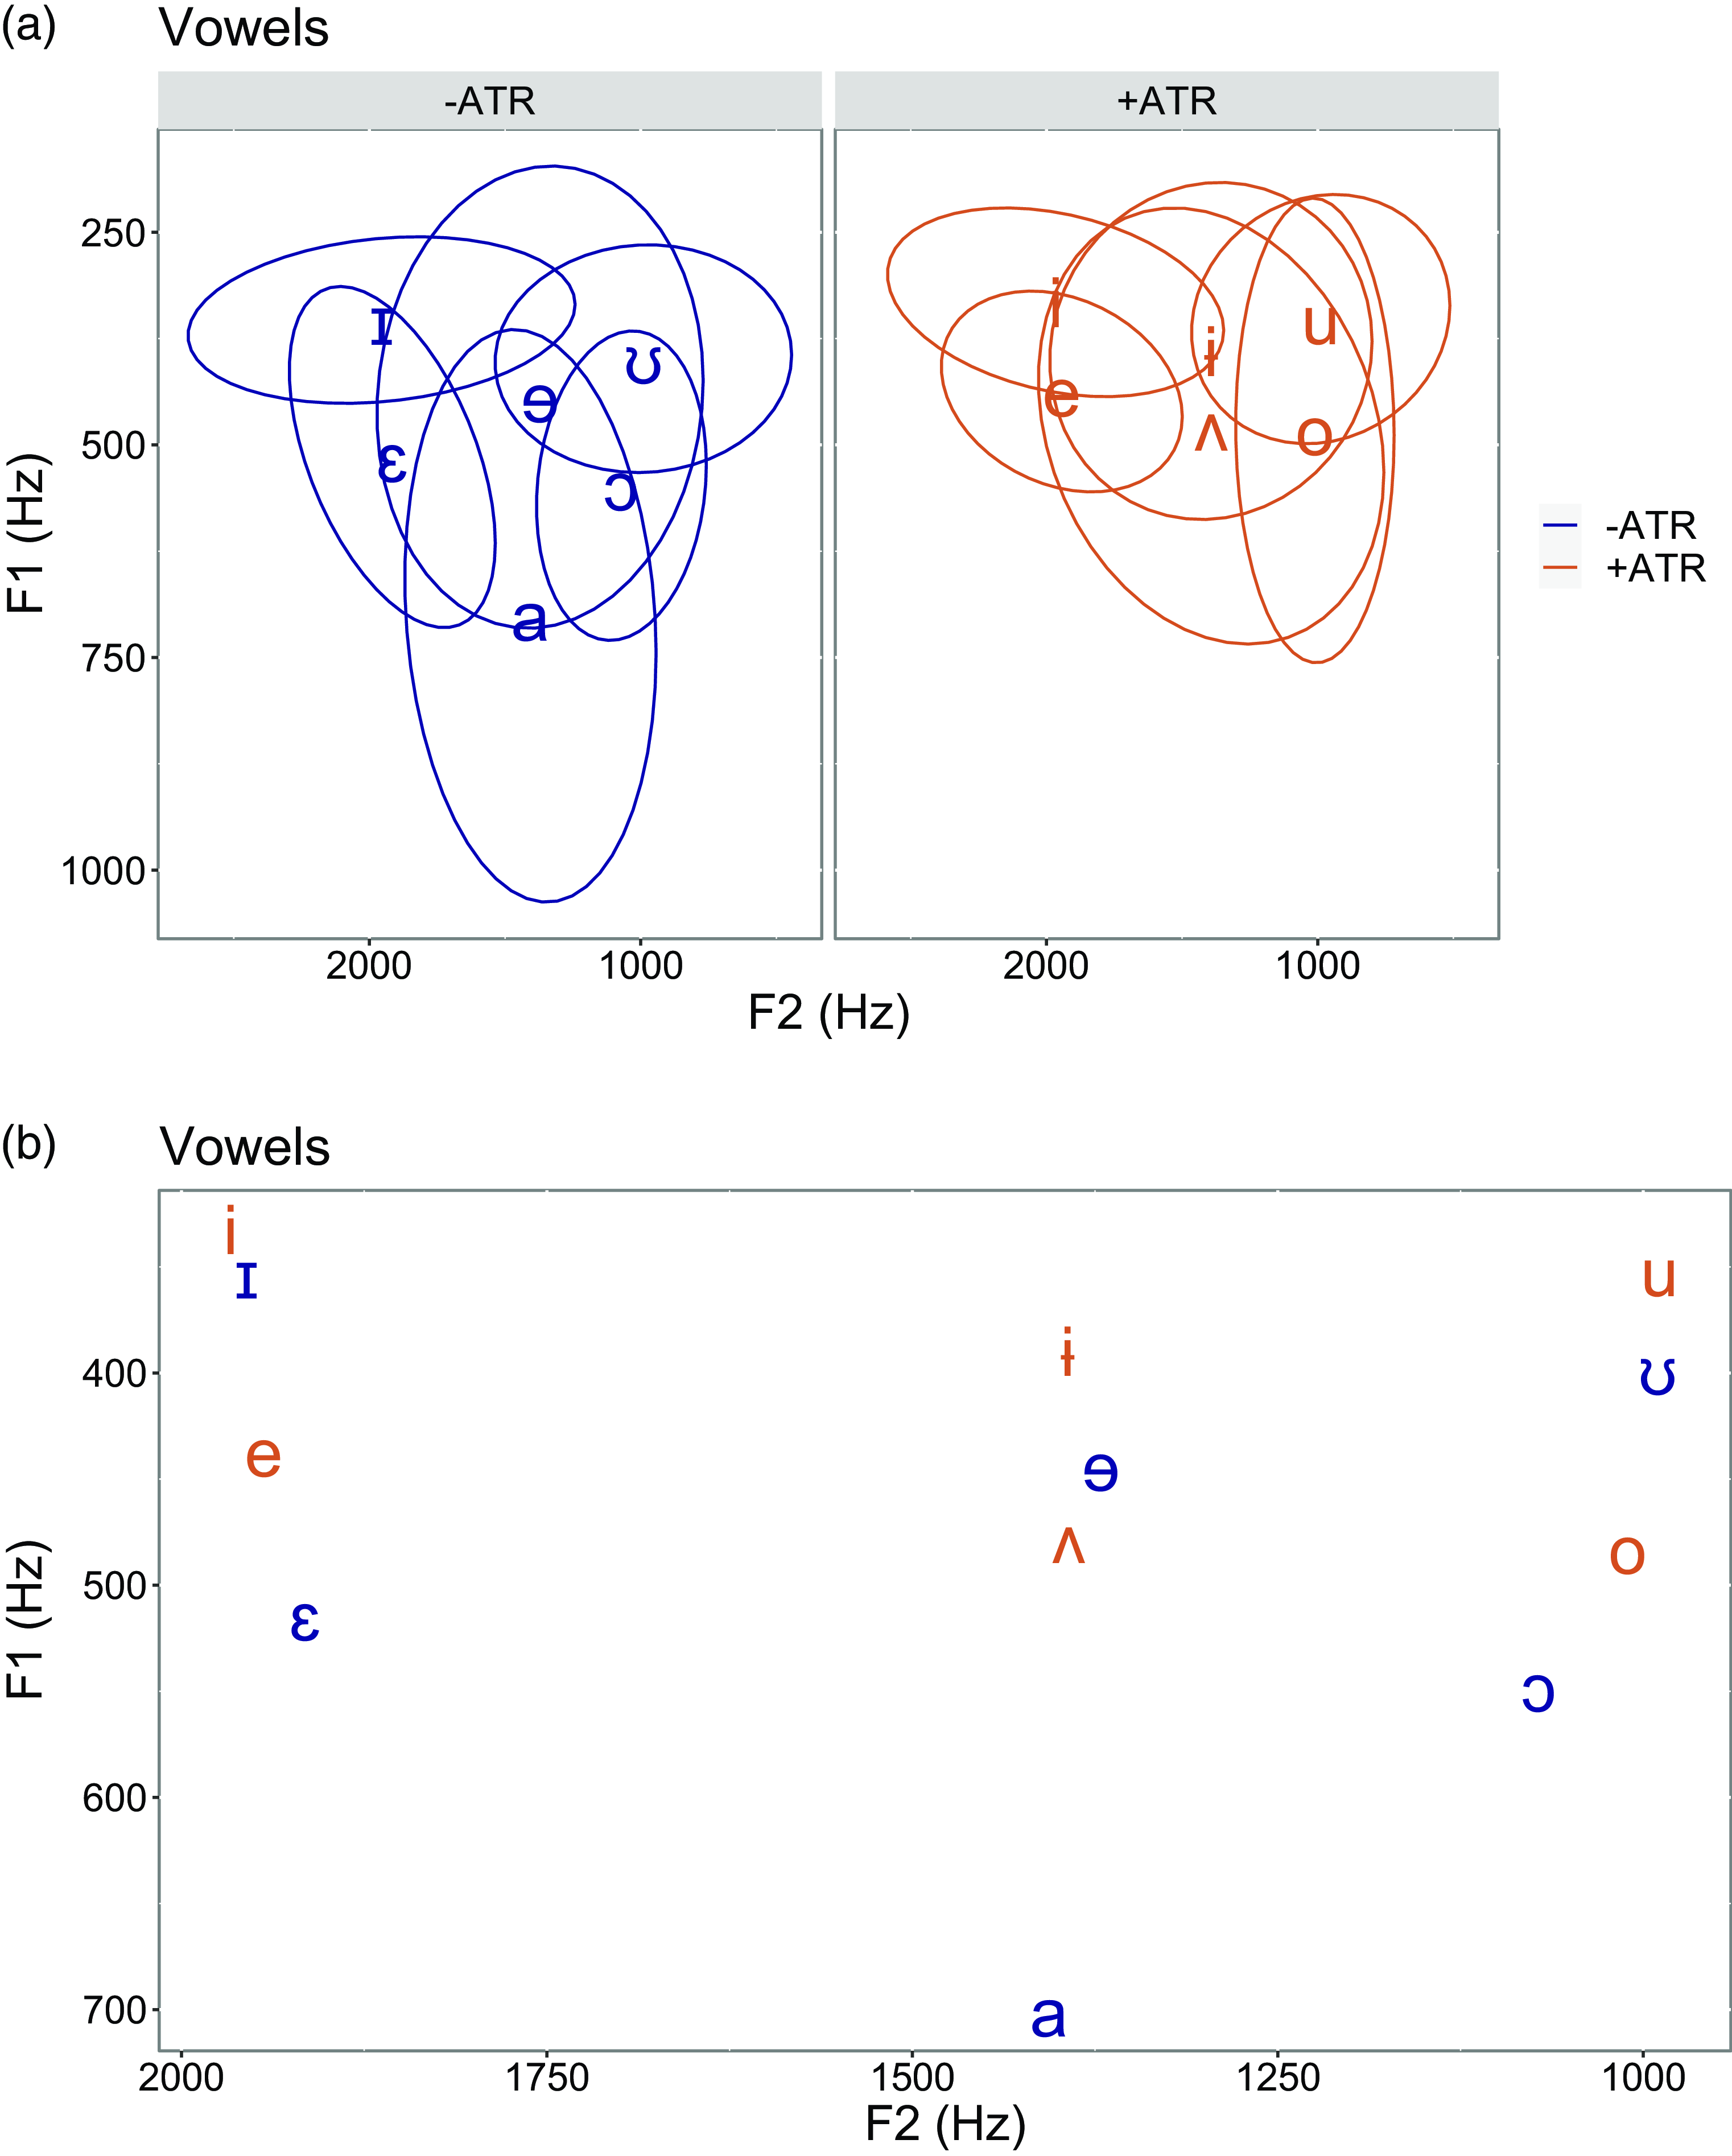
Figure 6b shows the +ATR and –ATR vowels combined. Here, it can be seen that the low central +ATR /ʌ/ occupies a very similar space to high central –ATR /ɘ/. Impressionistically, both sound quite schwa-like, and different from the +ATR high central vowel /ɨ/, which sounds more like its cardinal vowel value (as already noted, the low central –ATR vowel sounds like IPA [ɐ]). Thus, the low central ATR vowel pair /ʌ/ and /a/ do not occupy the same portion of the vowel space, and /ʌ/ in fact overlaps with high central /ɘ/.
An additional, important, difference between +ATR and –ATR vowels is in voice quality. Tabain et al. (in press) show that, as measured by spectral tilt in the 0.1 to 1.0 kHz range and by H1*–H2* (the difference between the first and second harmonics), the +ATR vowels have a more open glottis. The +ATR vowels also have a greater strength of glottal excitation (as presented above for plosives), which may be due to the larger oro-pharyngeal cavity facilitating voicing when the tongue root is advanced (measures of harmonic-to-noise ratio, such as Cepstral Peak Prominence, do not appear to separate out –ATR from +ATR in Tima). However, the various ATR differences in voice quality are moderated by an interaction with vowel height (for instance, high vowels have a greater magnitude of spectral tilt than low vowels, suggesting greater vocal fold spread for the high vowels – see Figure 7). The reader is referred to Tabain et al. (in press) for further discussion of the importance of the multiple acoustic features for the ATR contrast in Tima, and for a comparison between the ATR systems of Africa with the register systems of South-East Asia.
Boxplots showing spectral tilt in the frequency range 0.1kHz to 1.0kHz according to +/–ATR (in colour) and according to vowel height (in linetype). 2492 long and short vowel tokens are combined in this plot.

Vowel length
Tima vowels can be long and short. However, long vowels are much less common than short vowels, making up about 20 per cent of the database (410 out of a total of 2492 vowel tokens) – and this is even after special effort to include more long vowels.Footnote 8 Table 2 shows duration in milliseconds for the long and short vowels of Tima, including the ratio of long vowel to short vowel (mean) duration. It can be seen in this table that the mid vowels are in general less common than the high or low vowels, although this is more true for the +ATR mid vowels than the –ATR mid vowels (the pattern is less obvious for the long vowels, since as noted, we made an effort to include more long vowels in the database). It can also be seen that while the short vowels range from about 40 ms to about 110 ms, the long vowels range from about 140 to 210 ms. The ratio of long to short vowel duration ranges from 1.33 for /ɛ/ to 3.13 for /ɨ/, but is typically around 2.00. (Note that the long vowel /ɪɪ/ has a particularly long duration, longer than the long low vowels – it is possible that this may be an idiosyncracy of the words in our database).
Mean, standard deviation and number of tokens for long and short vowel durations in Tima (in milliseconds). The final column gives the ratio of long/short vowel duration.
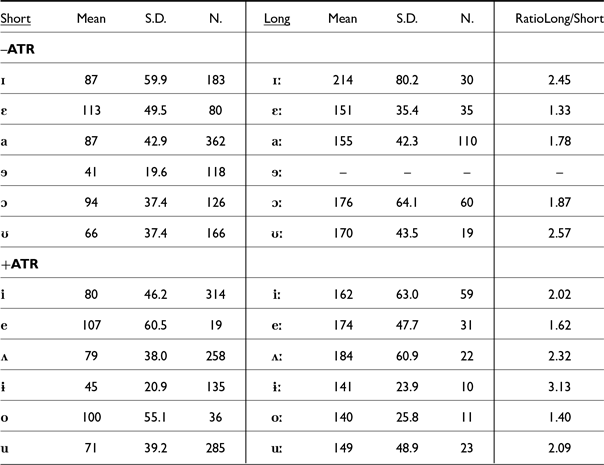
The high central –ATR vowel /ɘ/ only occurs as a short vowel: it has a mean duration of 41 ms. By contrast, the +ATR /ʌ/ has a mean duration of 79 ms. The –ATR vowel /ɘ/ is therefore a very short vowel.Footnote 9 It may be noted that this broadly fits in with the cross-linguistic pattern that high vowels are shorter than low vowels (cf. Solé & Ohala Reference Solé, Ohala, Cécile Fougeron, D’Imperio and Vallée2010) – and in Tima, /ʌ/ is phonologically a low vowel. Tabain et al. (in press) show that the high –ATR /ɘ/ also has less energy than the ‘low’ +ATR vowel /ʌ/.
The following are some (near-)minimal pairs involving vowel length:

As just mentioned, long vowels are relatively rare in Tima. It is assumed that a number of them originate from a loss of intervocalic consonants which can be seen by comparing data from Katla (data provided courtesy of Birgit Hellwig – however there is no audio included in the present Illustration). Consider the following three examples (see also Dimmendaal Reference Dimmendaal, Schneider-Blum, Hellwig and Dimmendaal2018: appendix).

Synchronically, the long vowels may be treated as long monophthongs that are able to license contour tones by virtue of being bimoraic.
ATR harmony, back harmony, fronting harmony
As many of the examples presented in this paper show, the ATR value of the root determines the ATR value of the prefix, here the singular prefix kV-/cV-. Consider the following examples (presented in the table on ATR distinctions above), with the morpheme boundaries indicated.

Furthermore, these prefixes indicating singular (as well as plural) number (and a number of verbal suffixes, such as middle voice and causative) exhibit front/back harmony. The height of affix vowels is invariable, i.e. they are always high. Consider the following examples, some of them again being repeated.

For more examples of front/back harmony (and a change in the system), including the harmonic behaviour of both affixes and clitics, see Bashir (Reference Bashir2010: 121 ff., and Chapters 5 and 6), and Dimmendaal & Schneider-Blum (in preparation).
Tones
Though a thorough tonal analysis of Tima is still pending, we can say with some confidence that Tima has a two-tone system, H and L (High and Low), with an additional downstepped high tone ↓H (the conditions for which are described below). The tone-bearing unit is usually a vowel but may be a syllabic nasal at the beginning of the word or a sonorant coda. In addition, the H and L tones can combine on the syllable rhyme (i.e. on a long vowel nucleus; or on a short vowel nucleus plus sonorant coda) to produce rising LH and falling HL tones. Note also that phonetically the second element of a contour tone may be realized on the adjacent sonorant. One word, /kàɡááɡâk/ rufuous crowned roller, is attested which has the falling tone on a short vowel preceding the plosive /k/. At our present status of knowledge, we do not know how this fits in with the general analysis.
Tone can be used to produce minimal pairs at the lexical level (e.g. within the noun class) or at the grammatical level (e.g. noun versus verb; single action versus pluractionality; telic/atelic distinction). Minimal or near-minimal pairs in tone are quite common in Tima.
The following are some minimal pairs involving tone:

The downstepped tone ↓H only occurs following a H tone, usually within the same word, but, as can be seen in the transcribed passage below, also across syntactic boundaries (consider e.g. ŋʊ̀ɲáŋɘ́n↓á ṕnʌ̀jì its use). The following illustrate the process of downstep:
The last item /kááhp↓ɔ́/ fontanel is a transparent construction, originating from /káàh àpɔ́/ the head is soft. This and similar examples allow us to assume that the downstep in a number of cases came into being by loss of a low tone-bearing unit, or by high tone spreading to a low tone-bearing unit, causing the low tone to become un-associated, and thereby triggering downstep. For more information see Dimmendaal & Schneider-Blum (in preparation). With some words, such as /pɔ́r↓ɔ́mpɔ́r↓ɔ́ŋ/ wasp sp. and /dúrúmp↓óŋ/ zorilla, the existence of the low tone cannot be proved any more, i.e. the words are lexicalized containing the down-stepped high tone. Since examples of that kind are so rare, we do not consider this tone as a toneme, but by analogy to /káàh àpɔ́/ the head is soft as downstepped high.
In summary, the tonal system is characterized by a rather complex system of tonal processes conditioned by morphology and syntax. However, further detailed study of this system is required.
Figure 8 shows boxplots for f0 for the H, ↓H (labelled !H) and L tones. It can be seen that the ↓H tone indeed patterns phonetically as a mid tone, intermediate between the H tone and the L tone.
Boxplots showing f0 (2326 tokens), sampled at the temporal midpoint of the vowel. Long and short vowels are combined, but contour tones are excluded. Data are from three male speakers. F0 values of less than 80Hz and more than 230Hz were removed as outliers. Note that !H denotes ↓H.

Figure 9 shows GAM-smoothed f0 plots for the simple tones of Tima on both long and short vowels, and for the contour tones of Tima (on long vowels only). Data are time-normalized over the duration of the vowel. It can be seen that the H tone has a later peak on long vowels than on short vowels (brown line in the panels labelled ‘short’ and ‘long’). It can also be seen that the downstepped tone (labelled ‘!High’ on this plot) begins high, and drops off quite rapidly over the course of the vowel, be it short or long (cyan line). It can also be seen that the low tone becomes lower over the course of the vowel (navy line in the panels labelled ‘short’ and ‘long’) – and that the alignment of the low tone and of the downstepped tone are similar. It should be noted that there are many more short tokens in this plot than long tokens (2057 short, 268 long and 194 contour), so the grey bands show much greater overlap for the long vowel tokens than for the short vowel tokens. Note also that the wide grey bands for the downstepped High tone may indicate typical behaviour of an allotone, or else may be due to the relatively small numbers of tokens of the downstepped High.
GAM-smoothed timeplots showing f0 (2519 tokens). Data are shown separately for short vowels (simple tone); for long vowels (simple tone); and for long vowels with a contour tone. Data are from three male speakers. F0 values of less than 80Hz and more than 230Hz were treated as NA values for the purposes of plotting. Grey bands surrounding the smoothed lines denote confidence intervals. Note that ‘!High’ denotes the downstepped ↓High tone. Note also that in the panel labelled ‘contour’, the light green line denotes a falling contour HL, and the pink line denotes a rising contour LH.
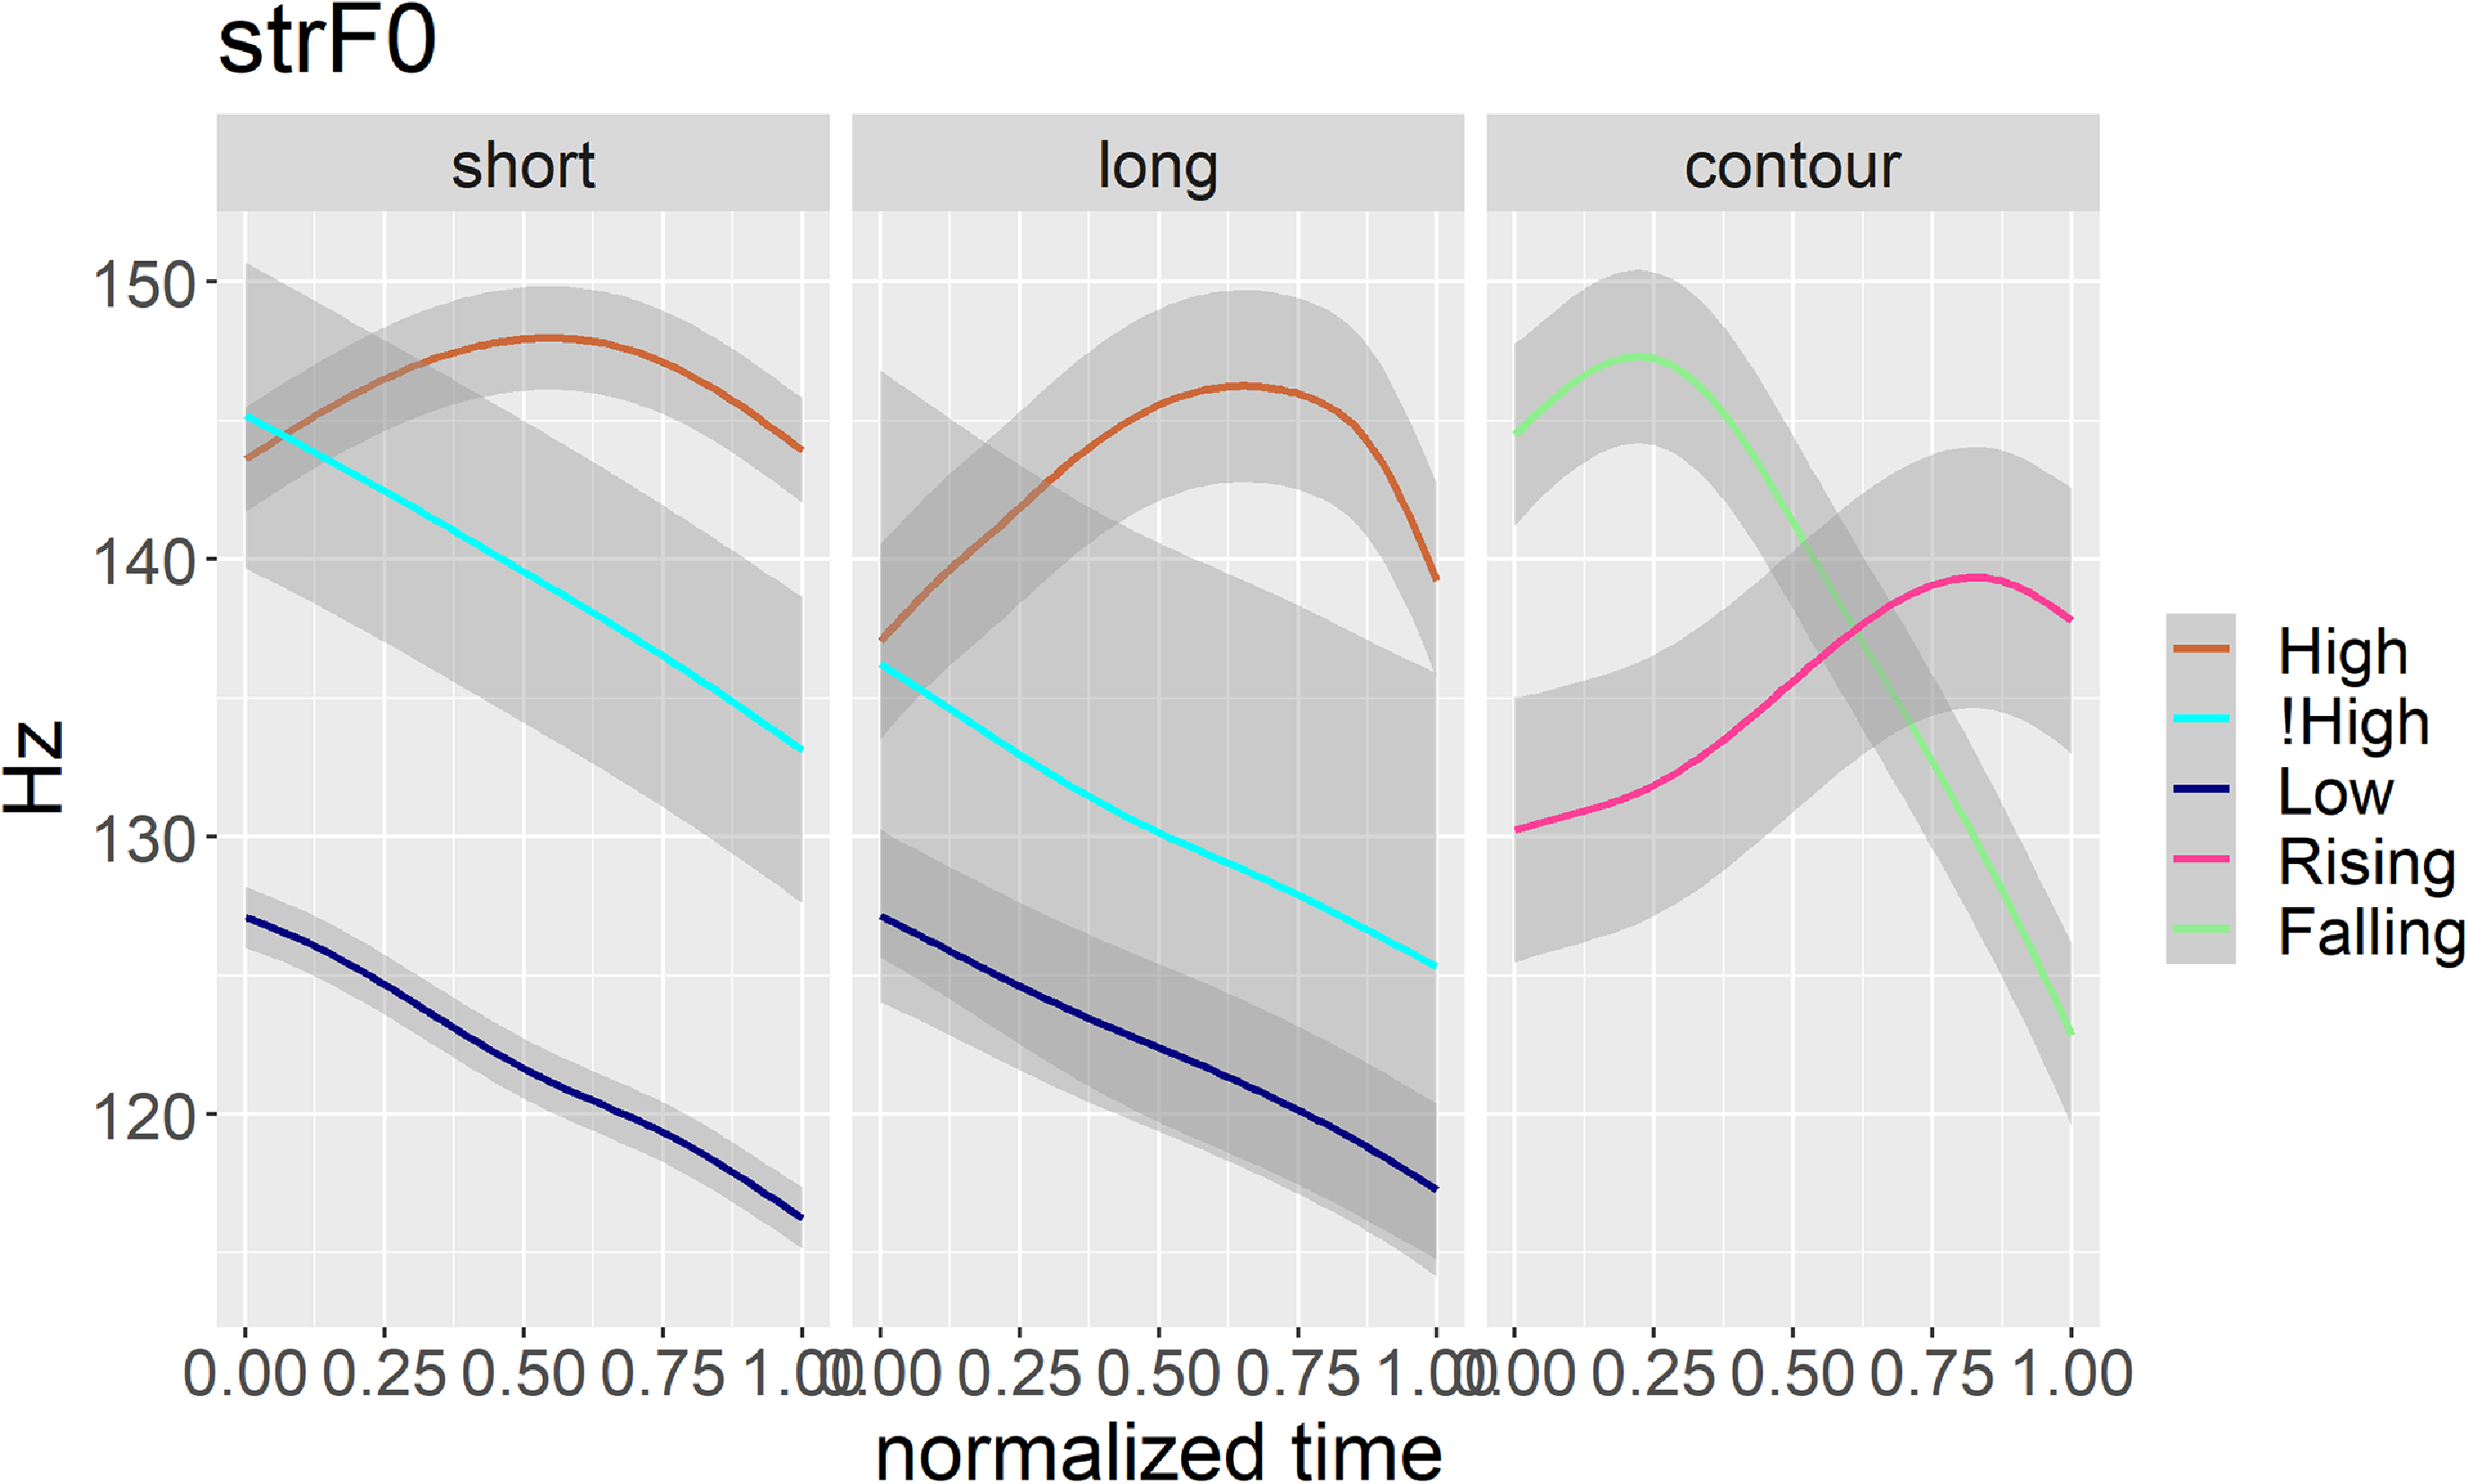
Finally, it is clear that for the contour tones (where light green denotes a falling tone HL, and pink denotes a rising tone LH) there is a clear early peak for the falling tone, and a late rise for the rising tone. The early peak for the falling tone HL is relatively earlier than the peak for the simple H tone in both the short and long vowel contexts.
It may be worth noting that in our database, most monosyllables have a falling tone HL (fifty-nine out of eighty-six monosyllabic words). Moreover, most monosyllables have long vowels or sonorant codas. In polysyllabic words, contour tones are more likely to occur on the last syllable of a word. Polysyllabic words are also more likely to begin with a Low tone. However, this last point may reflect the fact that our database is dominated by nouns, and initial H tones may be more frequent if we included more verbs in our database.
Syllable structure
The syllable may be open or closed, i.e. the coda position may be filled or empty. The syllable onset is also optional. A monosyllabic independent word, however, must be bimoraic, i.e. it must consist of a heavy syllable CVS (where coda ‘S’ is specifically a sonorant) or (C)VV(C). There are no monosyllabic independent words with the structure CV or VC – these are only found in clitics. Examples of permissible structures in independent lexical items include /ɡ́ŋ/ all, /dáà/ run, /éèl/ buy, and /cɛ́ɛ̀n/ face from the tables above. The monosyllable /ɪ́ɪ̀/ eyes with its VV structure is rather exceptional.
Tima has mainly mono- and disyllabic roots, with trisyllabic roots being quite rare. Whenever the root contains three or more syllables, reduplicated roots or lexicalized frozen compounds are involved (with the parts no longer being fully transparent). With regard to reduplication, consider for example the above-mentioned lexeme /kád↓ɪ́ŋkád↓ɪ́ŋ/ parietal bone. With regard to semi-transparent compounds, consider /kááhp↓ɔ́/ fontanel mentioned above, as well as /kéŋéd↓í/ waterplace, which can be traced back to /kɪ́ŋɛ̀/ mouth and /íídì/ water.
Grammatically complex words in Tima tend to be polysyllabic as a result of inflectional and derivational affixation. An example is /àntáánàk/ they have beaten each other, with the person/TAM (Tense-Aspect-Mood) marker an- preceding the root taan, in turn suffixed by the antipassive marker -ak. Cliticization results in the formation of even more complex phonological words. Consider, for example the above-mentioned /mʌ̀ɽ́mʌ́ɽátáŋ (kwɛ̀ɛ́ŋ)/ <mʌ̀ɽ́mʌ́ɽát̪áŋ (kwɛ̀ɛ́ŋ) > decorate (the bowl), which consists of a reduplicated root cliticized by the source marker =a and the locative marker =t̪aŋ.
Transcription of recorded passage
The transcription is broadly phonemic. An orthographic version including morpheme breaks is also given, followed by interlinear glosses and a translation into English. Pause units are marked by | in the first line, and in some cases ‖, with the latter corresponding to a final (usually falling) intonation.
Phonemic transcription
Practical orthography (with morpheme breaks)
English gloss, making use of the following grammatical abbreviationsː
caus=causative; cond=conditional; cop=copula; dem=demonstrative; dir= directional; ep=epenthetic element; erg=ergative; foc=focus; ideo=ideophone; incl=inclusive; ins=instrument; loc=locative; neg=negation; p=person; pl=plural; pro=pronoun; prox=proximal; rem=remote; rep=reported; sel=selective; sg=singular; src=source; tr=transitive; vent=ventive.
Free translation


Acknowledgements
We would like to thank all of the Tima speakers we have worked with, some of whom are named in the introduction. We would also like to thank Gerrit J. Dimmendaal, Sharon Rose, Kimiko Tsukada and Rosey Billington for feedback on early presentations of this work, and Richard Beare and Adele Gregory for technical help with various stages of this work. This research was made possible through funding from the Volkswagen Programme DoBeS (Dokumentation bedrohter Sprachen – Documenting Endangered Languages). Research on Tima is currently continued under the umbrella of SFB 1252 (Project-ID 281511265) ‘Prominence in language’, funded by the German Research Foundation (DFG). We would like to thank both institutions for their generous support. Finally, we would like to thank associate editor Matthew Gordon, and two anonymous reviewers. Akwaaɽɘkaat̪aŋ! /á↓kwááɽɘ́káátáŋ/
Supplementary material
To view supplementary material for this article, please visit https://doi.org/10.1017/S0025100323000257


 Open access