

Introduction
Fibre intake has increasingly been recognised as a major factor in the maintenance of human health and contributes to lowering risk for metabolic diseases like type 2 diabetes (T2D) (Reynolds et al., Reference Reynolds, Mann, Cummings, Winter, Mete and Te Morenga2019, Reference Reynolds, Akerman and Mann2020). However, only a small percentage of the general population consumes the recommended fibre amount, a problem known as the fibre gap (Jones, Reference Jones2014). Since most fibres reach the colon in an undigested form, they impact the composition and activity of the gut microbiota. This is highly relevant since specific microbiota signatures are associated with various stages of T2D (De Vos and Nieuwdorp, Reference De Vos and Nieuwdorp2013) mirroring increased insulin resistance in prediabetes and T2D by shifts towards reduced relative abundance of butyrate-producing bacteria (Wu et al., Reference Wu, Tremaroli, Schmidt, Lundqvist, Olsson, Krämer, Gummesson, Perkins, Bergström and Bäckhed2020). A study revisiting several dozens of T2D cohorts revealed a decrease in relative levels of butyrate-producing bacteria and an increase of Blautia, Ruminococcus and Fusobacterium spp. (Gurung et al., Reference Gurung, Li, You, Rodrigues, Jump, Morgun and Shulzhenko2020). Moreover, intake of a complex fibre mixture in Chinese T2D patients improved glucose homeostasis concomitantly with increased levels of butyrate-producing bacteria (Zhao et al., Reference Zhao, Zhang, Ding, Wu, Lam, Wang, Fu, Xue, Lu, Ma, Yu, Xu, Ren, Xu, Xu, Shen, Zhu, Shi, Shen, Dong, Liu, Ling, Zeng, Wang, Zhang, Wang, Wang, Wu, Zeng, Wei, Zhang, Peng and Zhang2018).
The gut microbiota uses fibres as carbon and energy source, resulting in the production of short-chain fatty acids (SCFA), such as acetate, propionate and butyrate. These SCFA not only exert local effects by serving as fuel for colonocytes and interacting with G-protein-coupled receptors (GPRs) but might also enter the systemic circulation, directly interacting with peripheral tissue function and thereby affecting metabolism (Canfora et al., Reference Canfora, Jocken and Blaak2015). Prediabetic subjects receiving colonic infusions of SCFA mixtures at concentrations and ratios reached after fibre intake improved metabolic health parameters particularly when SCFA were administered in the distal colon (Canfora et al., Reference Canfora, van der Beek, Jocken, Goossens, Holst, Olde Damink, Lenaerts, Dejong and Blaak2017; van der Beek et al., Reference van der Beek, Canfora, Lenaerts, Troost, Damink, Holst, Masclee, Dejong and Blaak2016). Such a distal shift in fermentation might also benefit treatment of functional bowel diseases (So et al., Reference So, Gibson, Muir and Yao2021). Consequently, modulating the gut microbiota towards increased SCFA production might offer new therapeutic avenues for metabolic diseases (Canfora et al., Reference Canfora, Jocken and Blaak2015; Fan and Pedersen, Reference Fan and Pedersen2020; Gurung et al., Reference Gurung, Li, You, Rodrigues, Jump, Morgun and Shulzhenko2020).
Especially well-studied fibres are inulin-type fructans (ITF) (Swanson et al., Reference Swanson, De Vos, Martens, Gilbert, Menon, Soto-Vaca, Hautvast, Meyer, Borewicz, Vaughan and Slavin2020), including isolated and purified native inulin from chicory roots. Consumption of ITF is known to stimulate faecal levels of Bifidobacterium spp. (Le Bastard et al., Reference Le Bastard, Chapelet, Javaudin, Lepelletier, Batard and Montassier2019) as well as to contribute to maintaining bowel function, which has resulted in a validated health claim (EFSA, 2015). However, ITF are reported to have a rather limited effect on modulating gut microbiota (Dewulf et al., Reference Dewulf, Cani, Claus, Fuentes, Puylaert, Neyrinck, Bindels, de Vos, Gibson, Thissen and Delzenne2013; Kiewiet et al., Reference Kiewiet, Elderman, El Aidy, Burgerhof, Visser, Vaughan, Faas and de Vos2021) and a moderate to no effect on faecal and circulating SCFA and insulin resistance markers (Chambers et al., Reference Chambers, Viardot, Psichas, Morrison, Murphy, Zac-Varghese, MacDougall, Preston, Tedford, Finlayson, Blundell, Bell, Thomas, Mt-Isa, Ashby, Gibson, Kolida, Dhillo, Bloom, Morley, Clegg and Frost2015, Reference Chambers, Byrne, Morrison, Murphy, Preston, Tedford, Garcia-Perez, Fountana, Serrano-Contreras, Holmes, Reynolds, Roberts, Boyton, Altmann, Mcdonald, Marchesi, Akbar, Riddell, Wallis and Frost2019). A recent study reviewing interventions with ITF, other single fibres and whole grain foods concluded that total faecal SCFA were not impacted (So et al., Reference So, Whelan, Rossi, Morrison, Holtmann, Kelly, Shanahan, Staudacher and Campbell2018). Of note, it has been suggested that consumption of plant and fibre-rich foods would increase fibre-degrading and SCFA-producing gut bacteria (Koponen et al., Reference Koponen, Salosensaari, Ruuskanen, Havulinna, Männistö, Jousilahti, Palmu, Salido, Sanders, Brennan, Humphrey, Sanders, Meric, Cheng, Inouye, Jain, Niiranen, Valsta, Knight and Salomaa2021). While studying the effect of single or purified dietary components is the conventional way to obtain mechanistic insights, this reductionist approach does not take into account that dietary fibres do not exist in isolation in minimally and unprocessed products. They are either part of the plant cell wall (pectin, hemicellulose and cellulose) or encapsulated by it (storage carbohydrates such as inulin), hence termed intrinsic fibres (Augustin et al., Reference Augustin, Aas, Astrup, Atkinson, Baer-Sinnott, Barclay, Brand-Miller, Brighenti, Bullo, Buyken, Ceriello, Ellis, Ha, Henry, Kendall, La Vecchia, Liu, Livesey, Poli, Salas-Salvadó, Riccardi, Riserus, Rizkalla, Sievenpiper, Trichopoulou, Usic, Wolever, Willett and Jenkins2020). This intrinsic structure of fibres is likely to result in a gradual release of fermentable carbohydrates and hence a rather distal intestinal location where SCFA are produced and absorbed (Hansen and Sams, Reference Hansen and Sams2018; So et al., Reference So, Gibson, Muir and Yao2021). We therefore hypothesised that intrinsic fibres substantially increase faecal SCFA levels in the distal colon and possibly affect health differently from purified fibres (Dagbasi et al., Reference Dagbasi, Lett, Murphy and Frost2020; Grundy et al., Reference Grundy, Edwards, Mackie, Gidley, Butterworth and Ellis2016; Hansen and Sams, Reference Hansen and Sams2018).
Previously, we showed that chicory roots have a long history of consumption and contain the highest dry fibre content of edible vegetables, nuts, seeds and fruits (Puhlmann and de Vos, Reference Puhlmann and de Vos2020). In the present study, we aimed to explore the health effects of dried chicory roots that contain approximately 85 % fibre, consisting of native inulin enclosed in plant cell wall fibres (pectin, cellulose and hemicellulose). We assessed the effect of daily dried chicory root intake on bowel function, gut microbiota composition, faecal and circulating SCFA levels, as well as glucose homeostasis markers in subjects at risk of T2D in a randomised, parallel, placebo-controlled, and investigator-blinded trial.
Methods
Participants
Participants were locally recruited in the surroundings of Wageningen University & Research in Wageningen, The Netherlands, between May and September 2018. Participants were eligible if they were between the age of 40–75 years and had either a fasting blood glucose level between 5.0 and 5.6 mmol/L with a high risk to develop type 2 diabetes (T2D) later in life as assessed by a diabetes risk score ≥9 (Alssema et al., Reference Alssema, Feskens, Bakker, Gansevoort, Boer, Heine, Nijpels, Stehouwer, Van Der Kraan and Dekker2008; Lindström and Tuomilehto, Reference Lindström and Tuomilehto2003), or a fasting blood glucose level between 5.6 and 6.9 mmol/L (classified as prediabetes by the American Diabetes Association, 2016). Randomisation was performed by a researcher not involved in the study. Participants were randomly assigned by a third researcher to either the treatment or the placebo group within strata based on sex and fasting glucose level inclusion criteria. History of medical or surgical events that may significantly affect the study outcome, medical drug use for T2D or chronic use of antacids resulted in exclusion from the study. Other exclusion criteria included the use of antibiotics during the three months prior to screening and consumption of pre- or probiotics or any fibre supplement during the last month prior to screening. Participants were also excluded if they reported any unexplained weight loss or weight gain of more than 5 kg in the 1 month prior to the screening, or if they followed a slimming or medically prescribed diet, or a vegan or macrobiotic lifestyle. Finally, any known sensitivity to medical skin adhesives also led to exclusion from participation. In total 156 men and women were screened, whereof 63 participants were eligible and 60 were included in the study.
Study design
The study was a two-arm randomised, placebo-controlled, investigator-blinded, parallel trial. The study consisted of three study periods, a run-in of 2 weeks, an intervention period of 3 weeks and a wash-out of 2 weeks (Figure 1). A detailed description of the study design is given in the Supplemental Methods. The Medical Ethical Review Committee Wageningen University (METC-WU nr. 17/25) approved this study and was registered at the ISRCTN registry (ISRCTN39985847). The authors assert that all procedures contributing to this work comply with the ethical standards of the relevant national and institutional committees on human experimentation and with the Helsinki Declaration of 1975, as revised in 2008.
Trial design of the randomised placebo-controlled parallel trial comparing dried chicory root intake with maltodextrin placebo. Asterisks indicate 3-day period (same weekdays) used for the calculation of continuous glucose monitoring metrics for baseline (T0), run-in (T1) and intervention period (T2). Created with BioRender.com.
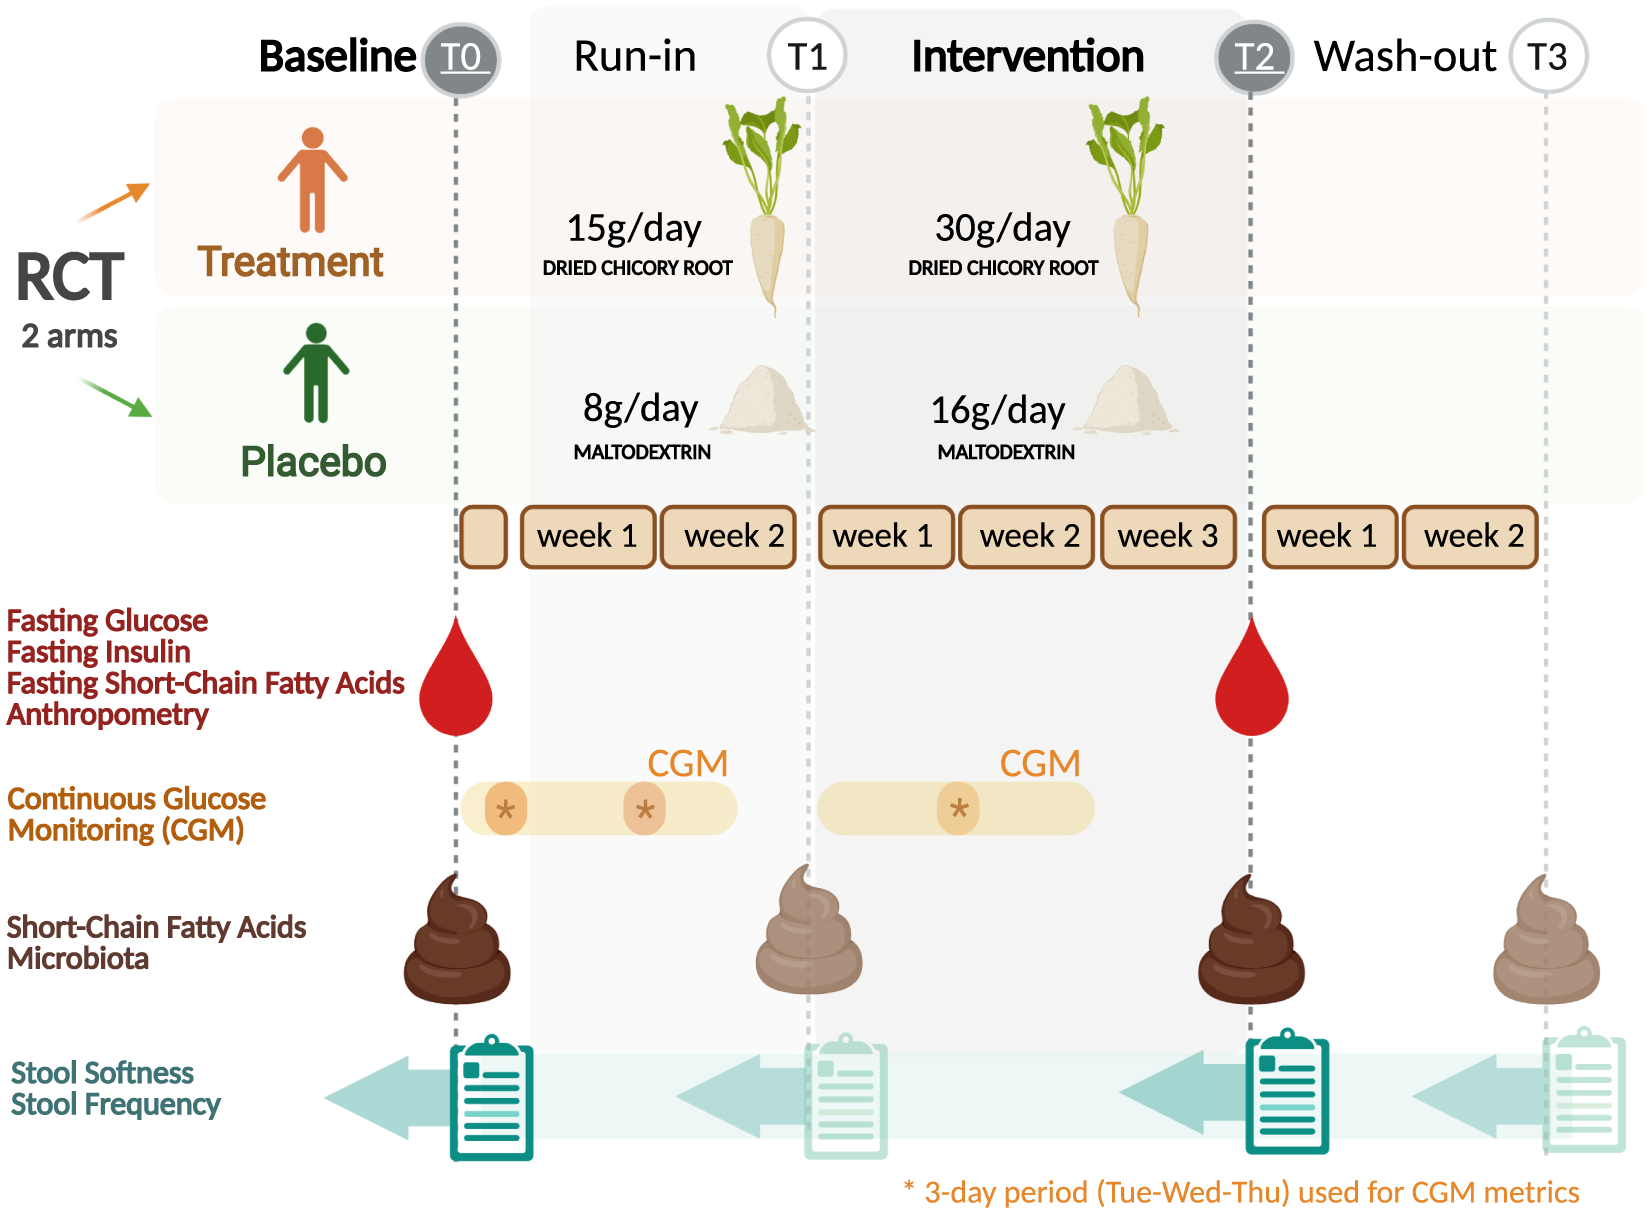
Primary outcomes were defined as changes in the static glycaemic markers HOMA-ir, fasting insulin and fasting glucose after the study period (30 g/day treatment intake; T2) against baseline (T0). Secondary outcomes were differences in changes over time between intervention groups in bowel function assessed by stool softness (Bristol Stool Scale, BSS) (Lewis and Heaton, Reference Lewis and Heaton1997) and stool frequency (defecations per day), gut microbiota composition, faecal and fasting circulating SCFA, and glycaemic variability metrics captured by continuous glucose monitoring (CGM) after the study period (T2) and in addition after the run-in (T1) and the wash-out period (T3).
Intervention products
The treatment product consisted of WholeFiber (provided by WholeFiber BV, The Netherlands), an intrinsic multifibre product made from chicory root that are washed, cut and dried. The dried chicory root product has a dry weight of 93 % (w/w), including 85 % (w/w) fibre, whereof 70 % (w/w) is native inulin, 10 % (w/w) pectin and 5 % (w/w) hemicellulose and cellulose. This treatment product was taken at a daily dose of 30 g for 3 weeks in the treatment group, while the placebo group consumed a daily dose of an iso-caloric amount of 16 g maltodextrin (Body&Fit, The Netherlands). During the run-in period, both groups received half the amount, 15 g of the treatment product and 8 g of the placebo, respectively.
Microbiota composition, in vitro experiments, biochemical analyses and bowel function diaries
Details about the analysis of gut microbiota composition using 16S rRNA amplicon sequencing, synthetic co- and tri-culture experiments, assessment of bowel function (stool softness and frequency), faecal and fasting circulating SCFA, static (fasting insulin, fasting glucose and HOMA-ir), as well as dynamic (CGM) glycaemic markers can be found in the Supplemental Methods and Supplemental Table S1. Gut microbiota data has been submitted to the European Nucleotide Archive (ENA) under accession number PRJEB47230.
Statistical analysis and subgroup segmentation
Data is presented as mean ± SEM if not indicated differently. For the purpose of comparison with other studies, changes were also expressed as percentage change (absolute change divided by baseline value). GraphPad Prism 9.1 and R version 4.0.3 were used to generate corresponding graphics and for statistical analysis applying α = 0.05. Gut microbiota data was analysed using the R package mare (Korpela, Reference Korpela2016). Differences in changes in faecal SCFA, bowel function and CGM metrices were analysed with repeated-measures analyses using the lme4 R package (Bates et al., Reference Bates, Mächler, Bolker and Walker2015) or the rstatix R package (Kassambara, Reference Kassambara2021). Post-intervention differences in plasma biomarkers and others were assessed by analysis of covariance. Sample size calculation, further details on the statistical analyses, on responder analyses and on subgroup segmentation are given in the Supplemental Methods and Supplemental Figure S1.
Results
Baseline characteristics
In total, 58 participants completed the study as two participants dropped out for personal reasons and another three were excluded due to lifestyle changes, protocol violation or missing samples (Supplemental Figure S2). Product intake compliance, assessed by returned empty and leftover sachets, was excellent (96.3 per cent). At baseline, we observed that the placebo and treatment group were well randomised, but the placebo group had slightly softer stools (Table 1). While fasting plasma glucose levels were elevated (f-gluall = 6.0 ± 0.6 mmol/L) according to prediabetes criteria (American Diabetes Association, 2016), overall insulin resistance as assessed by HOMA-ir was relatively low in the study population (HOMA-irall = 1.31 ± 0.61).
Baseline characteristics of all subjects included in the data analysis.

Abbreviations: BSS, Bristol stool score; CV, coefficient of variation assessed by continuous glucose measurement.
Bowel function
First, we wanted to understand how dried chicory root would affect gut function by assessing bowel habits recorded as stool softness and stool frequency. We observed that the treatment had a pronounced effect over time on stool softness (repeated-measures ANOVA interaction: F(3,159) = 2.952, p = 0.034) and stool frequency (Friedman test: χ 2(3) = 22.3, p < 0.001). Stool softness increased by +1.1 ± 0.3 units (BSS; p = 0.034) from 3.3 ± 0.3 to 4.4 ± 0.2 after 3 weeks of 30 g/day treatment (T2), a change that already started after 15 g/day (T1: + 0.6 ± 0.3 BSS, p = 0.072). Of note, stool frequency increased with +0.6 ± 0.2 from 1.3 ± 0.1 to 1.9 ± 0.1 defecations per day after 30 g/day treatment (T2; p = 0.004), an increase that also started at 15 g/day (T1: +0.2 ± 0.1×/day, p = 0.038). In contrast, in the placebo stool softness remained constant with 4.1 ± 0.2 at baseline, 4.3 ± 0.2 after run-in (T1; p = 0.69) and 4.2 ± 0.2 after study period (T2; p = 0.69). Similar, stool frequency remained constant with 1.2 ± 0.1 defecations/day at baseline and 1.3 ± 0.2 after run-in (T1; p = 0.347) and 1.3 ± 0.1 study period (T2; p = 0.582). For both groups, stool softness and frequency returned to baseline levels after 2 weeks wash-out (T3 treatment: BSS = 3.5 ± 0.2, stool frequency = 1.2 ± 0.1 and placebo: BSS = 4.1 ± 0.2, stool frequency = 1.3 ± 0.1). These increasing changes in bowel function over time and related fibre dosages indicated a substantial modulatory potential of dried chicory roots on the colonic environment.
Gut microbiota composition
To understand the effect of dried chicory root intake on the gut microbes, we then assessed the overall faecal microbiota composition as well as changes in the relative abundance of individual genera. We observed a strong modulatory effect of the treatment product on overall gut microbiota composition assessed by Bray–Curtis β-diversity (Figure 2A–D), which in this context reflects the between-person differences in gut microbiota composition. Already after 2 weeks of 15 g/day treatment (T1; Figure 2B), overall gut microbiota composition of the treatment and placebo shifted apart, finally explaining 7 % (Permutational multivariate analysis of variance (PERMANOVA), p = 0.001) of the observed variation in microbial composition after 3 weeks of 30 g/day treatment (T2; Figure 2C). Interestingly, this effect was fully reversible as overall gut microbiota composition returned to baseline once subjects had stopped for 2 weeks with the treatment (wash-out; T3, Figure 2D). The overall compositional changes by the treatment were mirrored in the change of several taxa at genus level (Figure 2E). We observed the most pronounced changes in the stimulation of relative levels of Anaerostipes and Bifidobacterium spp. (Figure 2E and Supplemental Figure S3). Of these genera, the most abundant species were identified as A. hadrus and A. butyraticus as well as B. longum and an unclassified Bifidobacterium species. After 2 weeks of 15 g/day treatment (T1) the relative abundance of Anaerostipes spp. increased already by 2.82-fold (q < 0.001, Supplemental Table S2) reaching levels twice as high as placebo (T1: treatment = 3.7 % vs. placebo = 1.6 %, q < 0.001; Supplemental Table S3). After 30 g/day treatment Anaerostipes spp. relative abundance increased 3.24-fold (T2, q < 0.001; Supplemental Table S2) to levels three times higher than placebo (treatment = 4.3 % vs. placebo = 1.4 %, q < 0.001; Supplemental Table S3). In addition, Bifidobacterium spp. relative abundance increased 3.17-fold after 15 g/day treatment (T1, q < 0.001) and 4.09-fold after 30 g/day treatment (T2, q < 0.001; Supplemental Table S2) to a relative level of 13.0 %, which was also three times higher than placebo (T2: placebo = 4.5 %, q = 0.002; Supplemental Table S3). We also observed several taxa to decrease in relative abundance after treatment intake (Figure 2E and Supplemental Table S2), notably Blautia spp. of which the most abundant human species were identified as B. hominis, B. luti, and B. obeum. None of these changes were observed in the placebo group after run-in or study (q > 0.05, Supplemental Table S4) and no taxa differed between the groups after the washout (T3; Supplemental Table S3). In summary, the modulation of the overall gut microbiota composition and concomitant changes in relative abundance of specific taxa were dose-dependent and reversible.
(A–D) Effect of dried chicory root consumption on overall gut microbiota composition [β-diversity, assessed by principal coordinates analysis (PCoA) with Bray–Curtis dissimilarity] at baseline (T0) after 2 weeks of 15 g/day treatment or iso-caloric placebo (T2), 3 weeks of 30 g/day treatment or iso-caloric placebo (T2) and after 2 weeks of wash-out (T3). No changes in α-diversity measures were observed, which reflects the within-person variation in microbiota composition by measuring the number (richness) of different bacterial taxa and their distribution (evenness) within a sample. (E) Gut microbiota composition at baseline (T0), 15 g/day treatment or iso-caloric placebo (T1), 30 g/day treatment or iso-caloric placebo (T2) and washout (T3). We observed a significant increase (↑) of Bifidobacterium spp. and Anaerostipes spp. at T1 and T2 in the treatment group and a significant decrease (↓) of Blautia spp. at T2. None of the taxa in the placebo group changed significantly between any of the timepoints. (F) Synthetic co- and tri-culture experiments. Metabolite production and consumption in a tri-culture containing Bacteroides xylanisolvens (B. xylanisolvens), Bifidobacterium animalis subsp. lactis BLC1 (B. animalis BLC1) and Anaerostipes rhamnosivorans 1y2T (A. rhamnosivorans) incubated with the treatment product consisting of dried chicory roots (5 g/L in YCFA) (Duncan et al., Reference Duncan, Louis, Thomson and Flint2009). Mean values are shown with standard deviation after 7 days incubation at 37°C but 80 % of the conversion was already completed after 3 days of incubation (not shown). (G) Postulated microbial and metabolic interaction network involved in the colonic fermentation of the dried chicory roots (predominantly consisting of inulin, pectin and hemicellulose and cellulose). Proposed conversion by Bacteroides spp. is presented in green, by Bifidobacterium spp. in blue and by Anaerostipes spp. in red. The treatment product, dried chicory roots, consists of plant cells, which are envisaged to be degraded and liberate the intermediate products inulin, pectin and small sugars (like fructo-oligosaccharides) that are further converted into the end products (highlighted in orange) including propionate or butyrate via the intermediate products lactate and acetate.

Trophic chain in vitro experiment
To demonstrate that the observed changes in relative faecal abundances of both Bifidobacterium and Anaerostipes spp. after chicory root intake were associated with a trophic chain involving these two functional bacterial groups, we performed in vitro experiments with synthetic co- and tri-cultures as a proof-of-concept (Figure 2F). For this purpose, we selected strains with the canonical functionality to convert inulin or ITF into lactate and acetate (Bifidobacterium spp.) and the capacity to convert these further into butyrate (Anaerostipes spp.). We incubated the treatment product at a concentration of 5 g/L with the well-studied B. animalis BLC1 (Bottacini et al., Reference Bottacini, Dal Bello, Turroni, Milani, Duranti, Foroni, Viappiani, Strati, Mora, van Sinderen and Ventura2011) and A. rhamnosivorans 1y2T (Bui et al., Reference Bui, de Vos and Plugge2014) and found a modest but reproducible increase of butyrate (1.19 ± 0.39 mM). Hence, we anticipated the need for the degradation of the plant cell wall fibres present in the treatment product, which is a known metabolic feature of the abundant gut bacteria Bacteroides and Prevotella spp. (Martens et al., Reference Martens, Lowe, Chiang, Pudlo, Wu, McNulty, Abbott, Henrissat, Gilbert, Bolam and Gordon2011). Therefore, we also included Bacteroides xylanisolvens HMP, a known pectin degrader (Despres et al., Reference Despres, Forano, Lepercq, Comtet-Marre, Jubelin, Yeoman, Miller, Fields, Terrapon, Bourvellec, Renard, Henrissat, White and Mosoni2016) in a co-culture experiment with only B. animalis BLC1 and in a tri-culture experiment with also A. rhamnosivorans 1y2T. Only when using this latter tri-culture, we observed the production of high amounts of butyrate (19.5 ± 2.0 mM; Figure 2F), representing over half of the amount that dried chicory roots potentially may provide. Hence, this proof-of-concept experiment showed that assisted by a pectin-degrader, such as the selected Bacteroides strain, a butyrogenic trophic chain was formed from the dried chicory root involving representative members of Bifidobacterium and Anaerostipes spp.
Faecal SCFA
We then assessed the impact of dried chicory root on faecal SCFA levels as a measure of gut microbiota activity. Total faecal SCFA levels increased by 13.02 ± 02 mmol/kg after 30 g/day treatment for 3 weeks, a relative increase of +25.7 % which was reflected in all three SCFA (T2; Table 2). Using linear mixed modelling we confirmed that faecal SCFA levels pronouncedly changed from placebo (p = 0.023, interaction term intervention*period) during 30 g/day treatment (T2, Table 2; estimated model fixed effects are provided in Supplemental Table S6). The increase in acetate levels (p = 0.022) was highest with a relative change of +28.3 % followed by increased propionate levels by +22.3 % and butyrate levels by +19.6 % (T2: p = 0.065 and p = 0.052, respectively; Table 2). The increase in faecal SCFA levels started already after 15 g/day treatment (T1; Table 2). The mean levels of faecal butyrate in the treatment group increased most at T1 by +25.8 % compared to 19.6 % at T2 (Table 2). However, the proportion of subjects with an increase in faecal butyrate levels (minimal observed increase > 1 mM) was actually highest at T2 (18 out of 28) and differed from that in the placebo (9 out of 27; Fisher’s exact: p = 0.015, Supplemental Figure S4). Overall, faecal SCFA levels in the placebo slightly decreased (Table 2). Once treatment intake stopped, faecal SCFA levels returned to baseline (T3, Table 2). Hence, dried chicory root also modulated gut microbiota activity and increased faecal SCFA levels in a reversible way.
Levels and changes of faecal short-chain fatty acid levels at baseline (T0), after 2 weeks of 15 g/day treatment or 8 g/day iso-caloric placebo intake (T1), after 3 weeks of 30 g/day treatment or 16 g/day iso-caloric placebo intake (T2), and after 2 weeks of wash-out (T3). a

Abbreviation: SCFA, short-chain fatty acids.
a Data is presented as mean (SEM). Analysis was done by linear mixed model that assessed whether the change (∆) in SCFA over intervention periods by the treatment was different from placebo (represented by the interaction term: intervention × period). All estimated model fixed effects are provided in Supplemental Table S6. Analysis of post-intervention differences between groups at T2 only are provided in Supplemental Table S7.
Fasting circulating SCFA
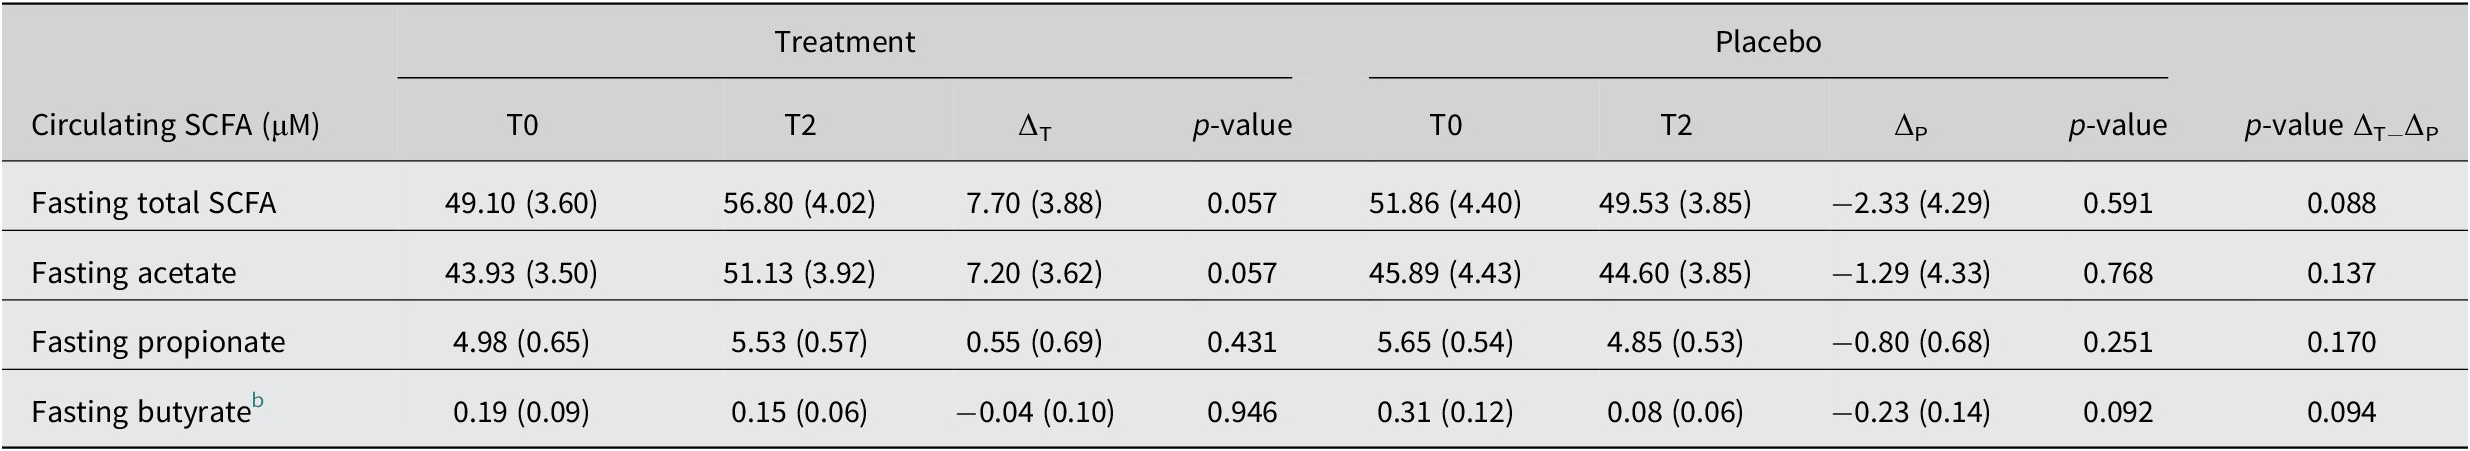
To determine the effect of the increased faecal SCFA on the systemic availability of these metabolites, we also measured fasting circulating SCFA at the end of the study period with 30g/day treatment intake. We observed an increase after 30 g/day treatment in total fasting circulating SCFA of 7.70 ± 3.88 μM (T2; p = 0.057), which represents a relative change over baseline of +15.7 % and was a result of both increased fasting acetate (+16.4 %; p = 0.057) and propionate levels (11.1%; p = 0.431, Table 3). The placebo remained largely unchanged, with total fasting circulating SCFA slightly decreasing (−4.5 %; p = 0.591, Table 3), while the changes did not differ between groups (Table 3). Fasting butyrate levels decreased in the placebo group about five times more than in the treatment group, where the levels remained virtually unchanged (Table 3). Comparing adjusted post-intervention levels we found an increase in total SCFA by the treatment against placebo of +8.56 ± 4.97 μM (p = 0.091), for acetate of +7.47 ± 4.85 μM (p = 0.129), for propionate of +0.85 ± 0.76 μM (p = 0.266) and for butyrate of +0.06 ± 0.08 μM (p = 0.451; see also Supplemental Table S7). Hence, the treatment with dried chicory root also resulted in systemic effects.
Fasting circulating SCFA levels at baseline (T0), after 3 weeks of 30 g/day treatment or 16 g/day iso-caloric placebo intake (T2) and change (∆) over baseline. a
Abbreviation: SCFA, short-chain fatty acids.
a Data is presented as mean (SEM).
b Butyrate levels were analysed using nonparametric testing.
Static and dynamic markers of glucose homoeostasis
Finally, we wanted to understand whether metabolic markers of glucose homeostasis were affected by the intake of dried chicory root. First, we assessed the static markers HOMA-ir, fasting insulin and fasting glucose at the end of the 30 g/day treatment compared to baseline. HOMA-ir decreased from 1.28 ± 0.12 to 1.24 ± 0.09 after 30 g/day treatment (p = 0.566), a relative decrease over baseline by −3.1 %. Similarly, insulin decrease slightly by −2.4 % (−0.19 ± 0.50 μU/mL, p = 0.710) and fasting glucose by −2.1 % (−0.13 ± 0.08 mmol/L, p = 0.637). Yet, none of these changes differed from those in placebo (Supplemental Table S8). Comparing adjusted post-intervention levels between groups, we found a decrease in HOMA-ir against placebo of −0.05 ± 0.09 (p = 0.570), which was mirrored in fasting insulin (−0.32 ± 0.6 μU/mL, p = 0.597) but absent in fasting glucose (−0.02 ± 0.12 mmol/L, p = 0.877; Supplemental Table S7).
In recent years continuous glucose monitoring (CGM) has been developed to provide clinically relevant and dynamic insights into glucose profiles next to static biomarkers (Danne et al., Reference Danne, Nimri, Battelino, Bergenstal, Close, DeVries, Garg, Heinemann, Hirsch, Amiel, Beck, Bosi, Buckingham, Cobelli, Dassau, Doyle, Heller, Hovorka, Jia, Jones, Kordonouri, Kovatchev, Kowalski, Laffel, Maahs, Murphy, Nørgaard, Parkin, Renard, Saboo, Scharf, Tamborlane, Weinzimer and Phillip2017). Hence, we also monitored continuous glucose levels at baseline, during run-in and during the study period on three consecutive days to understand the development of glycaemic control over the intervention, as assessed by the coefficient of variation (CV) of glucose levels (Danne et al., Reference Danne, Nimri, Battelino, Bergenstal, Close, DeVries, Garg, Heinemann, Hirsch, Amiel, Beck, Bosi, Buckingham, Cobelli, Dassau, Doyle, Heller, Hovorka, Jia, Jones, Kordonouri, Kovatchev, Kowalski, Laffel, Maahs, Murphy, Nørgaard, Parkin, Renard, Saboo, Scharf, Tamborlane, Weinzimer and Phillip2017; Peyser et al., Reference Peyser, Balo, Buckingham, Hirsch and Garcia2018). We observed that the CV decreased from 21.3 ± 0.94 % at baseline to 18.1 ± 0.97 % during run-in (p = 0.001) and 18.3 ± 0.84 % in the study period (p = 0.004) in the treatment group. The CV also decreased to a lower extent in the placebo group from 20.6 ± 1.07 % to 18.7 ± 1.00 % (run-in, p = 0.026) and 18.9 ± 0.86 % (study, p = 0.065; Supplemental Figure S5), yet following a sensitivity analysis only the decreases in the treatment group was sustained (run-in p = 0.018 and study p = 0.024; Figure 3A and Supplemental Methods). These observations indicated that dried chicory root intake had the capacity to improve the dynamics of glucose levels over time.
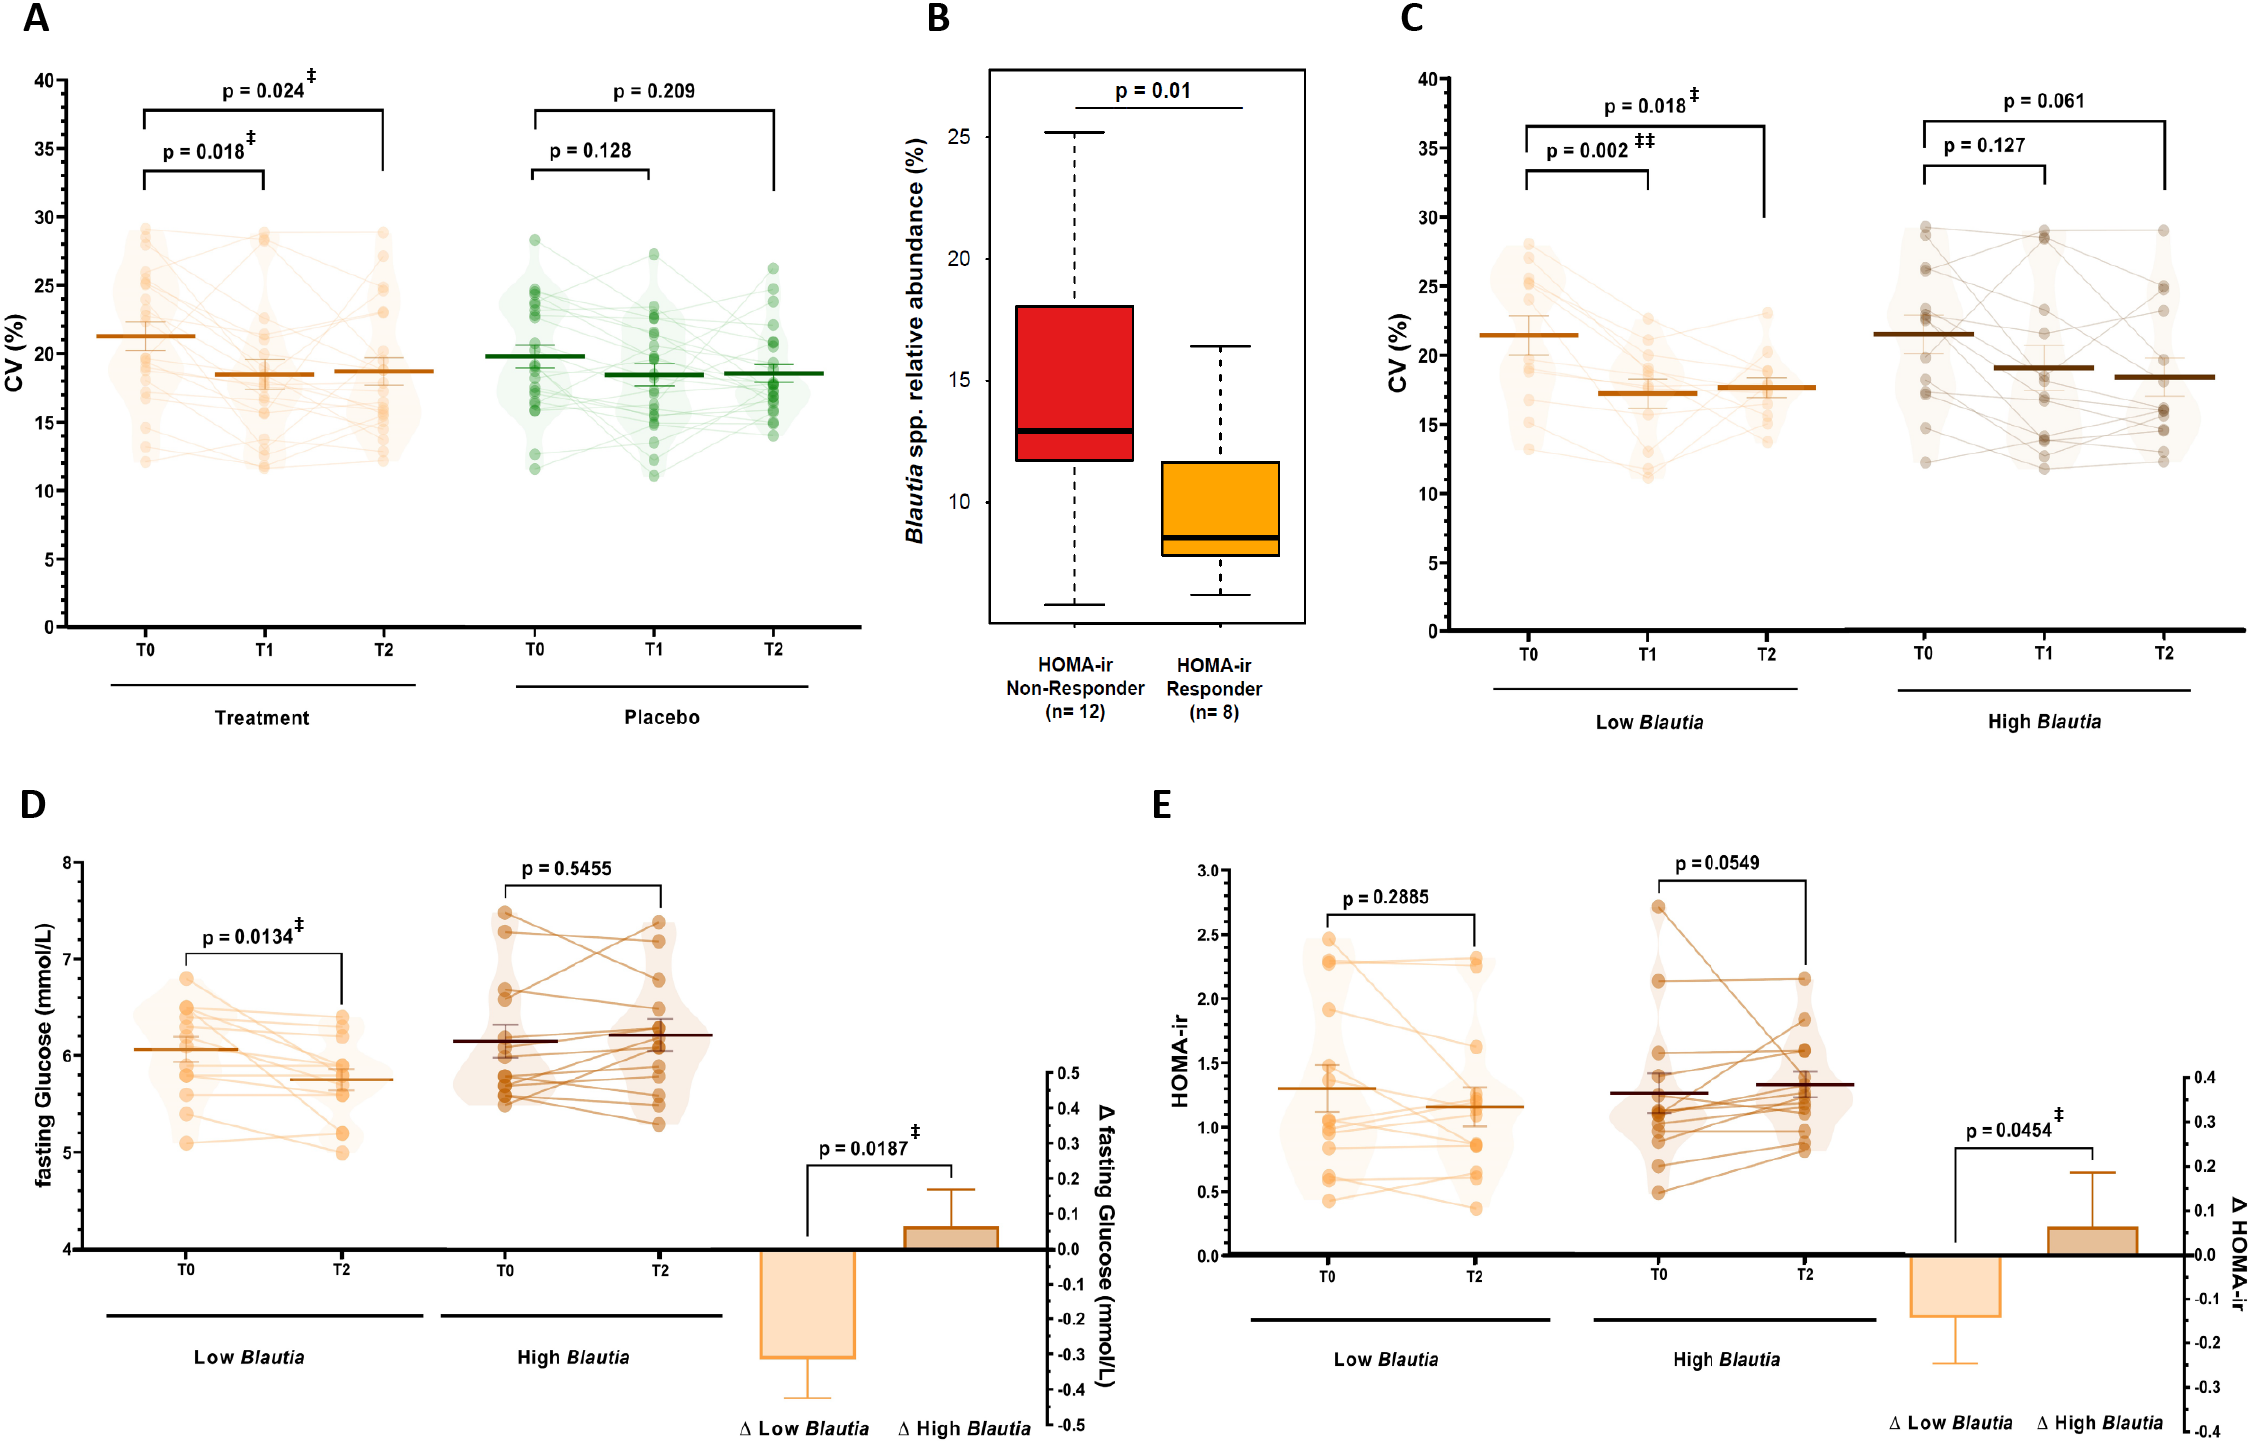
(A). Coefficient of variation (CV%) as a measure of glycaemic control assessed using continuous glucose measurement on three same consecutive weekdays during baseline (T0), the run-in period (T1) with 15 g/day treatment or 8 g/day iso-caloric placebo, and during the study period (T2) with 30 g/day treatment or 16 g/day isocaloric placebo (repeated-measures ANOVA with main effect of period p = 0.001, post-hoc tests with FDR-adjustment). Data is presented after sensitivity analysis excluding datasets with more than 20 % missing data and an extreme outlier (3 × IQR) for treatment (n = 22) and placebo group (n = 24). No difference between groups in baseline CV was observed before (p = 0.55) and after sensitivity analysis (p = 0.25). (B) Difference in relative abundance of Blautia spp. at baseline (T0) between HOMA-ir Responders (>10 % decrease, n = 8) and Non-Responders (>10 % increase) (C–E) Differences in changes in subjects with low (n = 14) or high (n = 14) baseline Blautia spp. relative abundance in the treatment group in (C) CV% as a measure of glycaemic control (low n = 13, high n = 14; repeated-measures ANOVA with main effect of period p < 0.001, post-hoc tests with FDR-adjustment), (D) fasting glucose levels and (E) HOMA-ir as glucose homeostasis markers (assessed using non-parametric testing). ‡p < 0.05, ‡‡p < 0.01.
Effect of baseline Blautia spp. relative abundance on T2D biomarkers
Besides the general effect of dried chicory root on glucose homeostasis in subjects at risk of T2D, we wanted to understand how the gut microbiota potentially impacts changes in the biomarkers of glycaemic control. Hence, we further investigated the glucose homeostasis response by dividing the treatment group into HOMA-ir responders (>10 % decrease HOMA-ir, n = 8) and non-responders (>10 % increase HOMA-ir, n = 12). The most discriminative genus included acetogenic Blautia spp. and at baseline HOMA-ir responders had significantly lower relative Blautia spp. amounts (1.4-fold lower; p = 0.01, Figure 3B). Consequently, we segmented the intervention group based on median baseline abundance of Blautia spp. into low (n = 14) and high abundance (n = 14). Remarkably, we observed a decrease in fasting glucose levels of −5.1 % (−0.31 ± 0.11 mmol/L, p = 0.013) in the low Blautia group, while the high Blautia group remained unchanged (0.06 ± 0.10 mmol/L, p = 0.546) leading to a difference between groups of 0.38 ± 0.15 mmol/L (p = 0.019; Figure 3D). Following up on this observation, we also observed HOMA-ir decreased more pronouncedly with −10.8 % (−0.14 ± 0.10 HOMA-ir, p = 0.289) compared to the high Blautia group (+0.07 ± 0.12 HOMA-ir, p = 0.055), resulting in a difference of 0.21 ± 0.16 between groups (p = 0.045; Figure 3E). Similarly, fasting insulin levels decreased with −9.9 % (−0.82 ± 0.65 low Blautia vs. 0.45 ± 0.75 μU/mL high Blautia; p = 0.210; Supplemental Table S9).
Of note, segmenting subjects into those with low Blautia spp. baseline levels also led to even more pronounced effects on glucose variability and fasting circulating SCFA. Glucose variability decreased in the low Blautia group from 21.3 ± 1.3 to 17.1 ± 1.0 % in run-in (p = 0.002) and 17.7 ± 0.8 % during the study (p = 0.018), while in the high Blautia group this decrease was more gradual from 21.4 ± 1.4 to 19.0 ± 1.6 % in run-in (p = 0.127) and 18.3 ± 1.4 % during the study period (p = 0.061; Figure 3C). Total fasting circulating SCFA increased by +22.7 % nearly three-times more in the low Blautia group (+11.66 ± 5.64 μM; p = 0.059) compared to +8.0 % in the high Blautia group (+3.75 ± 5.32 μM; p = 0.493), which was associated with a higher increase in fasting acetate levels in the low Blautia (+10.26 ± 5.00 μM, p = 0.061) vs. the high Blautia group (+4.13 ± 5.30 μM, p = 0.450; Supplemental Figure S6A,B). Interestingly, fasting propionate levels increased only in the low Blautia group by +27.0 % (+1.39 ± 1.16 μM, p = 0.252) and fasting butyrate levels remained unchanged (−0.01 ± 0.9 μM, p = 0.688) while in the high Blautia group fasting propionate (−0.29 ± 0.73 μM, p = 0.702) and butyrate levels slightly decreased (−0.08 ± 0.19 μM, p = 0.813; Supplemental Figure S6C,D). Hence, modulation of metabolic markers by the dried chicory root intake was observed to relate to differences in the baseline abundance of gut bacteria.
Discussion
We examined the effect of an intrinsic, high-fibre product based on dried chicory roots, consisting of native inulin, pectin, hemicellulose and cellulose embedded in plant cells, in adults at risk of T2D. We observed a significant and strong dose-dependent and reversible effect of the treatment on improved bowel function, microbiota composition and activity as well as noted improvement of dynamic glucose levels measured by CGM.
Purified native inulin is thought to stimulate bacterial growth in the colon, which leads to increased bacterial mass and faecal bulk, and is hence well-known for its positive effect on bowel function maintenance (EFSA, 2015). Here we observed that both stool softness and stool frequency increased after 15 g/day and further after 30 g/day dried chicory root treatment and returned to baseline levels after the wash-out, indicating a time- and dose-dependent effect of the treatment on the colonic environment by the intrinsic fibres, that by definition include native inulin within the plant cell walls.
Modulation of the gut microbiota towards the stimulation of taxa that are associated with health benefits forms the basis for prebiotic interventions (Gibson et al., Reference Gibson, Hutkins, Sanders, Prescott, Reimer, Salminen, Scott, Stanton, Swanson, Cani, Verbeke and Reid2017). Two well-known genera in this context are Bifidobacterium and Anaerostipes spp., which have been reported to be slightly increased (approximately 1.2–1.4-fold) following intake of isolated, purified ITF (Vandeputte et al., Reference Vandeputte, Falony, Vieira-Silva, Wang, Sailer, Theis, Verbeke and Raes2017). However, the strong overall modulation of the gut microbiota (Figure 2A–D) and the more than three-fold increase in both Bifidobacterium and Anaerostipes spp. we observed here (Figure 2E), is remarkable and much higher compared to earlier ITF studies. Especially in subjects with low baseline abundance of these genera, we observed an increase by up to 11.55-fold for Bifidobacterium and 6.12-fold for Anaerostipes spp. after 30 g/day treatment (Supplemental Table S5). One study in healthy subjects consuming inulin-rich foods instead of purified ITF for 2 weeks also observed a four-fold increase in Bifidobacterium spp. but no changes in Anaerostipes spp. (Hiel et al., Reference Hiel, Bindels, Pachikian, Kalala, Broers, Zamariola, Chang, Kambashi, Rodriguez, Cani, Neyrinck, Thissen, Luminet, Bindelle and Delzenne2019). The high co-occurring fold-changes observed with the dried chicory roots point towards an improvement of the trophic chain involving bacteria of these two genera. Several Bifidobacterium spp., including the here identified B. longum, are known to use inulin and ITF, generating acetate and lactate (Falony et al., Reference Falony, Lazidou, Verschaeren, Weckx, Maes and De Vuyst2009; Flint et al., Reference Flint, Scott, Duncan, Louis and Forano2012). These metabolites are proven substrates for butyrate production by all known Anaerostipes species such as the here detected A. hadrus and A. butyraticus (Allen-Vercoe et al., Reference Allen-Vercoe, Daigneault, White, Panaccione, Duncan, Flint, O’Neal and Lawson2012; Bui et al., Reference Bui, Schols, Jonathan, Stams, de Vos and Plugge2019, Reference Bui, Mannerås-Holm, Puschmann, Wu, Troise, Nijsse, Boeren, Bäckhed, Fiedler and DeVos2021). Butyrate production is a desired feature of microbial fibre degradation since this SCFA is known to maintain gut homeostasis, for example by serving as energy source for colonocytes (Canfora et al., Reference Canfora, Jocken and Blaak2015). However, the plant cell walls might shield inulin from utilisation by these two genera. To assess the possibility of a trophic chain from the dried chicory root we performed a proof-of-concept experiment using a minimal set of strains with the canonical functionality of the genera of interest. We needed to include a pectin-utilizer like Bacteroides xylanisolvens HMP (Despres et al., Reference Despres, Forano, Lepercq, Comtet-Marre, Jubelin, Yeoman, Miller, Fields, Terrapon, Bourvellec, Renard, Henrissat, White and Mosoni2016) to fully unlock the potential of the dried chicory roots in vitro. Bacteroides spp. as well as Prevotella spp. are known degraders of plant cell wall fibres (Martens et al., Reference Martens, Lowe, Chiang, Pudlo, Wu, McNulty, Abbott, Henrissat, Gilbert, Bolam and Gordon2011) that may partially degrade and thereby open up the plant cells, and both genera were are found to be abundantly present in faecal samples (Figure 2E and Supplemental Figure S3). Using the synthetic tri-culture consisting of selected strains of Bacteroides, Bifidobacterium and Anaerostipes spp., we indeed observed a substantial increase in butyrate (Figure 2F), for which the presence of A. rhamnosivorans was essential as it consumed lactate and acetate generated by Bacteroides spp. and Bifidobacterium spp. and in small amounts present in the YCFA medium (Duncan et al., Reference Duncan, Louis, Thomson and Flint2009). It is possible that Anaerostipes spp. may even form propionate from a small amount of inositol in chicory (Hernández-Hernández et al., Reference Hernández-Hernández, Ruiz-Aceituno, Sanz and Martínez-Castro2011) that is converted via the recently discovered metabolic pathway in A. rhamnosivorans and some other Anaerostipes spp. (Bui et al., Reference Bui, Mannerås-Holm, Puschmann, Wu, Troise, Nijsse, Boeren, Bäckhed, Fiedler and DeVos2021). Based on these proof-of-concept in vitro simulations, we propose a multi-species microbial network, operating in the colon of the subjects consuming dried chicory roots, that generates butyrate and propionate (Figure 2G).
Fibre-derived colonic SCFA that subsequently enter the systemic circulation are believed to contribute to the preventive effect of fermentable fibres on metabolic diseases (Canfora et al., Reference Canfora, Jocken and Blaak2015). Here, we observed that intake of dried chicory root can increase all three SCFA, that is acetate, propionate and butyrate, by more than a quarter of their baseline levels (Table 2), which is much higher than previously reported in studies with purified ITF. Most ITF studies detected small or no differences (Baxter et al., Reference Baxter, Schmidt, Venkataraman, Kim, Waldron and Schmidt2019; Kiewiet et al., Reference Kiewiet, Elderman, El Aidy, Burgerhof, Visser, Vaughan, Faas and de Vos2021; Vandeputte et al., Reference Vandeputte, Falony, Vieira-Silva, Wang, Sailer, Theis, Verbeke and Raes2017) or even a decrease in faecal SCFA (Salazar et al., Reference Salazar, Dewulf, Neyrinck, Bindels, Cani, Mahillon, de Vos, Thissen, Gueimonde, de los Reyes-Gavilán and Delzenne2015). One trial reported an increase in all three SCFA after 6 weeks of 16 g/day ITF supplementation by a total of about one sixth over baseline levels (Birkeland et al., Reference Birkeland, Gharagozlian, Birkeland, Valeur, Måge, Rud and Aas2020). However, the reported mean increase in butyrate was 15 %, which is lower than the here found increase by more than 19 % (Table 2) and the higher proportion of subjects with faecal butyrate increase (p = 0.015). Interestingly, the subjects in the trial already had a high baseline fibre intake of 32.2 g/day in contrast to that in our study (22.8 ± 7.9 g fibre/day, Table 1). Another trial using mainly whole foods instead of purified fibres to increase fibre intake did not detect changes in faecal SCFA levels after 2 weeks of 40–50 g/day fibre intake (Oliver et al., Reference Oliver, Chase, Weihe, Orchanian, Riedel, Hendrickson, Lay, Sewall, Martiny and Whiteson2021). In the placebo group faecal SCFA levels slightly decreased (Table 2), an observation reported also in other fibre studies (Birkeland et al., Reference Birkeland, Gharagozlian, Birkeland, Valeur, Måge, Rud and Aas2020; Chambers et al., Reference Chambers, Byrne, Morrison, Murphy, Preston, Tedford, Garcia-Perez, Fountana, Serrano-Contreras, Holmes, Reynolds, Roberts, Boyton, Altmann, Mcdonald, Marchesi, Akbar, Riddell, Wallis and Frost2019; Deroover et al., Reference Deroover, Vázquez-Castellanos, Vandermeulen, Luypaerts, Raes, Courtin and Verbeke2021). Faecal SCFA levels are a reflection of the balance between SCFA production, uptake and potential use by colonocytes (Canfora et al., Reference Canfora, Jocken and Blaak2015). Isolated, purified inulin is a chemically and physically simple polymer, readily fermentable in the proximal colon (Flint et al., Reference Flint, Scott, Duncan, Louis and Forano2012). In contrast, in dried chicory roots the microbial degradation of native inulin and other fibres into SCFA is potentially slowed down due to the enclosure within plant cells, resulting in a gradual release (Puhlmann and de Vos, Reference Puhlmann and de Vos2020). Therefore, we hypothesise that dried chicory root fermentation was shifted towards a more distal location leading to a higher recovery of faecal SCFA as compared to purified ITF (Dagbasi et al., Reference Dagbasi, Lett, Murphy and Frost2020; Hansen and Sams, Reference Hansen and Sams2018). The physical location of SCFA uptake in the colon appears to be critical for metabolic health markers favouring a distal above a proximal SCFA uptake (van der Beek et al., Reference van der Beek, Canfora, Lenaerts, Troost, Damink, Holst, Masclee, Dejong and Blaak2016). Hence, such a shift in location of SCFA production could impact circulating SCFA levels and might be a distinguishing and desired therapeutic feature of intrinsic fibre products (Canfora et al., Reference Canfora, Jocken and Blaak2015; Müller et al., Reference Müller, Hernández, Goossens, Reijnders, Holst, Jocken, van Eijk, Canfora and Blaak2019; So et al., Reference So, Gibson, Muir and Yao2021; van der Beek et al., Reference van der Beek, Canfora, Lenaerts, Troost, Damink, Holst, Masclee, Dejong and Blaak2016).
The effect of SCFA reaching the systemic circulation is not often reported in fibre studies. Systemically available SCFA are ligands to GPR41 and GPR43 expressed on various organs involved in T2D aetiology (Canfora et al., Reference Canfora, Jocken and Blaak2015). Intriguingly, circulating rather than faecal SCFA have been related to markers of insulin sensitivity (Müller et al., Reference Müller, Hernández, Goossens, Reijnders, Holst, Jocken, van Eijk, Canfora and Blaak2019) pointing towards a potential benefit of increasing their levels. We observed that besides faecal SCFA, the intake of dried chicory root also increased fasting circulating SCFA by more than 14 % compared to placebo (Table 3). In contrast, a 7-week cross-over trial in overweight subjects with inulin and inulin-propionate reported lower total fasting SCFA (−9.0 %), acetate (−9.9 %) and butyrate (−9.1 %) levels than the cellulose-control, while propionate (+6.7 %) levels were higher (Chambers et al., Reference Chambers, Byrne, Morrison, Murphy, Preston, Tedford, Garcia-Perez, Fountana, Serrano-Contreras, Holmes, Reynolds, Roberts, Boyton, Altmann, Mcdonald, Marchesi, Akbar, Riddell, Wallis and Frost2019). Interestingly, a recent 4-week parallel trial with reduced sized wheat bran particles instead of purified fibre in subjects with obesity only showed a normalisation of circulating SCFA to levels of normal weight subjects but no effects on faecal microbiota or health parameters (Deroover et al., Reference Deroover, Vázquez-Castellanos, Vandermeulen, Luypaerts, Raes, Courtin and Verbeke2021). This contrasts strongly with our observations and although the nature of the subjects, fibre type and structure differ between the trials, it suggests that gut microbiota changes are prerequisite for SCFA-mediated health-promoting effects of dietary fibre modulations.
In view of the pronounced changes in faecal microbiota and metabolites, we observed only subtle changes in static glucose homeostasis markers (Supplemental Table S8). In another parallel, but longer, 24-week trial in overweight subjects, HOMA-ir decreased over baseline by −14.8 % (from 2.7 to 2.3), fasting insulin by −7.8 %, and fasting glucose by −2.0 % after ITF consumption (Chambers et al., Reference Chambers, Viardot, Psichas, Morrison, Murphy, Zac-Varghese, MacDougall, Preston, Tedford, Finlayson, Blundell, Bell, Thomas, Mt-Isa, Ashby, Gibson, Kolida, Dhillo, Bloom, Morley, Clegg and Frost2015). However, these levels did also not differ from baseline, and no non-fermentable placebo was included. A 7-week cross-over design in overweight and obese patients found a post-intervention difference between ITF and cellulose-control of 1.17 versus 1.59 in HOMA-ir and 9.0 μU/mL versus 12.3 μU/mL in fasting insulin without differences in fasting glucose levels (Chambers et al., Reference Chambers, Byrne, Morrison, Murphy, Preston, Tedford, Garcia-Perez, Fountana, Serrano-Contreras, Holmes, Reynolds, Roberts, Boyton, Altmann, Mcdonald, Marchesi, Akbar, Riddell, Wallis and Frost2019). In comparison to the static plasma glucose and insulin concentrations that represent rather a snapshot than a dynamic response, we observed that the CV as a measure of glucose variability decreased during run-in and the study period below 20 % (Figure 3A). Glucose variability assessed by CGM has developed into an important clinical variable besides traditional glycaemic markers (Danne et al., Reference Danne, Nimri, Battelino, Bergenstal, Close, DeVries, Garg, Heinemann, Hirsch, Amiel, Beck, Bosi, Buckingham, Cobelli, Dassau, Doyle, Heller, Hovorka, Jia, Jones, Kordonouri, Kovatchev, Kowalski, Laffel, Maahs, Murphy, Nørgaard, Parkin, Renard, Saboo, Scharf, Tamborlane, Weinzimer and Phillip2017) and CV’s below 20 % are reported for non-diabetic adults (Peyser et al., Reference Peyser, Balo, Buckingham, Hirsch and Garcia2018) and considered to reflect stable glucose control in diabetes treatment (Monnier et al., Reference Monnier, Colette, Wojtusciszyn, Dejager, Renard, Molinari and Owens2017). In contrast, a similar trial in length and design using 30 g/day purified ITF did not observe changes in glucose variability assessed by CGM, even though subjects were more insulin resistant than in our study (Guess et al., Reference Guess, Dornhorst, Oliver and Frost2016). A decrease in dynamic glucose variability below 20 % after dried chicory root intake might point towards an improvement in glucose control, potentially mediated by circulating SCFA and not yet manifested in static glycaemic markers.
It has been reported in early studies that the baseline gut microbiota composition may affect the response to fibre interventions, allowing the stratification in responders and non-responders (Korpela et al., Reference Korpela, Flint, Johnstone, Lappi, Poutanen, Dewulf, Delzenne, de Vos and Salonen2014; Salonen et al., Reference Salonen, Lahti, Salojärvi, Holtrop, Korpela, Duncan, Date, Farquharson, Johnstone, Lobley, Louis, Flint and De Vos2014). This was also found in a recent ITF intervention on weight loss in an obesity cohort (Rodriguez et al., Reference Rodriguez, Hiel, Neyrinck, Roy, Pötgens, Leyrolle, Pachikian, Gianfrancesco, Cani, Paquot, Cnop, Lanthier, Thissen, Bindels and Delzenne2020). Similarly, a recent trial with wheat-bran arabinoxylan oligosaccharides indicated that baseline levels of Prevotella spp. affected the faecal microbiota response to the fibre intervention (Chung et al., Reference Chung, Walker, Bosscher, Garcia-Campayo, Wagner, Parkhill, Duncan and Flint2020). However, we could not confirm a similar impact in the present intervention with the dried chicory root. In contrast, we observed here Blautia spp. to discriminate between subjects that responded to the treatment with a decrease in HOMA-ir versus those who did not (Figure 3B). This is noteworthy, since studies have found that Blautia spp. levels are increased in T2D and also T1D patients compared to healthy controls (Gurung et al., Reference Gurung, Li, You, Rodrigues, Jump, Morgun and Shulzhenko2020; Qi et al., Reference Qi, Zhang, Yu, Xu, Zheng, Wang and Xiao2016). Blautia spp. has been implied as heritable risk factor for visceral fat mass predisposing to metabolic disease (Le Roy et al., Reference Le Roy, Beaumont, Jackson, Steves, Spector and Bell2017) and associated with long-term consumption of processed foods (Bolte et al., Reference Bolte, Vich Vila, Imhann, Collij, Gacesa, Peters, Wijmenga, Kurilshikov, E Campmans-Kuijpers, Fu, Dijkstra, Zhernakova and Weersma2021). Some studies attributed beneficial properties to Blautia spp. (Benítez-Páez et al., Reference Benítez-Páez, Gómez del Pugar, López-Almela, Moya-Pérez, Codoñer-Franch and Sanz2020), which may be caused by the incorrect assumption that these species produce butyrate – this is not the case (Louis and Flint, Reference Louis and Flint2017) and this group of intestinal acetogens might be undesired in the context of insulin sensitivity. Consequently, we segmented the treatment based on low (n = 14) and high (n = 14) relative abundance of Blautia spp. and remarkedly observed that static glycaemic markers pronouncedly decreased in the low Blautia group, but not in the high Blautia group (Figure 3D,E). Moreover, a low Blautia spp. baseline relative abundance also appeared to impact more pronouncedly the other metabolic markers as CV of glucose levels decreased faster (Figure 3C) and circulating SCFA were higher in the low Blautia group compared to the high Blautia group (Supplemental Figure S6). We identified as major human Blautia species in this study B. hominis, B. luti and B. obeum. Several of these species are abundant members in the human gut and utilise different sugars and starch to produce acetate (Liu et al., Reference Liu, Finegold, Song and Lawson2008; Shin et al., Reference Shin, Kang, Tak, Hyun, Kim, Kim, Lee, Sung, Whon and Bae2018; Touyama et al., Reference Touyama, Jin, Kibe, Hayashi and Benno2015). It has been reported that subjects consuming processed foods have increased levels of Blautia spp. (Bolte et al., Reference Bolte, Vich Vila, Imhann, Collij, Gacesa, Peters, Wijmenga, Kurilshikov, E Campmans-Kuijpers, Fu, Dijkstra, Zhernakova and Weersma2021; Koponen et al., Reference Koponen, Salosensaari, Ruuskanen, Havulinna, Männistö, Jousilahti, Palmu, Salido, Sanders, Brennan, Humphrey, Sanders, Meric, Cheng, Inouye, Jain, Niiranen, Valsta, Knight and Salomaa2021). Hence, it is possible that subjects with these dietary habits are initially less responsive to the intrinsic fibre intake. We observed a decrease in Blautia spp. levels after 30 g/day dried chicory root treatment (Figure 2E) and also an ITF-induced decrease in this genus has been reported earlier (Chambers et al., Reference Chambers, Byrne, Morrison, Murphy, Preston, Tedford, Garcia-Perez, Fountana, Serrano-Contreras, Holmes, Reynolds, Roberts, Boyton, Altmann, Mcdonald, Marchesi, Akbar, Riddell, Wallis and Frost2019; Hiel et al., Reference Hiel, Gianfrancesco, Rodriguez, Portheault, Leyrolle, Bindels, Gomes da Silveira Cauduro, Mulders, Zamariola, Azzi, Kalala, Pachikian, Amadieu, Neyrinck, Loumaye, Cani, Lanthier, Trefois, Klein, Luminet, Bindelle, Paquot, Cnop, Thissen and Delzenne2020). Extrapolation of the intervention-induced decrease in relative amounts of Blautia spp. suggested the high Blautia group might reach levels of the low Blautia group after an additional 6–8 weeks. This is relevant since a recent meta-analysis concluded that ITF interventions of 6 weeks or longer are needed to sufficiently decrease T2D markers in diabetic subjects (Wang et al., Reference Wang, Yang, Huang, Zhang, Zuo, Xu, Niu and Wu2019). This also addresses the most important limitations of this study, which includes the short intervention duration that precludes meaningful measuring of Hb1Ac levels and the rather low level of insulin resistance.
In conclusion, this study shows the rapid effect of intrinsic fibre intake on bowel function, gut microbiota composition, faecal and fasting circulating SCFA and glucose variability in subjects at risk of T2D. The evidence for a trophic chain including Bifidobacterium and Anaerostipes spp. was recapitulated by in vitro incubations that resulted in high levels of butyrate and propionate production from the treatment product. Moreover, we observed a simultaneous increase in faecal and circulating SCFA levels and a marked improvement in dynamic markers of glucose control (CGM). In subjects with a low relative abundance of Blautia spp. – a genus that previously has been associated with T2D – also static glycaemic markers decreased pronouncedly. Since the chicory root treatment decreased levels of Blautia spp. (Figure 2E), increasing the intervention time is expected to provide glucose homeostasis improvement for all subjects at risk for T2D. Our results demonstrate a strong modulatory potential on gut health and microbial metabolism by native inulin and cell wall fibres pectin, cellulose and hemicellulose in the intrinsic form of dried chicory roots. Incorporating these minimally-processed, intrinsic fibres into long-term dietary therapeutic interventions could greatly impact the management of metabolic health via the increased levels of faecal and circulating SCFA.
Abbreviations
- BSS
-
Bristol Stool Scale
- CGM
-
continuous glucose monitoring
- CV
-
coefficient of variation (%) assessed by CGM
- ENA
-
European Nucleotide Archive
- GPR
-
G-protein-coupled receptors
- ITF
-
inulin-type fructans
- PCoA
-
principal coordinate analysis
- PERMANOVA
-
permutational multivariate analysis of variance
- SCFA
-
short-chain fatty acids
- T2D
-
type 2 diabetes
- YCFA
-
medium yeast extract, casitone and fatty acid medium
Acknowledgements
We are grateful to the participants of the VEZEL study and the excellent technical advice on the circulating short-chain fatty acid analysis of Prof. Dr. Jacques Vervoort, who unfortunately passed away during the preparation of this manuscript. Bacteroides xylanisolvens HMP 2_1_22 was a kind gift of the Human Microbiome Program. We are grateful to Anne van de Wiel, Prof. Dr. Monica Mars, Henriette Fick-Brinkhof, Dr. Ineke Klopping-Ketelaars, Nhien Ly, Corine Perenboom, Prof. Dr. Guido Hooiveld and the students from the Division of Human Nutrition & Health – especially Isa Brucker, Luis Llanos Moreno, Patteela Prathumars and Maud Mulder – who assisted during the execution of the study and biomarker analysis. We are grateful to Ineke Heikamp-de Jong, Steven Aalvink, Merlijn van Gaal from the Laboratory of Microbiology, Prof. Dr. Anne Salonen and Tinja Kanerva from Human Microbiome Research Program, Prof. Dr. Max Nieuwdorp and Ilias Attaye from AMC Amsterdam for their great advice during the CGM analysis, and Theresia Blok from the hospital ZGV. We are grateful to F. S. Kaper (WholeFiber BV) for providing the study material and his continuous interest.
Disclosure statement
W.M.d.V. provided scientific advice to WholeFiber BV.
Supplementary Materials
To view supplementary material for this article, please visit http://doi.org/10.1017/gmb.2022.4.
Notes on contributors
Marie-Luise Puhlmann MSc is a PhD candidate at the Laboratory of Microbiology and the Division of Human Nutrition & Health at Wageningen University. Her research is focusing on the modulatory effect of intrinsic fibers on gut microbiota and human health.
Roosa Jokela MSc is a doctoral researcher in the Human Microbiome Research Program at the Faculty of Medicine of the University of Helsinki. Her work deals mainly with the development of the microbial ecosystem in early life and its modulation.
Katja C. W. van Dongen MSc pursued her PhD at the Laboratory of Toxicology at Wageningen University and recently continued to work as researcher in food safety. In her PhD project she studied advanced glycation end products and their interaction with the gut microbiome.
Dr Roland W. J. Hangelbroek is a researcher at the Division of Human Nutrition and Health and data scientist at Euretos BV. He did his PhD in Nutrigenomics after which he continued as data scientist and research consultant.
Dr Thi P. N. Bui is a post-doctoral researcher at the Laboratory of Microbiology at Wageningen University and at Caelus Health, where she works on novel anaerobes and gut microbial interactions in relation to host health. She recently started a new position as post-doctoral researcher at Amsterdam University Medical Centre.
Prof Dr Willem M. de Vos is Distinguished Professor Emeritus at the Laboratory of Microbiology at Wageningen University and Professor of Human Microbiomics in the Human Microbiome Research Program at the Faculty of Medicine of the University of Helsinki where he is Director of the Human Microbiome Research Program. His research aims to understand and exploit microbes using molecular, (meta)genomics and systems approaches. He has pioneered research on the relation of the gut microbiota with human health, developed avenues to study causality, and discovered various new intestinal anaerobes, including Akkermansia muciniphila.
Prof Dr Hauke Smidt is professor at the Laboratory of Microbiology at Wageningen University holding a personal chair of Molecular Ecology with focus on microbial communities and their activities in various ecosystems.
Prof Dr Edith J. M. Feskens is professor and chair of Global Nutrition within the Division of Human Nutrition and Health, where she works on tackling over- and undernutrition with sustainable dietary solutions.
Author contributions
Conceptualisation: W.M.d.V., E.J.M.F.
Data curation: M-L.P., R.J., K.C.W.v.D., R.W.J.H.
Formal analysis: M-L.P., R.J., K.C.W.v.D., T.P.N.B., R.W.J.H.
Funding acquisition: W.M.d.V., E.J.M.F.
Investigation: M-L.P., R.J., K.C.W.v.D., T.P.N.B.
Methodology: M.-L.P., R.J., K.C.W.v.D., T.P.N.B., R.W.J.H., W.M.d.V., E.J.M.F.
Project administration: M-L.P., W.M.d.V., E.J.M.F.
Resources: K.C.W.v.D., H.S., W.M.d.V., E.J.M.F.
Software: R.J., R.W.J.H.
Supervision: H.S., W.M.d.V., E.J.M.F.
Visualisation: M-L.P., T.P.N.B., W.M.d.V.
Writing – original draft: M-L.P., T.P.N.B., W.M.d.V.
Writing – review and editing: M-L.P., R.J., K.C.W.v.D., T.P.N.B., R.W.J.H., H.S., W.M.d.V., E.J.M.F.
Funding
Part of the research was supported by the Spinoza Award (W.M.d.V., grant number 2008) and the SIAM Gravitation Grant (W.M.d.V., grant number 024.002.002) of the Netherlands Organization for Scientific Research and the Innovation Program Microbiology (E.J.F. and W.M.d.V., grant number IPM 2008) of Wageningen University. WholeFiber BV provided the study product but did not provide additional funding for this research.


 Open access