


Introduction
Studies of firn densification processes (e.g. Reference AlleyAlley, 1987) and the rate of firn compaction have received increasing attention in recent years because of their effects on the interpretation of elevation changes observed by airborne and satellite altimeter surveys (Reference Arthern and WinghamArthern and Wingham, 1998; Reference Reeh, Fisher, Koerner and ClausenReeh and others, 2005; Reference ZwallyZwally and others, 2005). Although the rate of densification is dependent on firn temperature as well as the accumulation rate in some manner in most models, the results of Reference Zwally and LiZwally and Li (2002) showed a much stronger dependence on firn temperatures than previous models. The stronger temperature dependence causes a significant seasonal cycle in the surface elevation, due to faster compaction in summer (Reference Li and ZwallyLi and Zwally, 2002; Reference Dibb and FahnestockDibb and Fahnestock, 2004), and also causes a faster response time to interannual changes in surface temperature and accumulation rates. Such changes on seasonal to decadal timescales are superimposed on the long-term changes due to past temperature and surface mass imbalance of the ice sheets.
Interpretation of ice-sheet elevation changes (dh/dt) observed by satellite altimetry requires determination of the elevation change caused by variations in firn compaction during the observation period, which requires knowledge of the temperature variations during and prior to the period of altimeter measurements. Observations from satellite and ground stations show evidence of climate warming in the past two decades over Greenland (Reference Comiso and ParkinsonComiso and Parkinson, 2004) and West Antarctica, with a general cooling over East Antarctica (Reference ComisoComiso, 2000; Reference Kwok and ComisoKwok and Comiso, 2002), suggesting a probable impact on the rate of firn compaction and observed elevation changes. In this study, we drive our densification model with monthly surface temperatures compiled from a two-decade record (1982–2003) of continuous surface temperatures derived from the Advanced Very High Resolution Radiometer (AVHRR) infrared measurements. The model also includes the densification effects of surface melting and refreezing (Reference Reeh, Fisher, Koerner and ClausenReeh and others, 2005; Reference ZwallyZwally and others, 2005). Results of our model calculations were used to correct the dh/dt observed by satellite altimetry for approximately the period 1992–2002 and estimate the corresponding mass changes. In this paper, we describe the methodology and results of our densification modeling in more detail. Other work in progress examines the effect of temporal changes in accumulation rates on the rate of firn compaction, and consequently on the appropriate effective density associated with surface mass-balance changes resulting from changes in accumulation rates.
Model Formulation
The model used here is a time-dependent firn densification model characterized by a stronger dependency on temperature. The initial development of the model was described in detail by Reference Zwally and LiZwally and Li (2002). The model was improved by introducing the temperature gradient effect on the densification rate due to vapor transfer in the regions of low temperature and low accumulation where a firn layer remains near the surface for a long period (Reference Li and ZwallyLi and Zwally, 2004). Considering that snow falls on an ice surface that steadily moves downwards, the rate of snow surface elevation change with time (dh/dt ) is given by:
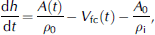
where A(t) is the accumulation rate that is normally a function of time, ρ 0 is the initial snow density at the surface (0.3 g cm–3), A 0 is the steady-state accumulation rate and ρ i is the density of ice (0.917 g cm–3). Therefore A 0/ρ i represents the long-term steady-state vertical velocity of ice, and V fc(t) is the vertical velocity at the surface (z = 0) due to firn densification. The densification velocity at depth z is determined by firn density ρ(z) and the densification rate dρ(z)/dt according to:

The densification rate usually depends on the physical parameters. As previously described by Reference Zwally and LiZwally and Li (2002), we use the rate equation modified from Reference Herron and LangwayHerron and Langway (1980) for the model:

where T is firn temperature andÂis the mean accumulation rate that represents the average change of overburden pressure at depth z. Equations (1–3) are coupled with the heat-transfer equation through the thermal properties of firn (Reference Li, Wang and ZwallyLi and others, 2002).
Surface Melt Incorporation
To account for the effect of surface melt that is significant in the coastal regions of the ice sheets, we incorporate the melt process in the model. Considering the snow melting and refreezing, the meltwater increases snow density and reduces firn layer thickness. Once the amount of meltwater in terms of the thickness L mlt (monthly surface melt) is known (Fig. 1), the mean density ρ m and thickness of the firn layer L can be estimated by
Schematic diagram showing the method of calculating mean snow density ρ m (cf. Equation (6)) and changes in the layer thickness L (cf. Equation (4)) caused by surface melt. L 0 and ρ 0 are the initial firn layer thickness and density. Here we take L 0 = A/ρ 0. A is the accumulation rate at each time-step in water equivalent. L mlt is the melt rate in water equivalent. L mlt/ρ 0 represents the thickness of the melt at the density of ρ 0. ΔL is the melt-induced thickness change.


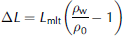
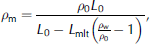
where L0 and ρ 0 are the initial firn layer thickness and density, respectively, ρ w is the density of water, and ΔL is the thickness change due to melt (Fig. 1).
The PDD (positive degree-day) relation (Fig. 2) given by Reference Braithwaite and ZhangBraithwaite and Zhang (2000) is used to calculate monthly surface melt and its effect on the firn density according to Equation (6). The relation assumes that melting effectively occurs if mean monthly temperature is above –8˚C and that the melting rate increases non-linearly with increasing mean monthly surface temperature.
The melting–temperature relationship taken from Reference Braithwaite and ZhangBraithwaite and Zhang (2000).

The importance of the summer temperature history is shown for two examples in Figure 3. The diagrams demonstrate the effect of melt on the derived surface elevation change. The summer temperatures in Figure 3a show colder summers in the earlier part than in the later part of the period. The melt-incorporated surface elevation (Fig. 3b) is lower and continues to decrease with time, especially during the later part of the period where the summer melt is stronger. However, Figure 3c shows the opposite trend. The summer temperatures for the last 10 years are significantly lower than in the earlier part of the period. The surface is significantly higher than obtained for the no-melt case (Fig. 3d). This surface increase is caused by the higher-density firn layers due to the stronger melt in the earlier part of the period, meaning that the early excess summer melt may cause the stronger surface rise in the later part of the period.
Comparison of the melt effect on variations in surface height h(t) for two cases with opposite variations in summer temperature (a, c) from AVHRR data, showing the importance of temperature history in the determination of surface height change. Mean annual values of accumulation A, surface temperature Tm and of dh/dt from the fitted lines are as indicated for each case (b,d), respectively.

Model Application
We apply the model to the Greenland and Antarctic ice sheets to estimate the impact of the AVHRR temperature variations on the surface elevation change. Assuming accumulation rates do not change with time, the calculation is performed for the regions of the ice sheets where the accumulation rate is >2.5cm a–1 as described by Zwally and Giovinetto (2000) for Greenland and Reference Giovinetto and ZwallyGiovinetto and Zwally (2000) for Antarctica. The initial steady-state surface is established using a monthly temperature cycle averaged from the first 3 years (1982–84) and an accumulation rate with surface snow density of 0.3 8 cm–3. The values of the surface elevation change (dh/dt ) are obtained by using the linear fit to the modeled surface elevation profile in 1992– 2003 for Greenland and 1992–2000 for Antarctica (Figs 4 and 5) to match the period of analyzed satellite radar altimetry data (Reference ZwallyZwally and others, 2005). The time series of surface elevation show the seasonal variations superimposed on the multi-year trend. The magnitude of the variation is greater for Greenland (up to 20 cm) due to the higher accumulation rate. The seasonal characteristics in surface elevation are caused by seasonality of the surface temperature (Fig. 6). High summer temperature accelerates the densification rate of the top several meters of firn, causing the larger amount of compaction during summer, with maximum and minimum surface elevation in late spring and late summer (Reference Li and ZwallyLi and Zwally, 2002; Reference Zwally and LiZwally and Li, 2002). The amplitude of the variation increases with the accumulation rate (Reference Li, Zwally, Cornejo and YiLi and others, 2003). The seasonal characteristics we modeled are supported by recent field observations performed at Summit in Greenland (Reference Dibb and FahnestockDibb and Fahnestock, 2004).
Time series of the changes in (a) surface height h(t) and (b–d) surface temperature from AVHRR for Greenland at selected locations showing seasonal and interannual variations (1982–2003). The solid lines in (a) are the best linear fit to the data points (with symbol mark) since January 1992 for each location respectively. Solid lines (red) in (b–d) are the initial temperature cycles averaged over 1982–84 monthly temperature data for showing the temperature anomalies during the period. Location name, accumulation rate and annual mean temperature together with the rate of the surface height change from the fitted lines are indicated.

Same as Figure 4, but for Antarctica (1982–2000).

Modeled seasonal variations in surface height h(t), driven by a steady-state sinusoidal temperature (a), and a section of AVHRR temperature cycles for Site 500 in Greenland (b).

The interannual variations shown in Figures 4 and 5 illustrate the overall decreasing trend in Greenland (Site 500, Summit, Site 100) and West Antarctica (Site 1895, Byrd), and the increasing trend in East Antarctica (Site 1873). The interannual variations are due to the cumulative effect of temperature anomalies. Although densification is enhanced during summer, the effect of the summer temperature is influenced by temperature anomalies of the previous winter. Therefore both summer and winter temperatures are important. In Greenland, summer temperatures differ relatively little from the initial steady-state values, but the winter temperatures have increased, particularly since 1992 (Fig. 4b–d). The strong winter warming dominates the overall decreasing trend in surface elevation (Fig. 4a). In Antarctica, the general increase in surface elevation at Site 1895 is due to the exceptional colder temperatures in winter, while the decreases at Byrd and Site 1873 are mainly associated with the warming in summer temperatures (Fig. 5b–d). To display this temperature ‘memory’ effect, we calculated the accumulated monthly temperature anomalies (ATA) with respect to the initial annual mean temperature (Fig. 7). The profiles show the close counter-change in both seasonal and interannual variations between the surface elevation and ATA.
An example of a temperature profile Ts (a), modeled surface elevation h(t) (b) and the cumulative monthly temperature anomaly ATA, (c), showing that the variation in h(t) is closely associated with ATA.

The impact over the entire Greenland and Antarctic ice sheets is presented in Figure 8. The surface elevation over Greenland reduces almost everywhere by up to >10cma–1, with a mean of –1.8cm a–1. This centimeter-level decadal variation driven by the temperature is about one magnitude greater than previously considered (e.g. Reference Arthern and WinghamArthern and Wingham, 1998). Elevation changes over the Antarctic ice sheet show the contrast between West and East Antarctica. The surface elevation decrease in West Antarctica is on average similar to Greenland (–1.9cma–1). The reductions in elevation are mainly concentrated along the coastal and ice-shelf regions where the summer melt is found (Reference Zwally and FieglesZwally and Fiegles, 1994). Corresponding to the surface cooling for the period over East Antarctica, the surface elevation increases at a smaller rate, with a mean of 1.4 mma–1, due to the low temperature and low accumulation.
AVHRR monthly-temperature-derived spatial distribution of ice-sheet surface elevation change (dh/dt) due to firn densification over Greenland (1992–2003) (a) and Antarctica (1992–2000) (b), showing a significant decrease of the elevation over Greenland and West Antarctica, and a general increase over East Antarctica. Locations with extremely low accumulation rates (<2.5cma–1) were excluded to save computation time. The dh/dt values are shown in 50 ×50km cells.

Since ice-thickness change due to firn densification driven by the temperature change does not involve mass exchange in the firn column, the satellite-derived ice-thickness changes corrected for the firn densification improve the mass-balance estimate for the ice sheets and their contributions to sea-level change. The surface-elevation changes shown in Figure 8a and b are approximately 20% of recent satellite altimetry measurements (Reference ZwallyZwally and others, 2005). If these were incorrectly interpreted as a change in ice thickness, it would lead to an overestimate of the ice-sheet contribution to sea-level change. Our study shows the impact of the temperature forcing only. Changes in the accumulation rate cause changes in both the mass and elevation of the ice sheet. In particular, if accumulation increases with temperature, the effects of changing accumulation tend to oppose the effects of temperature change. Investigation of the effects of changes in accumulation rate is in progress.
Conclusions
The dynamic response of the snow surface elevation to the temperature variation is closely associated with the cumulative effect of temperature anomalies, and demonstrates the importance of the temperature history. This history is also important in the surface melt-induced variations for the period over which the surface elevation change is determined.
The modeled surface-elevation changes associated with seasonal temperature variations over the Greenland and Antarctic ice sheets in two decades (1982–2003) indicate surface elevation changes in Greenland and West Antarctica of approximately –2 cma–1 due to the surface warming, and a small overall increase of 1 mma–1 in East Antarctica.



