

Paediatric obesity is a major public health challenge: between 1976–1980 and 2007–2008, obesity more than tripled among US children and adolescents (from 5 % to 17 %), with the burden of obesity most heavy upon Hispanic males and non-Hispanic black females(Reference Barnes1). Two specific recommendations(Reference Barnes1) include:
Recommendation 4.2: Local governments should be encouraged to create incentives to attract supermarkets and grocery stores to underserved neighborhoods and improve transportation routes to healthy food retailers.
Recommendation 4.4: Encourage communities to promote efforts to provide fruits and vegetables in a variety of settings and encourage the establishment and use of direct-to-consumer marketing outlets such as farmers’ markets and community supported agriculture subscriptions.
Such costly and drastic environmental and policy approaches are recommended to halt the paediatric obesity epidemic because paediatric obesity often tracks into adulthood(Reference Herman, Craig and Gauvin2) and adult obesity causes significant health and economic losses(Reference Finkelstein, Fiebelkorn and Wang3–Reference Finkelstein, Fiebelkorn and Wang6). These recommendations demonstrate the importance of the food environment to address childhood obesity. However, since a paucity of evidence exists to support such recommendations, there is a need to continue to accrue empirical support for the efficacy of such recommended measures.
The food environment often dictates food options available to youth(Reference Barnes1, Reference Larson and Story7). For example, among US adolescents, it has been shown that greater access to supermarkets was associated with lower BMI, while greater access to convenience stores was associated with higher BMI(Reference Powell, Auld and Chaloupka8, Reference Liu, Wilson and Qi9). Greater proximity to fast-food outlets coupled with lower cost of available items is associated with less healthy diets and adolescent overweight(Reference Powell, Auld and Chaloupka10). One study found that greater distance from a child's home to the nearest chain supermarket was associated with greater risk of overweight only among children dwelling in less densely populated areas(Reference Liu, Wilson and Qi9). This is significant as rural dwellers are more likely to be overweight or obese(Reference Blankenau11) and generally live further from chain supermarkets than their urban and suburban counterparts(Reference Liese, Weis and Pluto12, Reference Sharkey and Horel13). Thus, there is a great need to examine relationships between potentially obesogenic features of the food environment and weight status, particularly among rural-dwelling youth. Results from the examination of such relationships may have policy implications regarding the use of health impact assessment in zoning of food venues in rural areas.
While several measures of the food environment have been studied(Reference Larson, Story and Nelson14), no study to our knowledge has examined the correlations between various measures of the food environment (e.g. correlation between distance to closest fast-food restaurant and distance to closest chain supermarket). If there are high correlations between food environment measures, this should be accounted for in future epidemiological analyses of the relationship between obesity and the food environment.
Also needed is evidence regarding the most relevant measure for quantifying the food environment among youth. For example, some have quantified exposure to the food environment using proximity, or network distance, to the closest food venue, while others have used coverage, or counts, of food venues in buffers of various sizes. The most relevant measure to quantify the built environment related to physical activity (PA) has been examined(Reference Boone-Heinonen, Popkin and Song15), with researchers finding that the most relevant exposure variable was PA facilities within a 3 km buffer. For the food environment, the most relevant measures should have adequate variability, be associated with outcomes of interest, and must be realistic given the particular community context (e.g. rural v. urban) and population (e.g. youth v. adult) under study.
In the current study, using a clinic-based sample of youth from Pitt County, North Carolina, we examined the correlation between measures of participants’ accessibility to food venues and the bivariate and multivariate associations between various measures of food venue accessibility and BMI percentile. We conceptualized food venue accessibility in two ways: (i) ‘coverage’, or number of food venues in buffers of 0·25, 0·5, 1 and 5 miles (hereafter referred to as 0·4, 0·8, 1·6 and 8·0 km buffers); and (ii) ‘proximity’, or distance to the closest food venue. We examined associations between BMI percentile and food venue accessibility using correlation and regression analyses. We hypothesized the following:
1. The distance from the youth's home address (proximity) to the closest fast-food restaurant will be inversely associated with BMI percentile such that greater distance will be associated with a lower BMI percentile.
2. The density (coverage) of fast-food restaurants will be positively associated with BMI percentile such that greater fast-food density will be associated with higher BMI percentile.
3. The proximity from the youth's home address to the closest chain supermarket will be positively associated with BMI percentile such that greater distance will be associated with a higher BMI percentile.
4. The coverage of chain supermarkets will be inversely associated with BMI percentile such that greater supermarket density will be associated with lower BMI percentile.
Experimental methods
Study setting and participants
This research was conducted in an urban centre (Greenville) and surrounding rural areas of Pitt County, eastern North Carolina (2008 estimated population of 156 081). According to data from the US Department of Agriculture's Food Environment Atlas, 32 % of residents are obese, 22 % live below the poverty level, 33 % are African American and the number of fast-food restaurants per 1000 residents is 0·87, among the highest density of fast-food restaurants in North Carolina(16). There are an estimated 4·25 % of Pitt County households with no car and who live greater than 1 mile (1·6 km) to a grocery store or supermarket(16).
For the current analysis, we extracted data from the Brody School of Medicine electronic medical records for paediatric patients between the ages of 8 and 18 years, with a home address listed with a Pitt County zip code, receiving well child check-ups from January 2007 to June 2008 at the ECU Pediatric Outpatient Clinic. This study was approved for waiver of informed consent and HIPAA authorization and was approved by the University Medical Center Institutional Review Board.
Food venue assessment
We obtained addresses for various food venues from three sources: (i) North Carolina Department of Environmental Health records (from 2008); (ii) ReferenceUSA® business database (www.referenceusa.com), accessed in August 2010; and (iii) ascertaining uncertain addresses by ground-truthing. The business status of food venues was verified via telephone and ground-truthing if there were discrepancies between the two databases (e.g. venue listed in one but not both, different addresses for the same venue) or if the location of the food venue could not be verified through geocoding processes. Food venues were separated into the following categories: fast-food restaurants, sit-down restaurants, pizza restaurants, convenience stores, chain supermarkets, grocery stores, supercentres, dollar stores and produce stands/farmers’ markets. ReferenceUSA was used to classify venues according to the following North American Industrial Classification System (NAICS) codes: 44511001/2/3/4/5 = supermarkets and grocery stores; 452910 = supercentres and discount clubs; 44523001/003 = produce markets; 72221101/3/4/5 = fast-food restaurants; 452990 = dollar stores; and 44512001 = convenience stores, with and without gas pumps. Due to the inconsistencies of NAICS codes in categorizing some food venues accurately, inclusion and exclusion criteria were established by the authors according to a method described elsewhere(Reference Jilcott, McGuirt and Imai17). We used chain name recognition and information on number of employees to separate grocery stores from supermarkets (stores with 20+ employees were classified as supermarkets). We excluded sit-down restaurants from the fast-food restaurant category. Fast-food restaurants were categorized based on chain name recognition, and included restaurants with designated drive-thru windows and/or whose majority of business was take-out. We used data gathered from community exploration to ascertain and add additional produce markets, as some were not listed in administrative databases.
Geocoding participants and food venues
We constructed a geographic information systems (GIS) database for the purpose of geocoding study participants and food venues, as well as to efficiently quantify each participant's accessibility (both proximity and coverage) to food venues. Reference layers for the GIS database included Pitt County property parcels and Pitt County street centreline files obtained from the Pitt County Management Information Systems, as well as street centreline files from the City of Greenville. All GIS layers were referenced to the North Carolina state plane coordinate system of 1983 with coordinates measured in feet. Multiple geocoding tools were used to locate and create point layers of study participants and food venues.
The Google Geocoding API (through the third-party geocoding website BatchGEO.com) was used to geocode 499 of the study participants to rooftop accuracy. An additional 245 participants were geocoded to match scores of 100 or manually matched using ArcGIS software (ESRI, Inc., Redlands, CA, USA) address locators based on the street centreline files. Matched addresses refer to addresses that could be matched to exact locations in the GIS database, whereas unmatched addresses were those that could not be matched to exact locations in the GIS database. Of the remaining participants, twenty-seven lived outside the Pitt County study area and seventy-six were unmatched, for an 88 % match rate. Unmatched participants were not significantly different from matched participants with regard to race (χ 2 test, African American v. White v. Other, P = 0·29), town of residence (Greenville v. Other, P = 0·72) or BMI percentile (t test, P = 0·87).
Food venues were geocoded using the same procedures that were used to geocode participants. The goal for mapping food venues was to map the entire universe of Pitt County food venues relevant to our study questions. Those food venues that were not geocoded using the batch geocoding processes were otherwise located using a variety of manual methods, including searches in the parcel database, using Google's Streetview (available in Google Earth and Google Maps) to visually confirm venue locations, telephoning the venue to confirm street intersection locations, and field identification. Using these methods, 417 of the 432 food venues in the original food venue address list were located. Of the fifteen food venues that were not located, six were removed from the database because they fell outside the Pitt County study area, four represented redundant business entities, and five either did not exist or were not located using any of the above methods.
Quantifying food venue accessibility
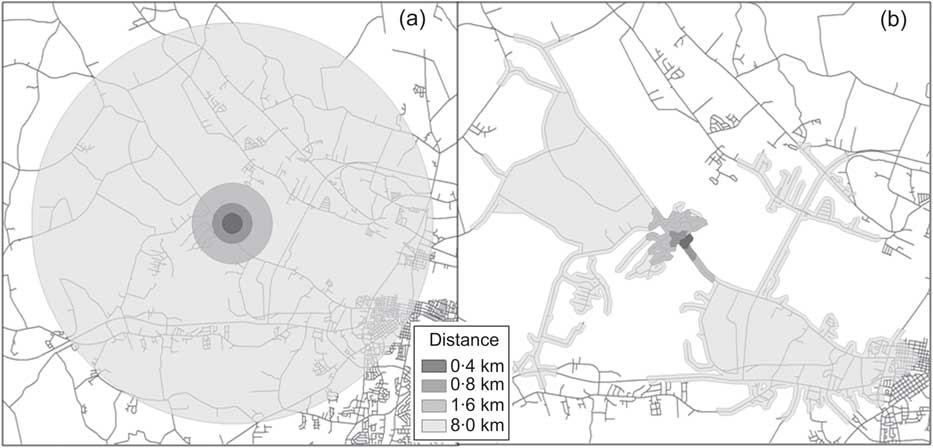
Once point layers were created from the geocoded participants and food venues, ArcGIS was used to quantify two different measures of accessibility to food venues: coverage and proximity. A road network was developed using a Pitt County street centrelines layer, with the cost of traversing the road network quantified as the distance travelled (in kilometres) along the road route. To estimate coverage, circular buffers were calculated at Euclidean distances of 0·4, 0·8, 1·6 and 8·0 km for each participant. In addition, the street centreline files were used to create 0·4, 0·8, 1·6 and 8·0 km network-based service areas for each participant using the Network Analyst-Service Area extension in ArcGIS (see Fig. 1). Spatial joins were then used to calculate the number of food venues that were within the buffers and network service areas of each participant. Finally, to calculate proximity, distance (in feet, which were then converted to kilometres) to the closest food venue of each type was calculated for each participant. Spatial joins were used to calculate simple Euclidean ‘crow flies’ distances, and the Network Analyst-Closest Facility extension in ArcGIS was used to calculate network distances along street centrelines.
(a) Euclidean distance buffers for a selected study participant and (b) network service areas for the same participant
BMI percentile
BMI percentile specific for age and gender was calculated from measured BMI as recorded in the medical records, based on the Centers for Disease Control and Prevention growth charts using LMS curves(18).
Covariates
Covariates included rural/urban residence, race and insurance status. Youth were categorized as ‘urban’ if they resided in Greenville, NC and as ‘rural’ if they resided in one of the outlying rural areas of Pitt County. Race was categorized as African American, White and Other. Insurance status was categorized as Medicaid, private and no insurance.
Statistical analysis
Correlation coefficients between accessibility to food venues (proximity and coverage) as well as their individual correlation with BMI percentile were examined using the CORR procedure in the SAS statistical software package version 9·2 (SAS Institute, Cary, NC, USA). For measures of food venue accessibility that were significantly (P < 0·01) correlated with BMI percentile, we examined associations between BMI percentile and food venue accessibility using general linear regression analyses, performing the regression of BMI percentile v. demographic and food venue accessibility variables. Demographic covariates were race, rural/urban residence and insurance status. We did not include gender and age as potential covariates as these variables are used to calculate the BMI percentile. Possible interactions between the independent variables were considered and deleted if significance (P < 0·05) was not reached.
Results
Participant and food environment characteristics
Characteristics of study participants are shown in Table 1. Of the 744 geocoded participants, the average BMI percentile was 0·70 (sd 0·28), average age was 12·9 years (sd 2·5), 52·6 % were male, 71·5 % were African American, 73·1 % resided in Greenville city limits and 77·3 % were insured by Medicaid.
Demographic characteristics of 744 eastern North Carolina youth

Not all numbers add to 100·0% due to rounding.
Relevant measures of food venue accessibility
Variability in food venue accessibility measures was assessed using proximity to closest food venue and coverage (number of venues in an 8·0 km network buffer; Table 2). There was adequate variability in proximity and coverage (8·0 km network buffer) as evidenced by the reasonable standard deviations and the wide ranges. We found low variability for food venue coverage when assessed by the number of food venues in 0·4, 0·8 and 1·6 km Euclidean and network buffers (data not shown). For these coverage variables, the standard deviation was usually larger than the mean coverage, and the range was small.
Variability in proximity (network distance in kilometres) to closest food venue and coverage (number of food venues in 8·0 km network buffer) among 744 eastern North Carolina youth, including correlations of proximity and coverage with BMI percentile

We found moderate to high correlations between all proximity and coverage (8·0 km buffer) measures used to quantify food venue accessibility. For instance, the correlation coefficient for proximity to the closest produce market and fast-food restaurant was 0·43, whereas the correlation between proximity to the closest fast-food restaurant and proximity to the closest supermarket was 0·98. Correlation coefficients for proximity measures of accessibility to all food venues are shown in Table 3. (Data from the correlation analyses between the coverage variables are not shown.)
Correlation between proximity (in kilometres) to various food venue types among 744 children in eastern North CarolinaFootnote *

* All correlation coefficients have P < 0·0001.
Associations between food environment variables and BMI percentile
Bivariate associations between BMI percentile and coverage of food venues indicated an inverse association between BMI percentile and coverage of farmers’ markets/produce markets within 0·4 km (r = −0·07, P = 0·0423) and 0·8 km Euclidean (r = −0·11, P = 0·0036) buffers. In addition, bivariate associations existed between BMI percentile and coverage of farmers’ markets/produce markets within 0·8 km (r = −0·08, P = 0·0308) and 1·6 km network buffers (r = −0·10, P = 0·0086). There was a positive association between BMI percentile and coverage of fast-food and pizza places in both the 0·8 km Euclidean (r = 0·07, P = 0·0442) and network (r = 0·11, P = 0·0032) buffers. Proximity to the closest convenience stores was negatively correlated with BMI percentile (r = −0·07, P = 0·0725), so that lower distance to convenience stores was associated with higher BMI percentile. Proximity to the closest farmers’ market was positively correlated with BMI percentile (r = 0·07, P = 0·0585), so that greater distance to farmers’ markets was associated with higher BMI percentile (Table 2). No other proximity or coverage measures were significantly correlated with BMI percentile. (Data are not shown for associations between coverage and BMI percentiles.)
We used proximity to the closest food venue as the independent variable of interest in regression analyses because it better models participant travel behaviours, because of the significant correlations with BMI percentile (from Table 2) and because of the adequacy of variability in the proximity variables. We also examined possible interaction between covariates and proximity to the closest food venue. Two variables, proximity to convenience stores and proximity to farmers’ markets, showed statistical significance (P < 0·1) in the correlation analysis (Table 2) and were thus included in the regression analysis. Proximity to convenience stores and to farmers’ markets significantly (P < 0·05) interacted with race with significant marginal effects. Tables 4 to 6 show respectively the test of effects in the general linear model with BMI percentile as the dependent variable, the summary of model effect sizes and the estimated BMI percentiles of six hypothetical eastern North Carolina youth using the general linear model. The final model included the following independent variables: proximity to convenience store, proximity to farmers’ market, race, urban/rural residential location, insurance status and two interaction terms (proximity to convenience store × race and proximity to farmers’ market × race). The two food venue proximity variables included in the final model were not highly correlated (from Table 3, r = 0·40).
Test of effects in the general linear model, with BMI percentile as the dependent variable, among 744 children in eastern North Carolina

Summary of effect sizes of significant effects in the general linear model among 744 children in eastern North Carolina

Estimated BMI percentiles of six hypothetical eastern North Carolina youth using the general linear model

Distance to convenience store and race
The parameter estimate for proximity to the closest convenience store was inversely associated with BMI percentile, but the effect was moderated by race: The largest inverse association was in the Other race group, followed by African American, then White youth. This indicated that among those children classified as ‘Other’ or ‘African American’, closer proximity to a convenience store was more strongly related to a higher BMI percentile than for White youth. Regression analyses demonstrated that the differences between the inverse association between proximity to convenience stores and BMI percentile were statistically significant (P < 0·05) except between African American and White youth (P = 0·20).
Distance to farmers’ market and race
Conversely, proximity to the closest farmers’ market was positively associated with BMI percentile. The largest positive association was in the Other race group; then the African American, followed by the White group. All differences between the positive association between BMI percentile and proximity to farmers’ market among race groups were statistically significant (P < 0·05). Using estimated BMI percentile from the final model, an African American participant on Medicaid who lives in Greenville and lives 0·5 km from a farmers’ market and 3 km from a convenience store was estimated to have a BMI percentile of 0·63, whereas a participant with these same characteristics but living 3 km from a farmer's market and 0·5 km from a convenience store was estimated to have a BMI percentile of 0·67. A participant of the same race and insurance but living in a rural area, 0·5 km from a farmers’ market and 3 km from a convenience store, was estimated to have a BMI percentile of 0·66, whereas when the distance from a farmers’ market is 3 km and the distance from a convenience store is 0·5 km, then the estimated BMI percentile was 0·70 (see Table 6).
Discussion
In summary, we found adequate variability in measures of accessibility to food venues among this sample of rural and urban youth. The current study results also demonstrate high correlations between variables used to quantify accessibility to food venues, including coverage and proximity. The high correlations found in the study should be accounted for in future epidemiological analyses of the relationship between obesity and the food environment. There was low variability (as assessed by the standard deviation and range) of venue coverage in the 0·4, 0·8 and 1·6 km buffers. In the future, the selection of appropriate buffer sizes to estimate venue coverage should balance (i) the variability of venue coverage, (ii) feasible distances that youth may travel and (iii) significant associations with outcomes of interest.
More work is needed to determine appropriate buffer sizes to calculate coverage of food venues for studies of the food environment(Reference Larson, Story and Nelson14, Reference Laska, Hearst and Forsyth19). In the current study, we found associations in the expected positive directions between BMI percentile and coverage of fast-food venues in the 0·8 km Euclidean and road network buffers. We found no significant associations between BMI percentile and venue coverage in the 8·0 km buffers. It may be that different buffer sizes are needed based on food venue type assessed.
We did not find hypothesized negative associations between proximity to the closest fast-food restaurant and BMI percentile. We also did not find hypothesized positive associations between proximity to the closest chain supermarket and BMI percentile. As Laska et al.(Reference Laska, Hearst and Forsyth19) assert, it could be that in areas where the environment is saturated with food venues, individual choices and social influences play a bigger role in determining youth food choices than does the food environment.
Our findings regarding the inverse association between BMI percentile and proximity to the closest convenience store are in agreement with findings of Laska et al.(Reference Laska, Hearst and Forsyth19), who found inverse associations between convenience store proximity and BMI. Dengel et al.(Reference Dengel, Hearst and Harmon20) recently found inverse associations between metabolic syndrome and proximity to convenience stores. In agreement with Rundle et al.(Reference Rundle, Neckerman and Freeman21) we found positive associations between proximity to fruit and vegetable/farmers’ markets and BMI percentile. Taken together, these results can inform future health impact assessments for planning locations of convenience stores and farmers’ markets.
As a majority (77 %) of our sample of youth listed Medicaid as their insurance, the current study has implications for clinicians and practitioners serving low-income and disadvantaged populations. Our finding that the relationship between BMI percentile and proximity to convenience stores and farmers’ markets was stronger among non-white (Other in the present study) and African American/Black participants when compared with White participants warrants further exploration. It could be that minority youth have fewer resources to overcome the challenges to making healthier choices in the current US obesogenic environment compared with their higher-income, white counterparts.
Limitations of the present study include the cross-sectional study design, using a clinic-based sample and the timing of the BMI percentile measures and assessment of the food environment, in that the BMI percentile was assessed at the date the child was seen in the clinic (between January 2007 and June 2008) and the food environment was mapped in 2010. A further limitation is that we do not have data on use of food venues, and living close to a venue does not necessarily mean that a person will use the venue. The study is also limited in that food venues available in a neighbourhood are likely to be associated with neighbourhood socio-economic status (SES), which is associated with BMI. Thus, neighbourhood SES may be an unmeasured confounder in these analyses. We did not control for neighbourhood SES, nor did we control for individual-level SES. However, we did control for individual-level insurance status as a proxy for SES. Other measures of SES (e.g. household income) were not used because the sample was derived from medical records and thus such SES information was not available.
A strength of the present study is the large sample of urban and rural-dwelling youth. We also considered dollar stores and other non-traditional food venues when assessing the food environment. Finally, we examined the use of various measures of the food environment to quantify accessibility to food venues, including coverage of food venues in various buffer sizes as well as proximity (network and Euclidean distance) to closest food venues, to quantify accessibility of youth to various food venues.
Future longitudinal work should examine correlations between proximity to and use of traditional and non-traditional food venues. Future work should also include measurement of associations between the food environment and downstream obesity-related health outcomes such as metabolic syndrome. Such work will be important to inform programmes and policies to decrease and ameliorate the harmful effects of future childhood obesity.
Acknowledgements
The work was funded by the Brody Brothers Endowment Fund at the ECU Medical & Health Sciences Foundation, Inc. and an East Carolina University Faculty Start-up Award. This submission represents original work that has not been published previously and is not being considered by another journal. Being accepted for Public Health Nutrition, it will not be published elsewhere in the same form, in English or in any other language, without the written consent of the Nutrition Society. Each author has seen and approved the contents of the submitted manuscript. The authors wish to declare no conflicts of interest. S.B.J. planned and led the study, facilitated data acquisition and funding, conducted statistical analyses, and led manuscript writing. S.W. and J.T.M. facilitated GIS data acquisition and management, and led writing of the GIS methods section. Q.W. conducted statistical analyses and contributed to the methods and results sections. S.L. and J.B.M. facilitated data acquisition and funding. The authors would like to thank Leisha Hibbitt and David Blackley for their assistance in data acquisition.


