

Introduction
Basal ice is part of the subglacial ecosystem, which comprises the basal ice zone, the subglacial sediments and subglacial water (e.g. Reference HodsonHodson and others, 2008). It is defined as ice that has acquired distinctive physical and/or chemical characteristics as a result of processes operating at or near the bed of glaciers (Reference KnightKnight, 1997; Reference Hubbard, Cook and CoulsonHubbard and others, 2009). These processes are reflected in the genesis and post-formational alteration of distinct basal ice types (referred to as basal ice facies) that can be classified according to physical ice properties such as thickness, debris concentration and texture, and bubble concentration and size (Reference Hubbard, Cook and CoulsonHubbard and others, 2009). In addition, analytical techniques (e.g. ice crystallography, electrical conductivity measurements, co-isotope analysis of δ18O and δD, and gas composition of CO2, CH4 and O2 in bubbles) have been used to further describe and differentiate basal ice facies (Reference KnightKnight, 1997).
The previous assumption that subglacial environments are abiotic due to lack of photoenergy and low temperatures has proved to be invalid. It has become more and more evident that microbes not only are present in high numbers in subglacial environments worldwide, but that they actively participate in weathering processes (Reference Tranter, Sharp, Lamb, Brown, Hubbard and WillisTranter and others, 2002, Reference Tranter, Skidmore and Wadham2005). However, although it is now generally accepted that basal ice provides habitats for metabolizing microorganism communities (Reference Sharp, Parkes, Cragg, Fairchild, Lamb and TranterSharp and others, 1999; Reference Skidmore, Foght and SharpSkidmore and others, 2000; Reference Sheridan, Miteva and BrenchleySheridan and others, 2003; Reference Miteva, Sheridan and BrenchleyMiteva and others, 2004; Reference Tung, Price, Bramall and VrdoljakTung and others, 2006; Reference Yung, Shafaat, Connon and PonceYung and others, 2007), an understanding of the role of microorganisms in basal ice facies is only in its infancy.
This paper presents the results of the first study on the microbial community and its potential activities in basal ice at the margin of the Greenland ice sheet (GIS), West Greenland. The focus of our study is on the microbial community in the lowest basal ice facies, referred to as the solid ice facies. We also describe the physical characteristics of the basal ice environment, so that this study may be compared to similar basal ice microbiology studies in order to determine what subglacial processes influence the microbial community structure in various basal ice facies.
Study Area
The study site (6780802100 N, 5080204300 W; 490m a.s.l.) is located between the outlet glaciers Isunguata Sermia and Russell Glacier at the margin of the GIS (Fig. 1). The climate is continental low Arctic and the region is considered to be a polar desert (Reference HobbsHobbs, 1931). The nearest meteorological station is located at the airport of Kangerlussuaq (Søndre Strømfjord), ∼31 km west of the study area. Here the mean annual air temperature and the mean annual precipitation are –5.7°C and 149 mm (1961–90), respectively (Reference CappelenCappelen, 2009). There is continuous permafrost, with an active layer thickness of ∼0.5m in peat-covered areas and >1.0m on unvegetated proglacial outwash plains. The geology consists of amphibolite and granulite facies gneisses with deformed and boudinaged basic to intermediate intrusive dykes belonging to the Nagssugtoqidian mobile belt (Reference Escher, Sørensen, Zeck, Escher and WattEscher and others, 1976).
Location map of the study site at the margin of the GIS, north of Russell Glacier.
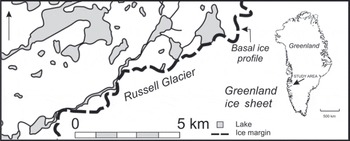
The ice margin at the study site is relatively stable and has maintained its position at least since the Little Ice Age. During the 1968–2002 advance of parts of the ice margin (Reference Knight, Jennings, Waller and RobinsonKnight and others, 2007), the studied section of the ice margin is believed to have increased in ice thickness, whereas since 2002 ice thickness has decreased.
Basal Ice Stratigraphy
For this study, a vertical basal ice profile was selected at a location where ice flow was perpendicular to the ice margin and all primary basal ice facies were accessible. There were no signs of deformation, thrusting or duplication in the profile that might unnecessarily complicate the basal ice stratigraphy. Also, the site was not affected by the recent major jokulhlaups that drained an ice-dammed lake located 1 km westwards (A.J. Russell and others, unpublished information).
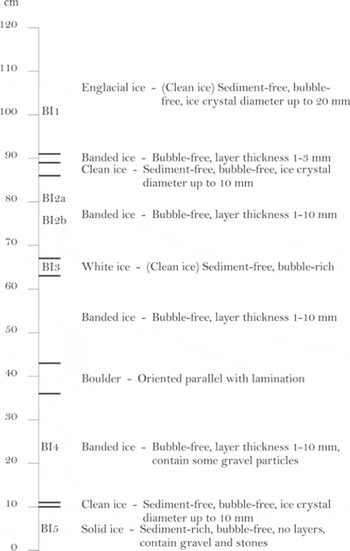
The stratigraphic log of the basal ice profile is shown in Figure 2. The profile has a thickness of 1.20 m and contains ten ice units defined by internal homogeneity.
Englacial ice: The upper unit had an outer appearance characterized by dispersed debris aggregates or ‘clots’ and was initially assumed to belong to what has previously been described as the clotted or dispersed facies (Reference KnightKnight, 1987, Reference Knight1989, Reference Knight1994, Reference Knight1997; Reference SugdenSugden and others, 1987; Reference Knight, Sugden and MintyKnight and others, 1994, Reference Knight, Waller, Patterson, Jones and Robinson2002; Reference Waller, Hart and KnightWaller and others, 2000). However, when the outermost 20 cm was carefully removed, the unit appeared clean without any visible debris ‘clots’. Also, the ice crystals were bubble-free and larger than in other basal ice units. As the unit had no apparent basal ice origin, we refer to this unit as englacial ice.
Banded ice: These units were characterized by intercalating debris-rich and debris-free layers with a general thickness of 1–3 mm. There were no visible bubbles in the debris-rich or debris-poor layers. These units have previously been classified as a subfacies of stratified basal ice (e.g. Reference Waller, Hart and KnightWaller and others, 2000), but will be ascribed as banded ice according to the non-genetic nomenclature (Reference Hubbard, Cook and CoulsonHubbard and others, 2009).
Clean ice: Where the ice thickness of the debris-free layers exceeded 10 mm, these layers were defined as separate clean ice facies.
White ice: This layer of clean ice had a white appearance due to a high content of dispersed bubbles. It was genetically classified as névé, i.e. snow compressed into glacier ice. Although névé formation in basal ice has not received much attention, it is in fact a common facies in basal ice (e.g. Reference KnightKnight, 1987).
Boulder: The profile contained a single boulder aligned parallel to the lamination. The boulder did not belong to a single facies, and layers deformed around it.
Solid ice: The lowest facies had no layered structure and no bubbles and appeared as frozen till. This solid ice facies continued beneath the profile, as the contact with bedrock was not accessible because the lower part of the profile was covered by a thick mud apron.
Stratigraphic log of basal ice facies characteristics in the studied profile.
Sampling and Analytical Methods
Sampling was conducted by carefully removing the outermost 20cm using an ice axe. Samples were collected in polyethylene soil sample bags and acid-cleaned polypropylene bottles from the englacial facies (BI1), the upper banded facies (BI2a and BI2b), the white ice facies (BI3), the lower banded facies (BI4) and the solid facies (BI5) (Fig. 2). After return to the field station, a part of the sampled material was stored frozen at –20°C for later analysis in the laboratory at Aarhus University, Denmark, including community analysis, and another part was in storage at 5°C for studies that were carried out in the field laboratory, including activity measurements.
Debris concentration and particle size of particles <2 mm in diameter were measured by evaporation and laser diffraction, respectively. The mineralogical composition was analyzed by X-ray diffraction. The organic carbon and sulfur content was measured using a LECO furnace. Stable oxygen isotope analyses were performed at the Niels Bohr Institute, University of Copenhagen, Denmark, using mass spectrometry with a precision in the δ value of ±0.1 %. Deuterium isotope analyses were performed at the AMS 14C Dating Centre, Aarhus University, with a ratio precision of ±0.5%.
The concentration of Fe2+ in the sediment was measured in duplicates by the ferrozine method (Reference StookeyStookey, 1970). In brief, 0.1 cm3 of sediment was transferred with a tip-cut 1.0 mL plastic syringe to an Eppendorf tube containing 2 mL of ferrozine solution, and incubated in the dark at room temperature for 20 min. The absorbance of the red complex was determined spectroscopically at 540 nm, and determined concentrations were compared with standard Fe2+ solutions. Measurements were repeated after 8.5 and 20 hours. Mossbauer spectroscopy was performed on solid ice facies sediment in order to determine the presence of various Fe-containing minerals (Reference Greenwood and GibbGreenwood and Gibb, 1971; Reference Stevens, Khasanov, Miller, Pollak and LiStevens and others, 1998; Reference Bruun, Finster, Gunnlaugsson, Nørnbergand and FriedrichBruun and others, 2010). Presence of bioavailable nanoparticulate Fe was determined by treating the solid ice facies sample with an ascorbate solution (FeA), which extracts fresh, nanoparticulate ferrihydrite, and subsequently with a sodium dithionite solution (FeD), which extracts aged, nanoparticulate ferrihydrite and goethite, hematite and lepidocrocite, following the protocol by Reference Raiswell, Benning, Davidson and TranterRaiswell and others (2008b, Reference Raiswell, Benning, Davidson, Tranter and Tulaczyk2009).
Activity measurements
Oxygen consumption was followed with a Clark-type microelectrode in triplicate sediment suspensions that were prepared as follows: 1 cm3 of homogenized solid ice sediment was transferred to a 5 mL Exetainer® with a 1 mL tip-cut plastic syringe. The Exetainer® was then filled to the rim with well-aerated water prepared from melted glacier ice. It was closed with a lid without leaving air bubbles and shaken vigorously. Prior to each oxygen measurement the Exetainers® were shaken. The electrode was carefully inserted into the suspension without stirring. It was calibrated with well-aerated ice water and a 1 M ascorbate solution (Reference Revsbech, Jørgensen and MarshallRevsbech and Jørgensen, 1986). The procedure was repeated at regular intervals. The chemical consumption of oxygen was determined with samples poisoned with 0.3 mL of 10% ZnCl2 solution.
Nitrate reduction was determined using a similar set-up to that for oxygen consumption measurements. After depletion of oxygen, 15N-labeled NO3 − (final concentration 100 μM) was added from a sterile stock solution. The Exetainers® were closed and incubated at room temperature in the dark for 28 hours. The incubation was stopped by the addition of 0.3 mL of 10% ZnCl2 solution. The formation of 30N2 was determined with a mass spectrometer as described by Reference NielsonNielsen (1991).
Sulfate reduction rates were measured using 35S-labeled SO4 2-. One cm3 of sediment was suspended in dithionite-reduced ice water in 5 mL Exetainers® leaving no air bubble. Soil suspensions were amended with H2 35SO4 to a final activity of 100 kBqmL−1 sediment suspension and incubated for 42 hours at room temperature and stopped by the addition of 0.3 mL of 10% ZnCl2 solution. The formation of sulfide was analyzed by combined chromium and acid distillation as described by Reference Fossing and JørgensenFossing and Jørgensen (1989).
Microbiological studies
For total cells counts, 1 cm3 of sediment was transferred to pre-weighted 50 mL centrifuge tubes containing 1.0 mL 100mm sodium pyrophosphate (pH 7.5), 7.0 mL Milli-Q water and 1.0 mL 25% (v/v) glutaraldehyde, and incubated for 15 min at 4°C followed by weighing and vortexing. The suspension was ultrasonicated for 3 × 20 s at 35% intensity while kept on ice. Milli-Q water was added to a final volume of 40 mL. 40 m L was transferred to 10 mL 1 × PBS containing 2 μL 10.000x SYBR Gold using a pipette with a cut-off tip, and incubated in the dark at 4°C for 15 min. Five mL of the stained suspension was filtered onto a 0.2 μm pore size black polycarbonate filter (filter chimney diameter 16.23 mm), which was subsequently rinsed with 5 mL Milli-Q water. The filters were mounted with Citifluor containing 1 μgmL−1 DAPI and counted at 1000× magnification (Reference HansenHansen and others, 2007).
The metabolic potential of the aerobic microbial community was assessed with EcoLogTM plates. Prior to inoculation, 5 cm3 of sediment was suspended in 20 mL of a 50 mm sodium pyrophosphate solution. The suspension was vortexed for 1 min and the particles were allowed to settle for 1 hour. The EcoLogTM plates were inoculated with sterile pipettes according to the manufacturer’s instructions and incubated at 15°C in the dark. The incubations were scored positive when a red color indicating the formation of tetrazolium salt became visible. Plates were only evaluated when the negative control wells remained clear (Reference HansenHansen and others, 2007).
Heterotrophic aerobic bacteria were cultured on R2A (Difco) agar plates. One cm3 of sediment was diluted in 9 mL of autoclaved ice water and 100 mL were streaked on the agar plates (Reference HansenHansen and others, 2007). Clostridia were enriched in tenfold serial dilution in Clostridium broth (Difco) under anaerobic conditions (Reference HansenHansen and others, 2007).
Molecular studies
DNA was extracted from sediment samples and colonies of cultured microbes using the FastDNA spin kit for soil (Bio 101, CA). The extracted amount of DNA was quantified using a nanodrop device. A clone library was constructed as described by Reference HansenHansen and others (2007) except that the M13F primer used was 5’–TGTAAA ACG ACG GCC AGT–3’ to generate partial sequences. Sequencing was accomplished by the commercial company Macrogen (South Korea).
Sequences were compared to the current database of the rRNA gene sequence from GenBank using the BLAST search tool (Reference AltschulAltschul and others, 1997). Clone library sequences were classified using the RDP Naïve Bayesian rRNA Classifier Version 2.0 (Reference Wang, Garrity, Tiedje and ColeWang and others, 2007).
Accession numbers: HM439882–HM439950; HQ144215–HQ144221.
Results
Physical characteristics
The basal ice environment along this section of the GIS margin is well described (Reference SugdenSugden and others, 1987; Reference KnightKnight, 1987, Reference Knight1989, Reference Knight1994, Reference Knight1997; Reference Knight, Sugden and MintyKnight and others, 1994, Reference Knight, Waller, Patterson, Jones and Robinson2002; Reference Waller, Hart and KnightWaller and others, 2000; Reference Adam and KnightAdam and Knight, 2003). However, since the basal ice microbiology has not been examined in previous studies, the linkage between basal ice formation processes and basal ice microbial community structures has yet to be determined. An important step to achieve this knowledge is to provide detailed analyses of basal ice-facies environments in relation to subglacial microbial investigations.
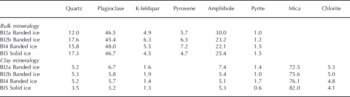
In the Russell Glacier profile, the bulk mineral composition of the debris-containing samples (BI2a, BI2b, BI4 and BI5) was uniform and primarily constituted of plagioclase and amphibole (Table 1). This differs from previously presented results of two samples of banded ice and one sample of solid ice (0.063–0.25 mm fraction), where the proportion of quartz constituted 40% and 60%, respectively (Reference Knight, Sugden and MintyKnight and others, 1994). The pyroxene-to-plagioclase ratio (0.10–0.15) was low and indicated no sorting due to mineral-specific gravity variations. The lack of gravity sorting is in accordance with similar analyses of basal ice beneath Kuannersuit Glacier, Greenland (Reference YdeYde and others, 2005). Abrasion at the glacier bed produced fine-grained glacier flour composed mainly of mica (Table 1). The highest proportion of mica was found in the solid ice facies, but additional sampling is needed to confirm whether this is a distinct feature.
Bulk and clay mineralogical composition of banded and solid ice facies in basal ice profile at the GIS margin in West Greenland. The proportions are expressed in % by mass
Debris concentrations by mass (<2 mm in diameter) and grain-size distributions are shown in Table 2. The highest debris concentrations were found in solid ice and the lowest banded ice facies. The grain size distributions show that clay-sized particles constituted only 4–6%, whereas silt-to-sand ratios were 52–114% by mass. There were no indications of sorting due to grain size on a profile scale, but sorting may occur within debris bands.
Debris concentration by mass (%) and grain-size distribution (<2 mm in diameter) by mass (%) in basal ice profile at the GIS margin
The carbon content in basal ice derived primarily from organic carbon, whereas the proportion of carbon from carbonate minerals was within the analytical detection limit (Table 3). The sulfur content in the debris bands was small and within the analytical detection limit. In contrast, the solid ice facies contained a significant proportion of both organic and pyritic sulfur. These findings indicate that, despite centuries of glacier cover, the solid ice facies contains some organic carbon and sulfur that may be a potential energy source for heterotrophic as well as lithotrophic microorganisms. Carbonate minerals (e.g. disseminated calcite) may serve as a carbon source for autolithotrophic microbes in this environment. Pyrite is widely distributed in all debris-rich facies and may serve as a microbial sulfur source. The Mössbauer spectroscopic analysis of the solid ice facies showed that, in addition to pyrite, Fe2+-containing pyroxene and garnet are present and also Fe-containing serpentinite, magnetite and hematite. Thus, Fe with various oxidation states is available from at least six different authigenic minerals. Few bioavailable Fe nanoparticulates were detected in the solid ice facies (0.032%FeA). This is similar to previous findings from glaciers (Reference Raiswell, Benning, Tranter and TulaczykRaiswell and others, 2008a) and less than in nearby turbid glacier meltwater (0.049%FeA; 0.197%FeD).
Carbon and sulfur composition of banded and solid ice facies in basal ice profile at the GIS margin. The proportions are expressed in % by mass of the total debris content
Stable water co-isotope analysis is a powerful tool to assess basal ice formation processes. The δ18O values in the basal ice facies ranged between –24.6% and –27.1%, whereas the englacial ice facies had a lower 18O content (Table 4). This trend is in accordance with a previous study of basal ice isotopic fractionation at Russell Glacier (Reference KnightKnight, 1989). Figure 3 shows a co-isotope diagram, where basal ice samples are plotted together with the global meteoric waterline (GMWL), two local Greenlandic waterlines (LMWL; data from International Atomic Energy Agency (IAEA)/World Meteorological Agency (WMO), http://www.iaea.org/water), an englacial line from Russell Glacier (Reference KnightKnight, 1989) and a line based on five samples of debris-rich basal ice bands from Russell Glacier (Reference KnightKnight, 1989). If the white ice (BI3) is excluded, the slope of the remaining samples of 7.74 is close to the slope of the GMWL, the Thule LMWL and the englacial ice. The isotopic distinction between englacial ice and debris bands found by Reference KnightKnight (1989) was not apparent in our profile. It is therefore not possible to determine the ice facies and subglacial isotopic fractionation solely by a co-isotope analysis. The white ice (BI3) has a higher deuterium excess value than the other ice facies (Table 4; Fig. 3) and plots close to meteoric waterlines. The remaining samples have deuterium excess values between 2.0 and 4.2 and show no apparent correlation with δD (or δ18O). This may indicate that the local meteoric water has an average deuterium excess value within this range, or that the basal ice facies composition is influenced by kinetic parameters (e.g. freezing rate, diffusion rate, boundary layer thickness) or by partial freezing of parent waters or non-equilibrium processes and variations in parent water.
The δ18O, δD and deuterium-excess characteristics (%) in basal ice profile at the GIS margin
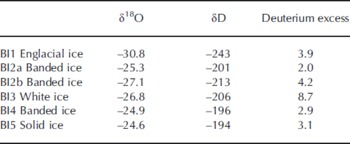
(a) δD–δ18O diagram showing the isotopic composition of basal ice facies in relation to the global meteoric waterline (GMWL), the local meteoric waterlines (LMWL) in Grønnedal and Thule (IAEA/WMO, http://www.iaea.org/water), and the englacial and debris band lines at Russell Glacier (Reference KnightKnight, 1989). (b) Deuterium-excess–δD diagram of basal ice facies.

Microbiological investigations
Oxygen consumption in the sediment was equally driven by biological and chemical oxygen consumption. Poisoning of subsamples with ZnCl2 indicated that chemical oxygen consumption accounted for ∼ 5 0% of the overall oxygen consumption, probably due to the re-oxidation of Fe2+ that was present in high concentration (Table 5). All the added 15N-NO3– was consumed within 28 hours of incubation and transformed into 30N-dinitrogen gas, thus indicating that nitrate reduction was primarily carried out by denitrifying bacteria. No signs of sulfate reduction were detected after 42 hours of incubation with 35S-SO4 2–.
Bacterial abundance, oxygen consumption rates, nitrate reduction and sulfate reduction in solid basal ice at the GIS margin

The ability to digest different classes of organic compounds was evaluated with the EcoLogTM system. The following compounds were oxidized consistently (three out of three cases): the surfactant Tween 80, the polysaccharide α-cyclodextrin, the di-saccharides D-cellobiose and α-D-lactose, the sugars β-methyl-D-glucoside and D-xylose, the alcohol sugars i-erythritol and D-mannitol, the dicarboxylic acid itaconic acid, the amino acids L-arginine and L-asparagine and the dipeptide glycyl-L-glutamic acid. The oxidation of sugar glucose-1-phosphate was observed in two out of three cases, and oxidation of fatty acid γ-hydroxybuturic acid, amino-sugar N-acetyl-D-glucosa-mine, amino acid L-threonine and amine phenylethylamine in one out of three cases.
Microbial diversity
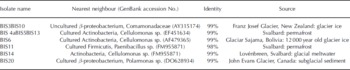
Pure cultures and enrichments were obtained both under aerobic and anaerobic conditions. On R2A plates, ∼20 000 colony-forming units (cfu) could be obtained from 1 cm3 of sediment. This is ∼ 0 . 1% of the total cell counts (Table 5). Most of the colonies had beige to white color and entire and smooth edges. No filamentous colonies or fungi were observed despite the absence of fungicide in the growth medium. Twenty colonies were selected for further investigations, of which nine currently have successfully been sequenced (Table 6). All nine colonies were most closely related to strains that inhabit glacial niches or permafrost. All isolates grew well at 4°C. In broth that stimulated growth of clostridia, >104 cells were counted upon serial dilution. A more precise estimate cannot be provided, since growth occurred in the highest inoculated dilution. The presence of spores, as was revealed by microscopic inspection, confirmed that clostridium-related microorganisms were present in the highest positive dilutions. Isolation of spore-formers has not been accomplished yet.
Sequenced colonies in solid basal ice at the GIS margin and their nearest neighbours (GenBank)
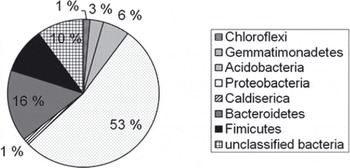
In total, 90 clones were sequenced, of which 70 provided high-quality sequences. The clone library was dominated by Proteobacteria sequences (37), of which 28 clustered with the β-subdivision, 7 with the α-subdivision and 2 with the δ -subdivision (Fig. 4). Of the 28 β-proteobacteria, 12 were most closely related to members of the genus Rhodoferax in the order Burkholderiales, 6 could only be classified on the class level, while the remaining 10 grouped with other classified lineages of the β-subdivision. The second most abundant phylum was Bacteroidetes; of the 11 sequences, 6 fell into the order Sphingobacteriales, 1 into the order Bacteriodales and 1 into the order Flavobacteriodales. Three sequences that affiliated with the Bacteroidetes phylum remained unclassified. The third most abundant phylum was Firmicutis. Of the 7 sequences, 6 fell into the order Clostridiales and 1 into the order Bacillales. In addition, the following phyla were represented (number of sequences): Chloroflexi (1), Gemmatimonadetes (2), Acidobacteria (4), Actinobacteria (4) and Caldiserica (1). Three sequences could not be classified at the phylum level.
Distribution of cloned 16S rRNA sequences from a basal-ice clone library (70 clones) within major bacterial phyla. The sequences were classified with the RDP classifier online tool.
Discussion
Since the sample that we investigated was frozen at the time of sampling but all investigations were carried out on thawed sediment, we cannot tell whether the microorganisms could have been active in the frozen state or were reactivated upon thawing. Metabolic activity down to –40°C has been demonstrated by Reference Panikov, Flanagan, Oechel, Mastepanov and ChristensenPanikov and others (2006), investigating the lower temperature limits of microbial permafrost communities. Similar observations have, however, not been reported yet from subglacial habitats.
The high concentration of Fe2+ in the solid ice facies indicates that oxygen was absent at the time of sampling and that solid ice thus provides an excellent niche for strict or facultative anaerobic microorganisms thriving either on fermentation or using alternative electron acceptors (e.g. nitrate, sulfate or iron oxides). This is also reflected by the outcome of both culture-dependent and -independent investigations, where we were able to culture both aerobic and anaerobic microorganisms. The latter are represented by the enrichment of spore-formers, most likely Clostridia, in high serial dilutions. We have also successfully enriched iron-reducers that are currently in the process of isolation (data not shown). The high denitrification potential supports the presence of a facultative anaerobic microbial community. Reference Straub, Benz, Schink and WiddelStraub and others (1996) have demonstrated that denitrifiers thrive on the oxidation of ferrous iron when coupled to the reduction of nitrate, a process that may also take place in basal ice and subglacial sediments driven by high concentration of dissolved Fe2+. In contrast to what has been reported by Reference Wadham, Bottrell, Tranter and RaiswellWadham and others (2004) from Finster-walderbreen, Svalbard, sulfate reduction activity could not be detected in the solid ice facies even by the highly sensitive 35S–SO4 2– radiotracer method.
Total cell counts in the range of 108 cells cm−3 sediment are comparable to numbers reported from Glacier de Tsanfleuron, Swiss Alps, (Reference Sharp, Parkes, Cragg, Fairchild, Lamb and TranterSharp and other, 1999) and Midtre Lovénbreen, Svalbard (Reference ReddyReddy and others, 2009). The proportion of microorganisms that could be cultured on R2A medium under aerobic conditions represented only 0 . 1% of the total cell counts, which is at the low end of what has been reported in comparable studies (see review by Reference HodsonHodson and other, 2008). Although we have only sequenced a limited number of aerobic isolates so far, we find it interesting that all nine cultures had closest relatives among cultures that were retrieved from permanently cold habitats such as glacial ice or subglacial deposits (Reference FoghtFoght and others, 2004; Reference Skidmore, Anderson, Sharp, Foght and LanoilSkidmore and others, 2005) or permafrost (Reference HansenHansen and others, 2007).
The origin of high concentrations of dissolved Fe2+ can derive from chemical and/or biologically mediated processes. The mineralogical composition of the bedrock that is rich in diverse iron minerals, as shown by Mössbauer spectroscopy, and contains authigenic Fe nanoparticulates allows Fe2+ release through chemical weathering and biological reduction. Support for the latter possibility is given by the composition of the microbial community revealed by cloning and sequencing and by the successful enrichment of iron reducers (data not shown). In particular, the abundance of Rhodoferax-related sequences is a good indication for an iron-reducing potential among the community members. Also the presence of a Geobacter-related sequence supports a microbial component in Fe2+ production. The predominance of Rhodoferax-related over Geo-bacter-related sequences may indicate that periods of oxia have taken place prior to the formation of the solid ice facies. In contrast to Geobacter strains, Rhodoferax strains are facultative anaerobes that thrive well with oxygen as electron acceptor. The abundance of Rhodoferax relatives in subglacial habitats has also been reported from Bench Glacier, Alaska, and John Evans Glacier, Canadian High Arctic, (Reference Skidmore, Anderson, Sharp, Foght and LanoilSkidmore and others, 2005; Reference Bhatia, Sharp and FoghtBhatia and others, 2006; Reference Cheng and FoghtCheng and Foght, 2007) and recently from the West Antarctic ice sheet (Reference LanoilLanoil and others, 2009). Also, Reference Tung, Price, Bramall and VrdoljakTung and others (2006) reported on the presence of metabolically active iron reducers at the bottom of a GIS core (Greenland Ice Sheet Project 2 (GISP2)) that may be responsible for production of Fe2+ similar to what we observe.
In the Bench Glacier and John Evans Glacier studies, β -proteobacteria were most abundant and similar to this study, accounting for >50% of the retrieved sequences. However, it has not yet been explained why this group, though cosmopolitan in subglacial habitats, is dominant. Since these studies are based on polymerase chain reaction (PCR) and cloning, both of which may introduce biases and therefore cannot be considered quantitative, it cannot yet be concluded that these observations reflect the real situation. This is also the case for the Bacteroidetes phylum. As in the other studies, the sequences in our study belonging to the phylum Bacteroidetes are the second most abundant. Also we cannot exclude that the dominance is due to bias. The dominance of Proteobacteria and Bacteroidetes was also found in a PCR- and cloning-independent study of a glacier ice metagenome (Reference Simon, Wiezer, Strittmatter and DanielSimon and others, 2009), indicating that the dominance of both phyla in glacial habitats is likely to be real. Still, additional investigations using fluorescence in situ hybridization (FISH) or other quantitative methods are needed to determine the significance of the different phyla in the Russell Glacier solid ice facies. In addition to the sequences that affiliate with heterotrophic bacteria, we found several sequences that affiliate with the lithotrophic iron oxidizers within the genera Gallionella and Ferritrophicum, also members of the β-proteobacterium subdivision. In addition to iron oxidizers, we retrieved sequences closely related to the likewise lithotrophic but ammonium-oxidizing Nitrosospira group. These organisms, which are microaerophilic but obligate aerobes, depend on oxygen for their metabolism. Their presence may be taken as an indication for periodic oxygen intrusion.
The microbial community structure in basal ice facies is likely to be conditioned by basal ice formation processes such as regelation, basal freeze-on, thrusting, ice metamorphosis and apron overriding because these processes control mineral composition and grain size of entrained debris in various ways (e.g. Reference BoultonBoulton, 1978) and thereby control potential energy sources for lithotrophic microorganisms. The solid ice facies differs from the overlying debris bands in having a relatively higher mica content, higher debris concentration and higher organic and pyritic sulfur content, indicating that solid ice facies is in a less weathered state than the debris bands. The lack of mineral and grain-size sorting effects indicates that the debris bands most likely formed by similar entrainment processes to the solid ice facies (Reference Knight, Waller, Patterson, Jones and RobinsonKnight and others, 2002). This is supported by the co-isotopic analysis, which shows no apparent differences between the solid ice facies and debris bands. Therefore, as there is little physical deviance between solid ice and debris bands, we hypothesize that the microbiological community found in solid ice is similar to what can be expected in debris-rich banded ice facies. In contrast, the co-isotopic analysis confirms that the white ice facies is meteoric in origin, and it is very likely to harbor a subglacial microbial ecosystem, which is different from the ecosystem found in solid ice facies.
Overall our results confirm the new paradigm that subglacial environments, though dark and cold, are by no means deprived of life. We extend this observation to solid ice facies at the western margin of the GIS, which contains a large and diverse community of heterotrophic and lithotrophic microorganisms. However, their way of life needs to be revealed in order to understand their functioning in basal ice ecosystems and their interaction with the litho- and glaciospheres.
Conclusions and Perspectives
Basal ice from the GIS margin contains a diverse population of both aerobic and anaerobic bacteria, thus confirming what has already been reported from glaciers worldwide but extending these observations to a hitherto microbiologically unexplored region. The dominance of the clone library by β-proteobacteria and Bacteroidetes adds to what has been reported from other glacier beds. This observation is still unexplained and awaits careful studies of isolates from these phyla to determine whether they have a specific genetic make-up that supports survival under these extreme conditions. These findings may even find interesting biotechnological applications.
We are very well aware of the limits of this study, since it deals with a single sample, taken at a single point in time. We hope, however, that it will attract the attention of other researchers in the field and that it will integrate into a long list of coordinated investigations of the microbiota, its diversity and activity beneath, within and on the surface of the GIS. In order to better assess microbiological deviations in basal ice and subglacial sediments and to determine potential linkages to distinct ice facies, more comprehensive surveys are needed in the Russell Glacier area and around the GIS. The latter would demand a coordinated approach by numerous research groups.
Acknowledgements
This study was funded by the Commission for Scientific Research in Greenland (KVUG; project No. 495229) and Carlsbergfondet. We thank T. Wiegers for valuable field and laboratory assistance. The Kangerlussuaq International Science Support (KISS) centre provided logistic assistance. This is publication No. A310 from the Bjerknes Centre for Climate Research.


