


Impact Statement
This paper introduces a general nonparametric framework of the past climate reconstruction based on a Gaussian process state-space model, which has a great potential to be extended to more elaborate models or to be applied to other proxies with their own calibration curves.
1. Introduction
The alkenone biolipid is a popular proxy for reconstructing past sea surface temperatures (SSTs) because different SST environments make alkenone-producing species alter the relative proportion of di- and tri-unsaturated $ {\mathrm{C}}_{37} $
alkenones, which brings different values of
$ {\mathrm{C}}_{37} $
alkenones, which brings different values of $ {\mathrm{U}}_{37}^{\mathrm{K}\mathrm{\prime }}={\mathrm{C}}_{37:2}/({\mathrm{C}}_{37:2}+{\mathrm{C}}_{37:3}) $
(Tierney and Tingley, Reference Tierney and Tingley2018). This relationship allows to the reconstruction of past SSTs by exploiting the relationship between SST and past
$ {\mathrm{U}}_{37}^{\mathrm{K}\mathrm{\prime }}={\mathrm{C}}_{37:2}/({\mathrm{C}}_{37:2}+{\mathrm{C}}_{37:3}) $
(Tierney and Tingley, Reference Tierney and Tingley2018). This relationship allows to the reconstruction of past SSTs by exploiting the relationship between SST and past $ {\mathrm{U}}_{37}^{\mathrm{K}\prime } $
observations. To be specific, the relationship is formulated as a calibration curve, which includes functions of estimates and errors. Tierney and Tingley (Reference Tierney and Tingley2018, Table 1) provide a table of some popular calibration curves. For example, Müller et al. (Reference Müller, Kirst, Ruhland, von Storch and Rosell-Melé1998) define a linear calibration curve by
$ {\mathrm{U}}_{37}^{\mathrm{K}\prime } $
observations. To be specific, the relationship is formulated as a calibration curve, which includes functions of estimates and errors. Tierney and Tingley (Reference Tierney and Tingley2018, Table 1) provide a table of some popular calibration curves. For example, Müller et al. (Reference Müller, Kirst, Ruhland, von Storch and Rosell-Melé1998) define a linear calibration curve by $ {\mathrm{U}}_{37}^{\mathrm{K}\mathrm{\prime }}=0.033\cdot \mathrm{S}\mathrm{S}\mathrm{T}+0.044+0.0495\cdot \varepsilon $
, where
$ {\mathrm{U}}_{37}^{\mathrm{K}\mathrm{\prime }}=0.033\cdot \mathrm{S}\mathrm{S}\mathrm{T}+0.044+0.0495\cdot \varepsilon $
, where $ \varepsilon $
is a standard normal random variable.
$ \varepsilon $
is a standard normal random variable.
Notice that the posterior distribution of SSTs is given analytically if the calibration curve is linear and the prior on SST is noninformative. For example, the calibration model of Müller et al. (Reference Müller, Kirst, Ruhland, von Storch and Rosell-Melé1998) can be converted into $ \mathrm{S}\mathrm{S}\mathrm{T}=({\mathrm{U}}_{37}^{\mathrm{K}\mathrm{\prime }}-0.044)/0.033+1.5\cdot \varepsilon $
. However, analytic posteriors are usually not available for nonlinear calibration curves and priors. Therefore, a typical SST reconstruction relies on the Markov-chain Monte Carlo sampling to approximate the posterior distribution of SST given
$ \mathrm{S}\mathrm{S}\mathrm{T}=({\mathrm{U}}_{37}^{\mathrm{K}\mathrm{\prime }}-0.044)/0.033+1.5\cdot \varepsilon $
. However, analytic posteriors are usually not available for nonlinear calibration curves and priors. Therefore, a typical SST reconstruction relies on the Markov-chain Monte Carlo sampling to approximate the posterior distribution of SST given $ {\mathrm{U}}_{37}^{\mathrm{K}\prime } $
by drawing samples from the likelihood proportional to the calibration curve (and the prior).
$ {\mathrm{U}}_{37}^{\mathrm{K}\prime } $
by drawing samples from the likelihood proportional to the calibration curve (and the prior).
One systemic drawback of such reconstruction methods stems from the fact that only few $ {\mathrm{U}}_{37}^{\mathrm{K}\prime } $
observations are available at each age (typically, at most 1), which might lead the inference to be very unstable. For example, the above reconstruction cannot determine whether the given
$ {\mathrm{U}}_{37}^{\mathrm{K}\prime } $
observations are available at each age (typically, at most 1), which might lead the inference to be very unstable. For example, the above reconstruction cannot determine whether the given $ {\mathrm{U}}_{37}^{\mathrm{K}\prime } $
observation is an outlier by itself, unless other information used for SST reconstruction is available. To overcome it, one typical approach is to make the SSTs correlated over ages, that is, to model a series of past
$ {\mathrm{U}}_{37}^{\mathrm{K}\prime } $
observation is an outlier by itself, unless other information used for SST reconstruction is available. To overcome it, one typical approach is to make the SSTs correlated over ages, that is, to model a series of past $ {\mathrm{U}}_{37}^{\mathrm{K}\prime } $
observations and the associated SSTs given their ages by a state-space model (Hangos et al., Reference Hangos, Szederkényi, Lakner and Gerzson2001). In this framework, a calibration curve defines the emission model while the prior on SSTs is the transition model of the state-space model. Now the problem is how to define the transition model, especially if we lack the knowledge regarding the dynamics of SSTs over ages. One advantage of the state-space model is that an SST estimation is available at any age, which is given as a posterior predictive distribution.
$ {\mathrm{U}}_{37}^{\mathrm{K}\prime } $
observations and the associated SSTs given their ages by a state-space model (Hangos et al., Reference Hangos, Szederkényi, Lakner and Gerzson2001). In this framework, a calibration curve defines the emission model while the prior on SSTs is the transition model of the state-space model. Now the problem is how to define the transition model, especially if we lack the knowledge regarding the dynamics of SSTs over ages. One advantage of the state-space model is that an SST estimation is available at any age, which is given as a posterior predictive distribution.
In this work, we introduce a nonparametric state-space model for the SST reconstruction from the alkenone proxy. To be specific, a Gaussian process prior defines the transition model that correlates the SSTs over ages and SST samples are drawn from the posterior by the Hamiltonian Monte Carlo algorithm (Neal, Reference Neal2010; Gelman et al., Reference Gelman, Carlin, Stern, Dunson, Vehtari and Rubin2013). We also applied the model to nine sediment cores reaching up to 800 ka bp, to reconstruct SSTs from their alkenone proxies. In Section 2, our model will be described in the mathematical formulations. Data and SST reconstruction results are given in Section 3. The paper ends with a short discussion and conclusion in Section 4.
2. Method
Throughout the paper, we use the following notations:
-
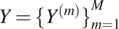
• $ Y={\{{Y}^{(m)}\}}_{m=1}^M $
: a set of past
$ {\mathrm{U}}_{37}^{\mathrm{K}\prime } $
observations, where
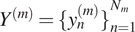
$ {Y}^{(m)}={\{{y}_n^{(m)}\}}_{n=1}^{N_m} $
is from sediment core
$ m $
.
$ Y={\{{Y}^{(m)}\}}_{m=1}^M $
: a set of past
$ {\mathrm{U}}_{37}^{\mathrm{K}\prime } $
observations, where
$ {Y}^{(m)}={\{{y}_n^{(m)}\}}_{n=1}^{N_m} $
is from sediment core
$ m $
. -
•
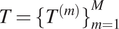
$ T={\{{T}^{(m)}\}}_{m=1}^M $
: a set of ages of past
$ {\mathrm{U}}_{37}^{\mathrm{K}\prime } $
observations, where
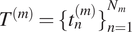
$ {T}^{(m)}={\{{t}_n^{(m)}\}}_{n=1}^{N_m} $
. -
•
$ X={\{{X}^{(m)}\}}_{m=1}^M $
: a set of unknown SSTs of past
$ {\mathrm{U}}_{37}^{\mathrm{K}\prime } $
observations, where
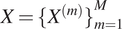
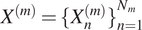
$ {X}^{(m)}={\{{X}_n^{(m)}\}}_{n=1}^{N_m} $
. -
•
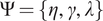
$ \Psi =\{\eta, \hskip2pt \gamma, \hskip2pt \lambda \} $
: a set of kernel hyperparameters of the kernel function
$ \unicode{x1D542} $
, which are to be estimated. -
•
$ \Theta ={\{{\alpha}_m,\hskip2pt {\beta}_m\}}_{m=1}^M $
: a set of core-specific scale and shift parameters to be estimated. -
•
$ \mu $
: a given function that maps ages to SSTs, which come from the prior knowledge of past standardized SSTs. -
•
$ \mathcal{C}=\{\delta, \hskip2pt \sigma \} $
: a calibration curve where
$ \delta $
and
$ \sigma $
are
$ {\mathrm{U}}_{37}^{\mathrm{K}\prime } $
’s mean and standard deviation function of SSTs, respectively.








Also, for making the formulations succinct, let $ {\boldsymbol{\unicode{x03BC}}}_{\mathrm{A}} $
be a vector of which entry is
$ {\boldsymbol{\unicode{x03BC}}}_{\mathrm{A}} $
be a vector of which entry is $ \mu (a) $
for each
$ \mu (a) $
for each $ a\in \mathrm{A} $
and
$ a\in \mathrm{A} $
and $ {\unicode{x1D542}}_{\mathrm{AB}} $
be a matrix of which entry is
$ {\unicode{x1D542}}_{\mathrm{AB}} $
be a matrix of which entry is $ \unicode{x1D542}\left(a,b\right) $
for each pair
$ \unicode{x1D542}\left(a,b\right) $
for each pair $ \left(a,b\right)\in \mathrm{A}\times \mathrm{B} $
. In addition, we assume that both
$ \left(a,b\right)\in \mathrm{A}\times \mathrm{B} $
. In addition, we assume that both $ \delta $
and
$ \delta $
and $ \sigma $
are continuously differentiable.
$ \sigma $
are continuously differentiable.
2.1. Gaussian process state-space model
The Gaussian process state-space (GPST) model (Frigola et al., Reference Frigola, Chen and Rasmussen2014; Eleftheriadis et al., Reference Eleftheriadis, Nicholson, Deisenroth and Hensman2017) is a nonparametric state-space model that adopts a Gaussian process as the transition model with unlimited memory, which means that it does not take the Markovian assumption. More specifically, it consists of the following two models for each sediment core $ m $
:
$ m $
:
-
• Emission model:
 $$ p({Y}^{(m)}|{X}^{(m)})=\prod \limits_{n=1}^{N_m}\mathcal{N}({y}_n^{(m)}|\delta ({X}_n^{(m)}),\sigma {({X}_n^{(m)})}^2). $$
-
• Transition model:
 $$ p\left({X}^{(m)}|{T}^{(m)}\right)\hskip0.35em =\hskip0.35em \mathcal{N}\left({X}^{(m)}|{\mu}_{T^{(m)}}+{\beta}_m,{\alpha}_m^2\left({\unicode{x1D542}}_{T^{(m)}{T}^{(m)}}+{\lambda}^2{\unicode{x1D540}}_{N_m}\right)\right). $$
Then, the posterior distribution of SSTs given $ {\mathrm{U}}_{37}^{\mathrm{K}\prime } $
and ages is given by
$ {\mathrm{U}}_{37}^{\mathrm{K}\prime } $
and ages is given by $ p\left({X}^{(m)}|{T}^{(m)},{Y}^{(m)}\right)\propto p\left({X}^{(m)}|{T}^{(m)}\right)p\left({Y}^{(m)}|{X}^{(m)}\right) $
and the posterior predictive distribution of the SST
$ p\left({X}^{(m)}|{T}^{(m)},{Y}^{(m)}\right)\propto p\left({X}^{(m)}|{T}^{(m)}\right)p\left({Y}^{(m)}|{X}^{(m)}\right) $
and the posterior predictive distribution of the SST $ x $
at an arbitrary age
$ x $
at an arbitrary age $ t $
and the location of the sediment core
$ t $
and the location of the sediment core $ m $
can be derived as follows:
$ m $
can be derived as follows:
 $$ p(x|t;{Y}^{(m)},\hskip2pt {T}^{(m)})=\int p(x|t;{X}^{(m)},\hskip2pt {T}^{(m)})p({X}^{(m)}|{T}^{(m)},\hskip2pt {Y}^{(m)}){dX}^{(m)}. $$
One advantage of the GPST model is that it does not require the proxy observations at regularly spaced ages because a Gaussian process is consistently defined over a set of inputs. Another advantage comes from its nonparametric form, which allows it to be free from certain parametric models that might require either strong prior knowledge or excessive assumptions.
2.2. Emission model
A calibration curve defines the emission model in the state-space model. Here, we will try the following three curves:
-
1. A linear calibration curve (MULLER) from Müller et al. (Reference Müller, Kirst, Ruhland, von Storch and Rosell-Melé1998), which is the most universal model for converting alkenone proxies into SSTs.
-
2. A nonlinear calibration curve (BAYSPLINE) from Tierney and Tingley (Reference Tierney and Tingley2018), which was constructed by a Bayesian B-spline regression model which considers the seasonality of the training dataset.
-
3. A nonlinear calibration curve (HGPR) from Lee and Lawrence (Reference Lee and Lawrence2019), which is a heteroscedastic Gaussian process regression model with considering outliers in the training dataset.
The above three curves are visualized in Figure 1. Notice that HGPR shows a consistent departure from MULLER and BAYSPLINE at lower temperatures and has considerable heteroscedasticity at high temperatures. Calibration curves are defined in the range between −1 and 31°C.
Three calibration curves. Each band indicates the 95% confidence band.

2.3. Transition model
The transition model in (2) can be explained in words as follows: “a core process is shared by all sediment cores, and it is shifted and scaled by its core-specific parameters,” which means that the standardized SSTs, $ \left({X}^{(m)}-{\mu}_{T^{(m)}}-{\beta}_m\right)/{\alpha}_m $
, of the sediment core
$ \left({X}^{(m)}-{\mu}_{T^{(m)}}-{\beta}_m\right)/{\alpha}_m $
, of the sediment core $ m $
follows a Gaussian process prior
$ m $
follows a Gaussian process prior $ \mathcal{N}\left(0,{\unicode{x1D542}}_{T^{(m)}{T}^{(m)}}+{\lambda}^2{\unicode{x1D540}}_{N_m}\right) $
.
$ \mathcal{N}\left(0,{\unicode{x1D542}}_{T^{(m)}{T}^{(m)}}+{\lambda}^2{\unicode{x1D540}}_{N_m}\right) $
.
The mean function $ \mu $
brings prior knowledge (“rough guess”) about the past standardized SSTs to the model. Here, we adopt reconstructed SSTs from Shakun et al. (Reference Shakun, Lea, Lisiecki and Raymo2015) for the prior knowledge, available up to 800 ka bp, and then define
$ \mu $
brings prior knowledge (“rough guess”) about the past standardized SSTs to the model. Here, we adopt reconstructed SSTs from Shakun et al. (Reference Shakun, Lea, Lisiecki and Raymo2015) for the prior knowledge, available up to 800 ka bp, and then define $ \mu $
by the interpolation.
$ \mu $
by the interpolation.
We chose the effective kernel for a two-layer GP where the kernels of the layers are both squared-exponential (SE) (Lu et al., Reference Lu, Yang, Hao and Shafto2020), which is defined by following, as the kernel function $ \unicode{x1D542} $
:
$ \unicode{x1D542} $
:
 $$ \unicode{x1D542}\left(u,v;\eta, \gamma \right)\triangleq {\left(1+{\eta}^2\left(1-\exp \left(-{\gamma}^2\cdot {\left|u-v\right|}^2\right)\right)\right)}^{-1/2}. $$
Notice that the above kernel converges to $ {\left(1+{\eta}^2\right)}^{-1/2} $
as
$ {\left(1+{\eta}^2\right)}^{-1/2} $
as $ \left|u-v\right|\to \infty $
and
$ \left|u-v\right|\to \infty $
and $ \unicode{x1D542}\left(u,v;\eta, \gamma \right)\hskip0.35em =\hskip0.35em 1 $
if
$ \unicode{x1D542}\left(u,v;\eta, \gamma \right)\hskip0.35em =\hskip0.35em 1 $
if $ u=v $
. Here we fix
$ u=v $
. Here we fix $ \eta =\sqrt{99} $
so that
$ \eta =\sqrt{99} $
so that $ 0.1\le \unicode{x1D542}\left(u,v;\eta, \gamma \right)\le 1 $
.
$ 0.1\le \unicode{x1D542}\left(u,v;\eta, \gamma \right)\le 1 $
.
To estimate kernel hyperparameters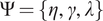 $ \Psi =\{\eta, \hskip2pt \gamma, \hskip2pt \lambda \} $
and core-specific parameters
$ \Psi =\{\eta, \hskip2pt \gamma, \hskip2pt \lambda \} $
and core-specific parameters $ \Theta ={\{{\alpha}_m,\hskip2pt {\beta}_m\}}_{m=1}^M $
, we first obtained point estimates
$ \Theta ={\{{\alpha}_m,\hskip2pt {\beta}_m\}}_{m=1}^M $
, we first obtained point estimates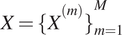 $ \hat{X}={\{{\hat{X}}^{(m)}\}}_{m=1}^M $
of SSTs one-by-one as the medians of the samples drawn from the emission model only, and then run the gradient ascent on the following objective function:
$ \hat{X}={\{{\hat{X}}^{(m)}\}}_{m=1}^M $
of SSTs one-by-one as the medians of the samples drawn from the emission model only, and then run the gradient ascent on the following objective function:
 $$ \mathrm{\mathcal{L}}\left(\Psi, \Theta \right)\triangleq \sum \limits_{m\hskip0.35em =\hskip0.35em 1}^M\log \mathcal{N}\left({\hat{X}}^{(m)}|{\mu}_{T^{(m)}}+{\beta}_m,{\alpha}_m^2\left({\unicode{x1D542}}_{T^{(m)}{T}^{(m)}}+{\lambda}^2{\unicode{x1D540}}_{N_m}\right)\right). $$
2.4. Hamiltonian Monte Carlo algorithm
Because the posterior of SSTs $ p\left({X}^{(m)}|{T}^{(m)},{Y}^{(m)}\right)\propto p\left({X}^{(m)}|{T}^{(m)}\right)p\left({Y}^{(m)}|{X}^{(m)}\right) $
is in general not given as an analytic form, the next-best approach would be to approximate it with samples. Markov-chain Monte Carlo (MCMC) algorithm (Liu, Reference Liu2001) is a typical method to sample from a distribution of which only its proportional formula is known. However, MCMC could be very slow in practice, especially if the proposal distribution is not efficient. To design an efficient proposal distribution might not be straightforward when the random variable is of high-dimensional, and components are highly correlated.
$ p\left({X}^{(m)}|{T}^{(m)},{Y}^{(m)}\right)\propto p\left({X}^{(m)}|{T}^{(m)}\right)p\left({Y}^{(m)}|{X}^{(m)}\right) $
is in general not given as an analytic form, the next-best approach would be to approximate it with samples. Markov-chain Monte Carlo (MCMC) algorithm (Liu, Reference Liu2001) is a typical method to sample from a distribution of which only its proportional formula is known. However, MCMC could be very slow in practice, especially if the proposal distribution is not efficient. To design an efficient proposal distribution might not be straightforward when the random variable is of high-dimensional, and components are highly correlated.
Hamiltonian Monte Carlo (HMC) (Neal, Reference Neal2010) is an efficient Monte Carlo algorithm by using derivatives of the logarithm of posterior with respect to the random variables to sample for constructing the proposal distribution. Details of the implementation can be found in Gelman et al. (Reference Gelman, Carlin, Stern, Dunson, Vehtari and Rubin2013). One requirement of HMC is that the logarithm of posterior is differentiable with respect to the random variables: it is fulfilled if a given calibration curve is differentiable.
Algorithm 1. SST Reconstruction by the Gaussian Process State-space Model
-
1 initialize kernel hyperparameters and core-specific parameters.
-
2 draw SST samples with a noninformative prior on SSTs and likelihood ( 1).
-
3 obtain medians of the SST samples.
-
4 estimate kernel hyperparameters and core-specific parameters with the objective function (5) by gradient ascent.
-
5 draw SST samples with the prior (2) and likelihood (1) by HMC.
-
6 draw SST samples at query ages by (3).
-
7 return kernel hyperparameters, core-specific parameters, and SST samples.
Now we are prepared. The whole algorithm of our model is summarized in Algorithm 1. The software is available at https://github.com/eilion/CI2022_SST_Reconstruction, with specific values of hyperparameters such as the number of leap frog steps.
3. Data and Results
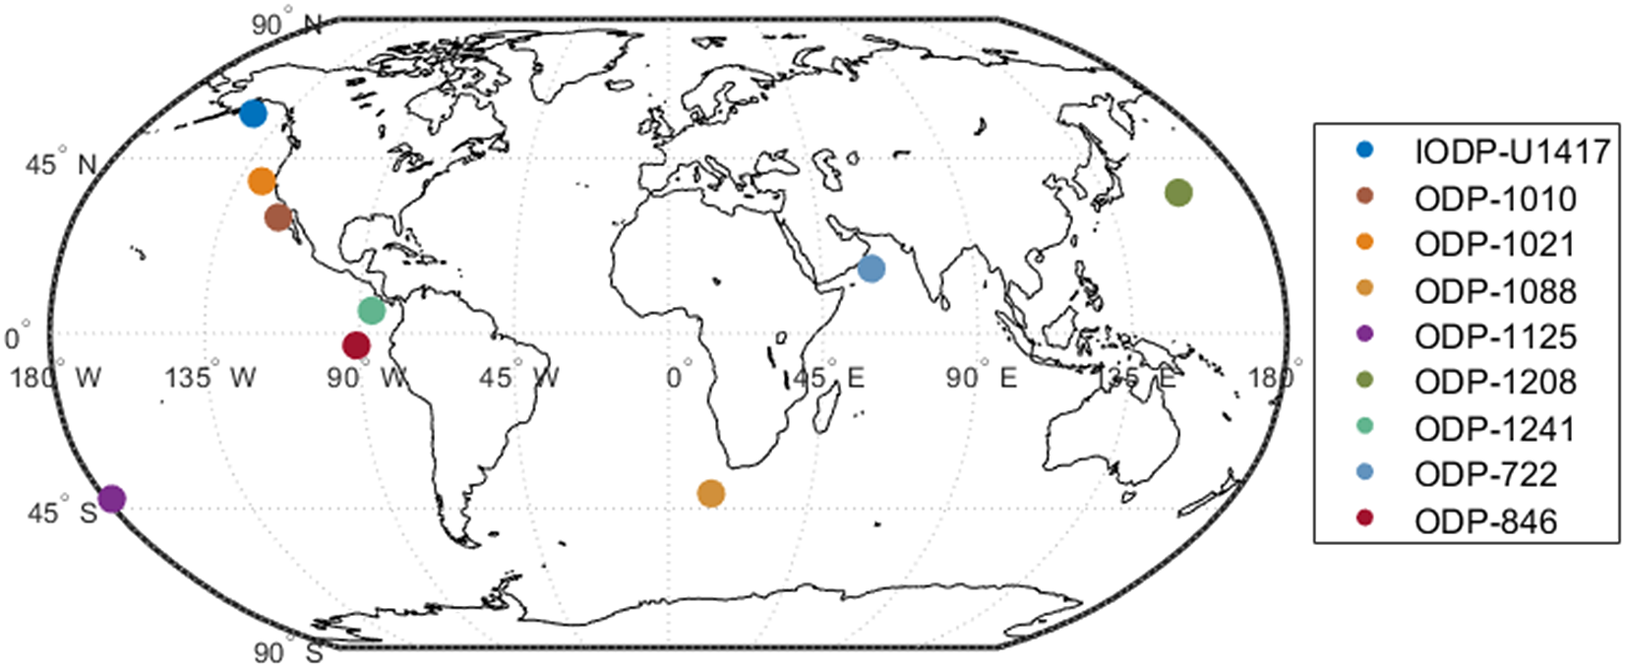
In this analysis, we chose nine sediment cores that reach up to 800 ka bp: IODP-U1417 (Müller et al., Reference Müller, Romero, Cowan, McClymont, Forwick, Asahi, März, Moy, Suto, Mix and Stoner2021), ODP-1010, ODP-1021, ODP-1088, ODP-1125, ODP-1208, ODP-1241, ODP-722, and ODP-846 (Herbert et al., Reference Herbert, Lawrence, Tzanova, Peterson, Caballero-Gill and Kelly2016). Their spatial information is in Figure 2. Most of the results are visualized in the Supplementary Material. Here, we just present the comparison of SST estimates between the point-wise reconstruction (i.e., SSTs are estimated independently) and GPST-based reconstruction with the calibration curve BAYSPLINE for the four cores IODP-U1417, ODP-1208, ODP-722, and ODP-846 in Figure 3. Notice that our main purpose is not to compare calibration curves but just to show that our GPST model works with various models.
Sediment core locations on map.
SST Reconstructions of four cores with BAYSPLINE. In each panel, blue bars indicate the 95% confidence intervals for quantiles of point-wise SST samples and black regions indicate the 95% confidence band for quantiles from GPST-based SST samples. Black curves are the medians of GPST-based SST samples.

4. Discussion and Conclusion
In this work, we have processed nine sediment cores that contain alkenone proxies to reconstruct SSTs up to 800 ka bp. As shown in Figure 3, the Gaussian process state-space model results in smoother and less noisy SST inference than the point-wise SST estimates. For example, variances of GPST SST estimates of ODP-846 are 0.7188, 0.7268, and 0.5230 for MULLER, BAYSPLINE, and HGPR, respectively, whereas those of point-wise SST estimates are 0.9397, 1.0435, and 0.6317. Detailed comparison can be found in the Supplementary Material.
Notice that SST estimates from HGPR tend to be lower than those from MULLER and BAYSPLINE at low SSTs, which is because the calibration curve of HGPR is higher than those of MULLER and BAYSPLINE below $ {15}^{\circ } $
C. Also, the SST inference from the GPST model differs from the translated SST prior by Shakun et al. (Reference Shakun, Lea, Lisiecki and Raymo2015), as shown in Figure 4 in the BAYSPLINE case. Such discordance might stem from the regional singularity, but consistent discordance, such as those at 700–800 ka bp, might imply the potential of better measurement of global SST changes from multiple proxies. Extreme point-wise SST estimates are well controlled by the GPST, such as those at 142.315 ka bp of IODP-U1417 and at 436.24 ka bp of ODP-1021. Another observation is that GPST SST estimates are closer to the translated SST prior from Shakun et al. (Reference Shakun, Lea, Lisiecki and Raymo2015) as the density of proxy observations is sparser, which is consistent with the transition model based on the Gaussian process that makes SSTs correlated over ages: see figures in the Supplementary Material.
$ {15}^{\circ } $
C. Also, the SST inference from the GPST model differs from the translated SST prior by Shakun et al. (Reference Shakun, Lea, Lisiecki and Raymo2015), as shown in Figure 4 in the BAYSPLINE case. Such discordance might stem from the regional singularity, but consistent discordance, such as those at 700–800 ka bp, might imply the potential of better measurement of global SST changes from multiple proxies. Extreme point-wise SST estimates are well controlled by the GPST, such as those at 142.315 ka bp of IODP-U1417 and at 436.24 ka bp of ODP-1021. Another observation is that GPST SST estimates are closer to the translated SST prior from Shakun et al. (Reference Shakun, Lea, Lisiecki and Raymo2015) as the density of proxy observations is sparser, which is consistent with the transition model based on the Gaussian process that makes SSTs correlated over ages: see figures in the Supplementary Material.
Deviations of the BAYSPLINE medians of SST samples at query ages of 0–800 ka bp by the GPST model from the translated SST estimates given by Shakun et al. (Reference Shakun, Lea, Lisiecki and Raymo2015). From top to bottom, panels contain IODP-U1417, ODP-1208, ODP-722, and ODP-846 consecutively. Colors are consistent with those in Figure 2. Dots and crosses are the GPST SST estimates and point-wise SST estimates, respectively.

There are five advantages of the SST inference based on the Gaussian process state-space model. First, the GPST indirectly correlates the proxy observations so that information stored in each age are shared. Second, the GPST defines the transition model to able an SST inference at any query age. For example, SST estimations of IDOP-U1417 in Figure 3 are available before 100 ka bp even though no proxy observation is there. Third, the Gaussian process prior allows to utilize the datasets that are not spaced regularly over ages without an interpolation in preprocess. Fourth, the transition model of GPST is nonparametric thus free from the structural misspecification of the parametric modeling. Fifth, the GPST does not assume the memoryless property that the Markov models cannot avoid being involved with.
An alternative of the Hamiltonian Monte Carlo algorithm is the variational inference (Bishop, Reference Bishop2006), that is, to approximate the posterior of SSTs given the dataset with a known explicit distribution, such as Gaussian, with the evidence lower bound as its objective function. Here, we do not consider this for possible cases where the posterior is skewed or multimodal.
In Section 2.3, we estimate the kernel hyperparameters and core-specific parameters from the medians of SSTs of the point estimates for regularizing the dynamics of the core process. However, the best way would be first to bring the estimation of kernel hyperparameters of the core process from the global dataset (i.e., depending on the $ {\mathrm{U}}_{37}^{\mathrm{K}\prime } $
cores as many as possible) and then to estimate the core-specific parameters of the query cores only, which will be done in full-scale as a subsequent work.
$ {\mathrm{U}}_{37}^{\mathrm{K}\prime } $
cores as many as possible) and then to estimate the core-specific parameters of the query cores only, which will be done in full-scale as a subsequent work.
Our current GPST model has some drawbacks. First, it ignores the direct correlation of SSTs across sediment cores, that is, they are conditionally independent given the core Gaussian process prior $ \mathcal{N}\left(0,{\unicode{x1D542}}_{T^{(m)}{T}^{(m)}}+{\lambda}^2{\unicode{x1D540}}_{N_m}\right) $
, which might not be the best way of exploiting the
$ \mathcal{N}\left(0,{\unicode{x1D542}}_{T^{(m)}{T}^{(m)}}+{\lambda}^2{\unicode{x1D540}}_{N_m}\right) $
, which might not be the best way of exploiting the $ {\mathrm{U}}_{37}^{\mathrm{K}\prime } $
thoroughly. Second, the core Gaussian process prior is homoscedastic, that is, it assumes the constant error covariance
$ {\mathrm{U}}_{37}^{\mathrm{K}\prime } $
thoroughly. Second, the core Gaussian process prior is homoscedastic, that is, it assumes the constant error covariance $ {\lambda}^2{\unicode{x1D540}}_{N_m} $
, which might be unrealistic because the pattern of SSTs would be nonstationary over time. Third, our model does not assume potential lead-or-lags of the information between sediment cores, which might be against the natural phenomenon regarding the change of SSTs over the transitions of glacial and interglacial epochs: this can be done by estimating lead-or-lag core-specific parameters to shift proxy observations over ages. Fourth, the current model does not take other types of proxies that are relevant to SSTs. Fifth, the model does not take account of age uncertainties of proxy observations in the sediment cores, which could make SST estimations smoother over ages. Such drawbacks will be addressed in future works.
$ {\lambda}^2{\unicode{x1D540}}_{N_m} $
, which might be unrealistic because the pattern of SSTs would be nonstationary over time. Third, our model does not assume potential lead-or-lags of the information between sediment cores, which might be against the natural phenomenon regarding the change of SSTs over the transitions of glacial and interglacial epochs: this can be done by estimating lead-or-lag core-specific parameters to shift proxy observations over ages. Fourth, the current model does not take other types of proxies that are relevant to SSTs. Fifth, the model does not take account of age uncertainties of proxy observations in the sediment cores, which could make SST estimations smoother over ages. Such drawbacks will be addressed in future works.
Author Contributions
Conceptualization: T.L.; Data curation: T.L., C.E.L.; Data visualization: T.L.; Methodology: T.L., J.S.L.; Software: T.L.; Writing—original draft: T.L., J.S.L., C.E.L. All authors approved the final submitted draft.
Competing Interests
The authors declare no competing interests exist.
Data Availability Statement
Replication data and code are in the GitHub repository: https://github.com/eilion/CI2022_SST_Reconstruction.
Ethics Statement
The research meets all ethical guidelines, including adherence to the legal requirements of the study country.
Funding Statement
This research was supported by grants from the NSF DMS-2015411; NIH R01 HG011485-01; and NSF OCE-1760838.
Provenance
This article is part of the Climate Informatics 2022 proceedings and was accepted in Environmental Data Science on the basis of the Climate Informatics peer review process.
Supplementary Material
To view supplementary material for this article, please visit http://doi.org/10.1017/eds.2022.29.



 Open access

