


Introduction
Proctoeces maculatus (Looss, 1901) Odhner, 1911 (Digenea: Fellodistomidae) is a widespread trematode species that parasitizes the gut of a wide range of marine fishes. It was originally described as Distomum maculatum Looss, 1901 from the Brown wrasse (Labrus merula L.) in Trieste, Italy (Looss, Reference Looss1901; Odhner, Reference Odhner1911). Over the years, adults of P. maculatus have been reported from 65 species of fish; additionally, 26 invertebrate species have been recorded as intermediate hosts for P. maculatus (WoRMS, 2023). Additionally, numerous species exhibiting morphological similarities to P. maculatus have been described, and a significant proportion of them have subsequently been synonymized with P. maculatus. This outcome stems from the conserved morphology observed among isolates, which presents a challenge in discerning clear-cut morphological characteristics to differentiate P. maculatus from other species (Freeman and Llewellyn, Reference Freeman and Llewellyn1958; Bray and Gibson, Reference Bray and Gibson1980).
An interesting trait of Proctoeces species is the incorporation of progenetic metacercariae in their life cycles – the larval stages can attain sexual maturity while infecting an intermediate host (Freeman and Llewellyn, Reference Freeman and Llewellyn1958; Bray and Gibson, Reference Bray and Gibson1980; Oliva and Huaquin, Reference Oliva and Huaquin2000). These trematodes have a near-cosmopolitan distribution and are known to infect a variety of hosts, mainly fishes and molluscs that mostly occur in shallow water (Bray and Gibson, Reference Bray and Gibson1980). Proctoeces maculatus has been reported only once, 40 years ago, in South Africa, when immature specimens were found in the common octopus Octopus vulgaris Cuvier (Bray, Reference Bray1983).
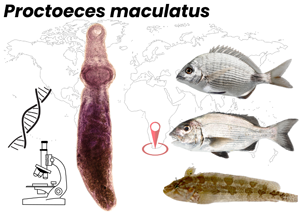
While exploring the trematode biodiversity of fishes along the South African coast, adult specimens of P. maculatus were found in three intertidal and near-shore fishes: Clinus superciliosus (L.) (Clinidae), Diplodus capensis (Smith) (Sparidae) and Sparodon durbanensis (Castelnau) (Sparidae). This is the first report of adult P. maculatus from marine fishes in South Africa, along with the first molecular characterization of this species from this biodiversity-rich marine environment.
Materials and methods
Sample collection
Specimens of C. superciliosus, D. capensis and S. durbanensis were collected from rocky intertidal and near-shore areas along the South African coast (Fig. 1). The collection sites of each species, along with the infection rates, can be seen in Table 1.
Map of sampling localities along the South African coast. DHNR - De Hoop Nature Reserve; TNP - Tsitsikamma section of the Garden Route National Park.

Data on fishes collected, localities within South Africa, intensity of infection and prevalence of infection with P. maculatus.

NP, National Park; NR, Nature Reserve.
Sampling was carried out under the permits MALH-K2016-005a and SMIT-NJ/2020-004 for the Tsitsikamma section of the Garden Route National Park (TNP); RES2018/35 for Hermanus; RES2020/29, RES2021/49 and RES2022/44 for Cape Town harbour, Chintsa East, Langebaan marina in Saldanha Bay (henceforth called Saldanha Bay), Mossel Bay and Witsand; and CN44-87-18289 for De Hoop Nature Reserve. Fishes were collected with baited traps and hand lines and humanely killed using standard methods. Following euthanasia, fishes were subjected to a full helminthological examination by inspecting every organ. Digenean trematodes were removed, relaxed in hot saline and fixed in 80% ethanol for further analyses. The prevalence and intensity of each species was calculated according to Bush et al. (Reference Bush, Lafferty, Lotz and Shostak1997). Fish names and authorities follow FishBase (Froese and Pauly, Reference Froese and Pauly2023).
Morphological analyses
Hologenophores were selected following the concept of Pleijel et al. (Reference Pleijel, Jondelius, Norlinder, Nygren, Oxelman, Schander, Sundberg and Thollesson2008). These, along with additional whole specimens, were rehydrated in distilled water, stained with Mayer's haematoxylin, destained with 1% hydrochloric acid, neutralized with 1% ammonia, gradually dehydrated in an ethanol series (70, 80, 90, 96, 100%), cleared in methyl salicylate and permanently mounted on slides with dammar gum. These specimens were measured, photographed and used to make detailed drawings for each species. Measurements were obtained using NIS-Elements BR Cameral Analysis software and a Nikon Ni microscope (Nikon Instruments, Tokyo, Japan), and are given as a range followed by a mean in parentheses. All measurements, unless otherwise stated, are given in micrometres (μm). Drawings were made with the aid of a drawing tube attached to the aforementioned microscope. Digitization of the specimen drawings was done using Adobe Illustrator v. 26.4.1 and Photoshop v. 23.4.2. Voucher material is deposited in the Parasite Collection of the National Museum (NMB), Bloemfontein, South Africa.
Generation of molecular data
Total genomic DNA was extracted with the KAPA Express Extract Kit (Kapa Biosystems, Cape Town, South Africa) and the PCRBiosystems Rapid DNA Extraction Kit (PCRBiosystems available from Analytical Solutions, Randburg, South Africa), following the manufacturers’ protocols. However, the following adaptations were made to the protocol of the PCRBiosystems Rapid DNA Extraction Kit to obtain quality DNA: only 10 μL lysis buffer was used, 5 μL proteinase K-containing buffer was used and the final reaction was diluted with 450 μL water. The D1–D3 fragment of the 28S nuclear ribosomal RNA gene was amplified using the primers Digl2 (5′-AAG CAT ATC ACT AAG CGG-3′) (Tkach et al., Reference Tkach, Pawlowski, Mariaux, Swiderski, Littlewood and Bray2001) and 1500R (5′-GCT ATC CTG AGG GAA ACT TCG-3′) (Snyder and Tkach, Reference Snyder and Tkach2001), following the protocol of Tkach et al. (Reference Tkach, Littlewood, Olson, Kinsella and Swiderski2003). Two internal primers were used for sequencing of 28S rDNA: ECD2 (5’-CTT GGT CCG TGT TTC AAG ACG GG-3’) (Tkach et al., Reference Tkach, Littlewood, Olson, Kinsella and Swiderski2003) and 300F (5’-CAA GTA CCG TGA GGG AAA GTT G-3’) (Littlewood et al., Reference Littlewood, Curini-Galletti and Herniou2000). For the amplification of the 18S rRNA fragment, the universal forward and reverse primers 18SU467F (5’-ATC CAA GGA AGG CAG CAG GC-3’) and 18SL1310R (5’-CTC CAC CAA CTA AGA ACG GC-3’) (Suzuki et al., Reference Suzuki, Murakami, Takeyama and Chow2006) were used; polymerase chain reaction (PCR) conditions were set to 94°C for 2 min, followed by 35 cycles of 94°C for 30 s, 55°C for 1 min, 72°C for 2 min and final extension at 72°C for 7 min. The cytochrome c oxidase subunit I (COI) genes were amplified using the forward primer Dice1F (5’-ATT AAC CCT CAC TAA ATT WCN TTR GAT CAT AAG-3’) (Moszczynska et al., Reference Moszczynska, Locke, McLaughlin, Marcogliese and Crease2009) and the reverse primer Dice 14R (5’-TAA TAC GAC TCA CTA TAC CHA CMR TAA ACA TAT GATG-3’) (Van Steenkiste et al., Reference Van Steenkiste, Locke, Castelin, Marcogliese and Abbott2015); PCR conditions were set to 94°C for 4 min, followed by 40 cycles of 94°C for 40 s, 51°C for 40 s, 72°C for 1 min and final extension at 72°C for 10 min. The PCR products were visualized with 1% agarose gel electrophoresis and sent to a commercial sequencing company in Pretoria, South Africa for purification and sequencing (Inqaba Biotechnical Industries [Pty] Ltd.). The resulting sequences were assembled and edited using Geneious v. 11.1.4 bioinformatics software (Biomatters, Auckland, New Zealand). Novel sequence data have been deposited in GenBank (see Table 2).
Sequences used for phylogenetic analyses of the 18S, 28S and COI gene/regions

AUS, Australia; TNP, Tsitsikamma section of the Garden Route National Park; SA, South Africa; UK, United Kingdom; USA, United States of America.
a Listed on GenBank as Proctoeces cf. lintoni.
b Host is not a fish.
c Listed on GenBank as Proctoeces lintoni.
d Listed on GenBank as Proctoeces sp.
Phylogenetic analyses
Sequences included in the phylogenetic analyses were selected based on the results of Wee et al. (Reference Wee, Cribb, Bray and Cutmore2017) and Oliva et al. (Reference Oliva, Valdivia, Cárdenas, Muñoz, Escribano and George-Nascimento2018). Sequences available for this genus as well as the outgroup sequences were retrieved from GenBank (Table 2).
An alignment was built for each gene, using MUSCLE (Edgar, Reference Edgar2004) as implemented in Geneious v. 11.1.4. The best nucleotide substitution model was predicted using jModelTest 2.1 (Posada, Reference Posada2008), based on the Akaike information criterion. The general time-reversible model with gamma distribution rate variation among sites (GTR + G) was used to construct both phylogenetic trees. The COI alignment was only used to calculate genetic distance matrices. Both phylogenies are based on Bayesian inference (BI) and maximum likelihood (ML) estimate analyses. BI analyses were performed with MrBayes software and ML analyses were performed with PhyML v. 3.0 (available at http://www.atgc-montpellier.fr/phyml/). For the BI analyses of both alignments, the following parameters were set: Markov chain Monte Carlo chains were run for 3 000 000 generations; the ‘burn-in’ parameter was set for the first 25% of the sampled trees. A hundred bootstrap pseudo replicates were run to determine the nodal support for ML analyses. Phylogenetic trees were visualized using FigTree v. 1.4.4 (Rambaut Reference Rambaut2012) and combined and edited using Adobe Illustrator v. 26.4.1. Pairwise genetic distance matrices were calculated in MEGA v. X using the parameters ‘model/method = No. of differences’, ‘variance estimation method = none’, ‘substitutions to include = d: transitions + transversions’ and ‘gaps/missing data treatment = pairwise deletion’.
Results
General results
Among all the localities sampled, De Hoop Nature Reserve exhibited the highest prevalence and intensity of infection with P. maculatus in D. capensis (see Table 1). Proctoeces maculatus was most prevalent in C. superciliosus from TNP, but had a higher intensity of infection at Chintsa East. However, this species was absent from C. superciliosus collected in Cape Town harbour and Saldanha Bay, as well as from D. capensis collected in Mossel Bay. Nearly half of the S. durbanensis collected from TNP were infected with P. maculatus. Having considered the lines of evidence provided by molecular, morphological and ecological (i.e. host) data, we are confident that these collected specimens belong to P. maculatus.
Morphological characterization
Family Fellodistomidae Nicoll, 1909
Subfamily Fellodistominae Nicoll, 1909
Genus Proctoeces Odhner, 1911
Proctoeces maculatus (Looss, 1902) Odhner, 1911
Type-host: Labrus merula L.
Type-locality: Trieste, Italy
New hosts: Clinus superciliosus (L.) (Clinidae); Diplodus capensis (Smith) (Sparidae); Sparodon durbanensis (Castelnau) (Sparidae).
New localities: Chintsa East, De Hoop Nature Reserve, Hermanus, Tsitsikamma section of the Garden Route National Park, and Witsand, South Africa.
Site of infection: Intestine.
Representative DNA sequences: OR724708 (18S); OR724713–OR724718 (28S); OR723765–OR723770 (COI).
Voucher material: A total of 58 voucher specimens deposited in NMB ‒ 22 stained and permanently mounted specimens (accession no. NMB P 999–1020) and 36 specimens in ethanol (accession no. NMB P 991–998).
Description (based on 22 whole mounts; Fig. 2; Table 3). Body subcylindrical, robust, tapering at both ends; widest at level of ventral sucker, occasionally at level of testes; forebody occupying about 26.1% of total body length. Tegument unarmed.
Proctoeces maculatus whole mount. Ventral view (A), terminal genitalia (B), lateral view (C). Abbreviations: E, egg; CS, cirrus sac; GA, genital atrium; GP, genital pore; IC, intestinal caeca; M, metraterm; OV, ovary; P, pharynx; PP, pars prostatica; SV, seminal vesicle; T, testis; U, uterus; VF, vitelline follicles. Scale bars: 500 μm (A, C); 100 μm (B).

Morphometrics of newly collected specimens of Proctoeces maculatus, compared to examples of published measurements in literature for adult P. maculatus

Oral sucker subterminal, spherical to subspherical. Prepharynx absent. Pharynx well developed, globular, muscular. Oral sucker to pharynx length ratio 1:0.7–1.1 (1:0.9). Oesophagus short, often indistinct. Intestine thick-walled. Intestinal bifurcation in mid forebody, often overlaps pharynx dorsally. Caeca end blindly in hindbody between testes and posterior extremity; ends often covered by uterus, thus indistinguishable. Ventral sucker pre-equatorial, transversely oval when viewed ventrally, muscular, larger than oral sucker. Oral sucker to ventral sucker length ratio 1:0.9–1.5 (1:1.2); width ratio 1:1.5–2.0 (1:1.7).
Testes two, intercaecal, obliquely tandem, occasionally tandem, margins entire; anterior testis triangular to elongate, often contiguous with ovary; posterior testis triangular to elongate, contiguous with anterior testis. Post-testicular field represents 17–42% (26%) of body length. Cirrus sac situated between posterior end of ventral sucker and mid-level of anterior testis, encloses seminal vesicle and pars prostatica, ejaculatory duct not observed. Seminal vesicle in posterior part of cirrus sac, tubular, highly convoluted. Pars prostatica fills most of anterior cirrus sac, well developed, straight or slightly curved, covered by dense gland cells. Prominent muscular papilla at distal end of cirrus sac. Genital atrium thin-walled, extends from about mid or anterior level of ventral sucker to meet genital pore. Genital pore at about level of intestinal bifurcation, slightly sinistral.
Ovary median to slightly dextral, often contiguous to anterior testis, subspherical to elongate oval but occasionally slightly lobed. Mehlis’ gland not observed. Uterus highly convoluted; uterine coils restricted to between mid-level of ventral sucker and posterior extremity, filling most of ventral hindbody, filled with eggs in all specimens. Metraterm at distal end of uterus, enters genital atrium, faint. Eggs oval, operculate, yellow, without filaments.
Vitellarium follicular; follicles vary greatly in size, situated in two lateral fields, extend from slightly anterior to ovary to posterior limit of posterior testis, occasionally overreaching these limits, sometimes difficult to distinguish.
Excretory pore terminal, forming slight concavity at posterior body extremity. Excretory vesicle Y-shaped; site of bifurcation of vesicle not observed due to large number of eggs present in uterus; arms of vesicle terminate in two blind ends near posterior limit of pharynx, often difficult to distinguish.
Remarks
The specimens of P. maculatus in the present study agree well with the original description of the species by Looss (Reference Looss1901) from brown wrasse, L. merula (Labridae) collected off Trieste, Italy, and the redescription by Odhner (Reference Odhner1911) based on specimens collected from the butterfly blenny, Blennius ocellaris L., (Blenniidae) collected off Naples, Italy (Table 3), except that the specimens in the present study are smaller, having lower maxima for body length and width, slightly smaller suckers, pharynx and eggs. Those specimens of Odhner (Reference Odhner1911) also have a notably shorter hindbody and higher maxima for ventral sucker length and width. A faint metraterm has been noted in some specimens, including our own; Looss (Reference Looss1901) also noted a metraterm, however Bray and Gibson (Reference Bray and Gibson1980) described the metraterm as being muscular.
More recent descriptions of P. maculatus by Bray and Gibson (Reference Bray and Gibson1980) and Antar and Gargouri (Reference Antar and Gargouri2016) are also considered. Bray & Gibson (Reference Bray and Gibson1980) also note the bifurcation site of the y-shaped excretory vesicle, but this was not observed in any of the specimens of the present study, due to the large number of eggs present in the uterus that fills the hindbody. However, it was observed that the excretory vesicle terminates blindly in the anterior forebody, suggesting that the vesicle might be y-shaped. Otherwise, the morphometrics of these specimens generally agree well with the specimens in the present study.
The specimens of Antar and Gargouri (Reference Antar and Gargouri2016) from Tunisia are also similar to those of the present study, with the exception of having lower maxima for body length, body width, hindbody length, as well as smaller suckers, ovary, testes and post-testicular field. Specimens collected in the present study are overall slightly smaller than those collected in the Black Sea (Vlasenko, Reference Vlasenko1931), but contain eggs that are nearly half the length of those observed by Vlasenko (Reference Vlasenko1931). The upper limits of all structures of the specimens collected in Japan are much higher than that noted in the present study, although there is some overlap in the lower limits (Yamaguti, Reference Yamaguti1934; Shimazu, Reference Shimazu1984).
Molecular characterization
The alignment of the 28S rDNA dataset generated 729 characters for analyses. Newly sequenced isolates formed a highly supported clade within the 28S analyses (Fig. 3A), together with the P. maculatus isolates found from the sparid fish hosts Lithognathus mormyrus (L.) (KU052937: juvenile) and Sparus aurata L. (KX671302), as well as the polychaete Sabella pavonina (KU052941: metacercariae) all collected in the Bizerte Lagoon in Tunisia (Antar and Gargouri, Reference Antar and Gargouri2016; Wee et al., Reference Wee, Cribb, Bray and Cutmore2017). An isolate collected from the sheepshead, Archosargus probatocephalus (Walbaum) (Sparidae), in the Gulf of Mexico, Mississippi, USA, was identified as P. maculatus (AY222284) (Olson et al., Reference Olson, Cribb, Tkach, Bray and Littlewood2003), but did not cluster with the abovementioned isolates of P. maculatus; our analyses instead recover it in a clade with Proctoeces sicyases Oliva, Valdivia, Cárdena, Muñoz, Escribano and George-Nascimento, 2018, P. choerodoni Wee, Cribb, Bray and Cutmore, 2017 and P. insolitus (Nicoll, 1915). Newly generated sequences differed from each other by 0–0.14% (0–1 nt) and from other isolates of P. maculatus (KU052937, KU052941, KX671302) by 0–0.41% (0–3 nt). The isolate identified as P. maculatus (AY222284) differed from sequences generated in the present study by 4.40–4.53% (32–33 nt), and from the abovementioned three isolates of P. maculatus by 4.53–4.67% (33–34 nt). The overall interspecific variation for the Proctoeces isolates in this dataset is 0.14–7.43% (1–54 nt).
Bayesian inference (BI) trees based on the 28S rDNA (A) and 18S rDNA (B) datasets of the genus Proctoeces. Nodal support given as BI/ML (maximum likelihood). Support values lower than 0.90 (BI) and 70 (ML) are not shown. The scale bar indicates the expected number of substitutions per site.

The alignment of the 18S rDNA dataset generated 308 characters for analyses. A similar topology was observed for the 18S dataset (Fig. 3B), where the isolate from the present study formed a highly supported clade with P. maculatus infecting S. pavonina from the Bizerte Lagoon, Tunisia (KX671315) (Wee et al., Reference Wee, Cribb, Bray and Cutmore2017). These two sequences are identical. Again, the new sequence did not cluster with the isolate identified as P. maculatus by Olson et al. (Reference Olson, Cribb, Tkach, Bray and Littlewood2003) (AY222161); the latter was instead recovered in a clade with Proctoeces major Yamaguti, 1934 + [P. humboldti George-Nascimento and Quiroga, 1983 + P. lintoni Siddiqi and Cable, 1960], sister to the clade formed by sequences of P. maculatus. This isolate differed from newly generated sequences and an isolate of P. maculatus (KX671315) by 3.58% (11 nt). The overall interspecific variation for the Proctoeces isolates in this dataset is 2.61–10.46% (8–32 nt).
The COI dataset was only used to calculate genetic difference matrices, as there are no COI sequences of P. maculatus available in GenBank with which to compare our data. Newly generated sequences of P. maculatus differed from each other by 0–0.9% (0–3 nt). The interspecific variation between other species of Proctoeces and newly sequenced isolates is 2.4–23.8% (8–79 nt). This study provides the first COI sequences for this species, which can be used in future phylogenies to study the true diversity of this genus.
Discussion
Due to a lack of reliable characteristics on which the species of Proctoeces can be distinguished and the great morphological variation exhibited within this genus, the species of Proctoeces are notoriously difficult to identify (Freeman and Llewellyn, Reference Freeman and Llewellyn1958; Bray and Gibson, Reference Bray and Gibson1980). Proctoeces maculatus has not been re-collected or genotyped from its type-host at its type-locality (Trieste, Italy). Specimens identified as P. maculatus have been recorded and sequenced from Bizerte, Tunisia, which is also in the Mediterranean Basin but somewhat distant from Trieste, being about 950 km straight-distance away in the Tyrrhenian rather than Adriatic Sea and largely separated by the Italian mainland (Antar and Gargouri, Reference Antar and Gargouri2013, Reference Antar and Gargouri2016). This geographical distance, and the difference in fish hosts (the type-host being a labrid and those of Antar and Gargouri being from a sparid) further enhance the possibility that the specimens of Antar and Gargouri might not represent P. maculatus sensu stricto. This uncertainty can only be resolved with the molecular characterization of specimens collected from the type-host and the type-locality.
In weighing the merits of considering the P. maculatus of Looss from the type-locality conspecific with those of Antar and Gargouri from Tunisia, we need to consider two factors: the connectivity of populations and the propensity of P. maculatus to both switch fish hosts and use invertebrate (molluscan, annelid and echinoderm) hosts. Looss (Reference Looss1901), in describing P. maculatus, reported it from L. merula and two other labrid species, Symphodus cinereus (Bonnaterre) and S. tinca (L.). Linton (Reference Linton1907) subsequently described Proctoeces subtenuis (Linton, 1907) (as Distomum subtenue) from Bermuda, recording it from three labrid species and the sparid Calamus calamus (Valenciennes). Odhner (Reference Odhner1911), while proposing the genus Proctoeces and redescribing P. maculatus, also described a second species, Proctoeces erythraeus Odhner, 1911 from Acanthopagrus bifasciatus (Forsskål) (Sparidae) and Thalassoma lunare (L.) (Labridae) from the Red Sea. Bray and Gibson (Reference Bray and Gibson1980) reviewed the case for both species being synonymous with P. maculatus; P. subtenuis remains as such, although Wee et al. (Reference Wee, Cribb, Bray and Cutmore2017) argued that P. erythraeus should best be treated as species inquirenda. Nevertheless, it had become established relatively early on that species of Proctoeces readily infected both labrids and sparids in sympatry. Wee et al. (Reference Wee, Cribb, Bray and Cutmore2017) demonstrated that P. major Yamaguti, 1934 infected sympatric sparids and labrids (as well as lethrinids, monacanthids, monodactylids and pomacentrids) in Moreton Bay, Australia, but also found that Proctoeces choerodoni Wee, Cribb, Bray and Cutmore, 2017, exclusively infected labrids of the genus Choerodon Bleeker, showing that the species of Proctoeces could (but not always) have wide host ranges incorporating both sparids and labrids. Demarcating the true host-specificity of P. maculatus is particularly fraught due to the fact that the majority of records putatively assigned to this species have never been tested with molecular sequence methods, nor accompanied by morphological vouchers or depictions. It is hence highly likely that the host range of P. maculatus has, to some extent, been wrongly estimated. That this might be true, however, does not preclude the fact that its host range is wide, nor does a wide host and geographic range mean divergence and speciation cannot occur in certain circumstances.
It is well understood that connectivity in the marine environment is a significant function of population spatial structure, genetic variability and, ultimately, speciation (see Hodge and Bellwood, Reference Hodge and Bellwood2016, for example). Marine taxa in the Mediterranean Basin show varying levels of population connectivity, with even single or two ecologically similar species showing differing levels of genetic variation and connectivity between different Mediterranean regions (Sahyoun et al., Reference Sahyoun, Guidetti, Di Franco and Planes2016; Exadactylos et al., Reference Exadactylos, Vafidis, Tsigenopoulos and Gkafas2019; Falcini et al., Reference Falcini, Corrado, Torri, Mangano, Zarrad, Di Cintio, Palatella, Jarboui, Missaoui, Cuttitta, Patti, Santoleri, Sarà and Lacorata2020; López-Márquez et al., Reference López-Márquez, Cushman, Templado, Ho, Bothwell and Machordom2021). However, it is clear from many studies that high connectivity and therefore high gene flow is a feature of many Mediterranean marine species at least some of the time (González-Wangüemert et al., Reference González-Wangüemert, Cánovas, Pérez-Ruzafa, Marcos and Alexandrino2010; Exadactylos et al., Reference Exadactylos, Vafidis, Tsigenopoulos and Gkafas2019; López-Márquez et al., Reference López-Márquez, Cushman, Templado, Ho, Bothwell and Machordom2021), effectively reducing the chances that the P. maculatus on the north coast of Africa might have speciated from those on the south coast of Europe. The ability of the species of Proctoeces to infect and even reproduce within a wide range of sessile invertebrate hosts as progenetic metacercariae compounds their ability to reduce impediments to connectivity and link populations (Valdivia et al., Reference Valdivia, Criscione, Cárdenas, Durán and Oliva2014). Although the lack of molecular sequence data from the type-locality of P. maculatus again poses problems, sequence matching of species of Proctoeces from sympatric invertebrate and fish hosts has already been achieved (Valdivia et al., Reference Valdivia, Cardenas, Gonzalez, Jofré, George-Nascimento, Guiñez and Oliva2010; Antar and Gargouri, Reference Antar and Gargouri2016; Wee et al., Reference Wee, Cribb, Bray and Cutmore2017). From all this information, we can (with the significant caveat that the status of P. maculatus from its type-locality and that of many putative records of this species from around the world is currently unknowable) infer that P. maculatus from labrids in the northern Mediterranean being a different species to those from sparids in the south is less likely than them being the same species, and, until the precise molecular nature of P. maculatus from its type-locality is known, it is safe and pragmatic to consider those specimens from Tunisia to be the same species.
Since its original description, P. maculatus has been reported from 65 fish species (including our three new host records) and 26 invertebrate species globally (WoRMS, 2023). The species is therefore rare among marine trematodes in that it appears to be truly euryxenous, i.e. infecting a wide range of hosts. Only a minority of marine fish-infecting trematodes are euryxenous, with the tendency being firmly towards higher, rather than lower, host-specificity (Miller et al., Reference Miller, Bray and Cribb2011). The phenomenon is most often observed among species of Hemiuroidea, including Aponurus laguncula Looss, 1907 (Lecithasteridae), reported from 95 fish species; Thulinia microrchis (Yamaguti, 1934) (Lecithasteridae), reported from 34 fish species; and most dramatically in Derogenes varicus (Müller, 1784) (Derogenidae), which has been reported from 317 fish species and habitats ranging from tropical coral reefs to abyssobenthic Antarctic waters (WoRMS, 2023). Such vast host ranges intuitively feel over-estimated; in cases of such disparate host and geographical range, they almost certainly are. However, judging their validity is complicated by the dubious reliability of many records, which were often made before the advent of modern molecular sequencing and provided only perfunctory morphological information (Bray et al., Reference Bray, Diaz and Cribb2016). Further complicating the matter is the issue of morphological ‘variation along a theme’, with individuals from disparate localities and hosts showing a degree of variation in size or anatomy, but sufficiently conserved morphology that distinguishing them from one another is difficult or even impossible, and easily confounded by poor specimen condition or preparation practises such as flattening. Renewed scrutiny of such taxa has, in some instances, supported the notion that they actually represent complexes of multiple, often cryptic species (for example Carreras-Aubets et al., Reference Carreras-Aubets, Repullés-Albelda, Kostadinova and Carassón2011), although the converse has also been demonstrated – specimens sampled across a wide host range are shown to be conspecific and thus reinforcing the breadth of the host range [as has happened in the case of T. microrchis (Miller et al., Reference Miller, Bray and Cribb2011)]. It is likely that P. maculatus represents both a truly euryxenous and widespread species, and also a complex of multiple species. However, without the ability to access more specimens and generate more molecular sequence data from localities throughout its range, however, no firm conclusions can be drawn.
Using an integrated taxonomic approach (based on a combination of molecular and morphological characteristics), we have identified the specimens in the present study as P. maculatus. This study provides the first molecular characterization of P. maculatus from South Africa, in combination with morphological characterization. This is also the first report of adult P. maculatus from South Africa, as well as the first report of this species from a fish host in the southern African region. Antar and Gargouri (Reference Antar and Gargouri2016) observed intraspecific variation in their sequences of the partial 28S gene of P. maculatus of 0‒0.42% (0‒5 nt); we consider the 0–0.41% (0–3 nt) difference between the newly generated sequences and the P. maculatus sequences available on GenBank as also consistent with intraspecific variation. Newly sequenced isolates are highly similar to isolates collected in the Mediterranean (Antar and Gargouri, Reference Antar and Gargouri2016; Wee et al., Reference Wee, Cribb, Bray and Cutmore2017), differing by a maximum of 3 base-pairs. However, the isolate identified as P. maculatus collected in the Gulf of Mexico (Olson et al., Reference Olson, Cribb, Tkach, Bray and Littlewood2003) did not cluster among other isolates of P. maculatus, thus it likely represents another species of Proctoeces. This was also noted by Antar and Gargouri (Reference Antar and Gargouri2016). Similar results were seen within the 18S dataset analysed. Bray (Reference Bray1984) reported P. maculatus as progenetic metacercariae from the common octopus O. vulgaris off Durban, South Africa; it is very likely that the specimens found during the present study represent this species, especially given that these host species share a habitat and similar food sources and are thereby exposed to larval stages of the same parasitic species (Smale and Buchan, Reference Smale and Buchan1981; Bennett et al., Reference Bennett, Griffiths and Penrith1983).
The sequence data generated by Antar and Gargouri (Reference Antar and Gargouri2016) and Wee et al. (Reference Wee, Cribb, Bray and Cutmore2017) from sparids and carangids from off Tunisia are the closest available to the type-locality, being also from the Mediterranean Basin. Our P. maculatus sequences from sparids and clinids differ from those of Antar and Gargouri (Reference Antar and Gargouri2016) and Wee et al. (Reference Wee, Cribb, Bray and Cutmore2017) by a maximum of 3 bp in the partial 28S rDNA region and are identical in the 18S rDNA region, supporting the notion that P. maculatus is not only euryxenous, but also has a wide geographical range. This ability to spread across such a wide area is likely facilitated by the versatility of P. maculatus, exploiting multiple hosts which are similarly wide-ranging and highly vagile (Feis et al., Reference Feis, Thieltges, Olsen, de Montaudouin, Jensen, Bazaïri, Culloty and Luttikhuizen2015). South Africa shares several known hosts of P. maculatus with the Mediterranean, e.g. the sparids L. mormyrus and Diplodus vulgaris (Geoffroy Saint-Hilaire), the common octopus, O. vulgaris and the Mediterranean mussel, Mytilus galloprovincialis Lamarck (Mytilidae), the latter having been introduced to South Africa in the 1970s (Branch and Steffani, Reference Branch and Steffani2004). Another known host in the Mediterranean, Diplodus sargus, is also found along most of the West African coast and, until recently, was considered conspecific with our new host, D. capensis. As discussed above, the ability of P. maculatus to incorporate a progenetic stage in its life cycle, thereby thriving even when suitable definitive fish hosts are not present, likely further contributes to the wide distribution and ability of this species to exploit a wide range of hosts.
Interestingly, our results showed that fish sampled from sites within marine protected areas (MPAs) had the highest prevalence of P. maculatus (TNP, 30.0% from C. superciliosus, 39.0% from D. capensis and 42% from S. durbanensis; DHNR, 67.0% from D. capensis), compared with sites not within MPAs and adjacent to highly urbanized areas (0% in Cape Town harbour, Saldanha Bay and Mossel Bay) (see Table 1). This suggests that these parasites might be sensitive to pollution or other anthropogenic effects and therefore could be good indicators of ecosystem health. Similar results were noted by Erasmus et al. (Reference Erasmus, Wepener, Hadfield, Sures and Smit2022), where the parasite diversity of C. superciliosus was lower in areas with a higher anthropogenic influence. Such findings are consistent with what we know regarding the deleterious effects that anthropogenic environmental changes have on both the richness and abundance of aquatic parasites (Sures et al., Reference Sures, Nachev, Schwelm, Grabner and Selbach2023). One possible explanation of this phenomenon could be the absence or reduced presence of suitable intermediate or definitive hosts, which might be more susceptible to the effects of anthropogenic activities in non-MPA areas (Erasmus et al., Reference Erasmus, Wepener, Hadfield, Sures and Smit2022). Apart from the record of metacercariae by Bray (Reference Bray1983) from O. vulgaris, intermediate hosts of P. maculatus are unknown in South Africa. Elsewhere, first intermediate stages of the species have been observed from mytilid bivalves (Stunkard, Reference Stunkard1970; Wardle, Reference Wardle1980), while both progenetic and non-progenetic metacercariae have been found in a wide range of invertebrates, including buccinid (Shimazu, Reference Shimazu1984), haliotid (Shimazu, Reference Shimazu1972), hydrobiid (Belousova, Reference Belousova2022), patellid (Prevot, Reference Prevot1965) and rissoid (Machkevsky and Parukhin, Reference Machkevsky and Parukhin1981) gastropods; acanthochitonid chitons (Polyplacophora) (Prevot, Reference Prevot1965); pectinid bivalves (Bray, Reference Bray1983); nereid (Machkevsky, Reference Machkevsky1985), sabellid (Antar and Gargouri, Reference Antar and Gargouri2016) and serpulid (Prevot, Reference Prevot1965) polychaetes (Annelida); and strongylocentrotid echinoids (Echinodermata) (Shimazu, Reference Shimazu1979). Most of these host groups, and the definitive fish hosts in which we found P. maculatus, are well represented along the South African coast, which means that, in theory, P. maculatus is well provisioned with intermediate and definitive hosts. However, the shallow-water marine communities, both in South Africa and elsewhere, are known to be vulnerable to anthropogenic disturbance, such as that caused by excessive harvesting (Crowe et al., Reference Crowe, Thompson, Bray and Hawkins2000; Cole et al., Reference Cole, McQuaid and Nakin2011) and urbanization (Celliers and Ntombela, Reference Celliers, Ntombela and Paula2015; Momota and Hosokawa, Reference Momota and Hosokawa2021). Further marine environmental parasitological studies, focussing on digeneans and their intermediate and definitive hosts, will be needed to determine the extent to which anthropogenic environmental disturbance could compromise host population/community structure and, by extension, the parasite community.
Data availability statement
The data that support the findings of this study are available on request from the corresponding author.
Acknowledgements
We thank the staff of Two Oceans Aquarium for collecting C. superciliosus from Cape Town harbour; members of the North-West University (NWU) Water Research Group (WRG) for their assistance with fish collection and fieldwork; and Dr Anja Erasmus for constructing the map of the sampling localities. This is contribution number 827 from the NWU-WRG.
Author contributions
Conceptualization, N. J. S. and O. K.; methodology, A. V. and O. K.; validation, N. J. S., O. K. and A. V.; formal analysis, A. V. and O. K.; investigation, A. V. and O. K.; resources, N. J. S. and O. K.; data curation, A. V. and O. K.; writing – original draft preparation, A. V. and R. Q-Y. Y.; writing – review and editing, N. J. S., R. Q-Y. Y., A.V. and O. K.; visualization, A. V.; supervision, N. J. S. and O. K.; project administration, N. J. S. and O. K.; funding acquisition, N. J. S. All authors have read and agreed to the published version of the manuscript.
Financial support
This study was supported by a Postdoctoral Fellowship from the NWU, South Africa and a Claude Leon Foundation Postdoctoral Fellowship (2017–2018) to O. K. A. V. was partially funded by a South African National Research Foundation (NRF) scholarship (grant number: 122640 and MND200420515000). Opinions, findings, conclusions and recommendations expressed in this publication are that of the authors, and the NRF accepts no liability whatsoever in this regard.
Competing interests
None.
Ethical standards
All applicable international, national and/or institutional guidelines for the care and use of animals were followed. Ethical approval for this study was provided by the North-West University's AnimCare Ethics committee (NWU-00565-19-A5 and NWU-00759-22-A5).


 Open access