


INTRODUCTION
Glacier seismic events were first detected decades ago (Röthlisberg, Reference Röthlisberg1955; Neave and Savage, Reference Neave and Savage1970; Osten-Woldenburg, Reference Osten-Woldenburg1990). Numerous investigations (Walter and others, Reference Walter, Deichmann and Funk2008; Winberry and others, Reference Winberry, Anandakrishnan and Alley2009; Roux and others, Reference Roux, Walter, Riesen, Sugiyama and Funk2010; Carmichael and others, Reference Carmichael, Pettit, Hoffman, Fountain and Hallet2012; Walter and others, Reference Walter2012; Zoet and others, Reference Zoet, Anandakrishnan, Alley, Nyblade and Wiens2012) on glacier seismology have been conducted after the pioneering glacier earthquake study by Ekström and others (Reference Ekström, Nettles and Abers2003). Seismic observations of glaciers provide unprecedented high sample rate coverage of glacier dynamic processes (Podolskiy and Walter, Reference Podolskiy and Walter2016). The creation and propagation of surface crevasses is the most prominent sources of glacier seismicity. This seismicity of surface cracks can constrain the strain and stress variations in glaciers and provide insights into the glacier response to environmental changes.
Surface crack seismicity could be induced by temperature variations and/or meltwater. For marine-terminating glaciers, this type of seismicity can also be caused by ocean tides (Barruol and others, Reference Barruol2013; Podolskiy and others, Reference Podolskiy2016). Most recent studies focused on the effects of meltwater on glacier seismicity, especially on deep and basal icequakes (Walter and others, Reference Walter, Deichmann and Funk2008, Reference Walter, Canassy, Husen and Clinton2013; Dalban Canassy and others, Reference Dalban Canassy2013). In contrast, studies on the relationship between glacier seismicity and temperature fluctuation are relatively rare, although thermal cracking is considered to be an important mechanism of surface seismicity at cold and dry glaciers when meltwater is limited (Carmichael and others, Reference Carmichael, Pettit, Hoffman, Fountain and Hallet2012; Podolskiy and others, Reference Podolskiy, Fujita, Sunako, Tsushima and Kayastha2018). In this study, we focus on the ability of air temperature fluctuations to induce surface crack opening and night-time microseismicity (i.e. short-duration events).
We conducted a 9-d passive seismic experiment on a high-altitude valley (continental) glacier, Laohugou Glacier No. 12 (LGNT), in the Qilian Mountains to the northeast of Tibet in October 2015, when the diurnal air temperature fluctuations are large (>10°C) but the precipitation (<20 mm per month) and meltwater is limited. We identified two types of seismic events from the seismic data and analyzed their temporal distribution, magnitudes, duration and frequency characteristics. We further analyzed the relationship between seismic event occurrence and air temperature and meltwater production. Finally, we discussed the possible sources for the seismic events and quantify the tensile stress due to night-time thermal contraction. The thermal stress is found to be sufficient large to induce surface crack opening that is responsible for short-duration events.
REGIONAL SETTING AND INSTRUMENTATION
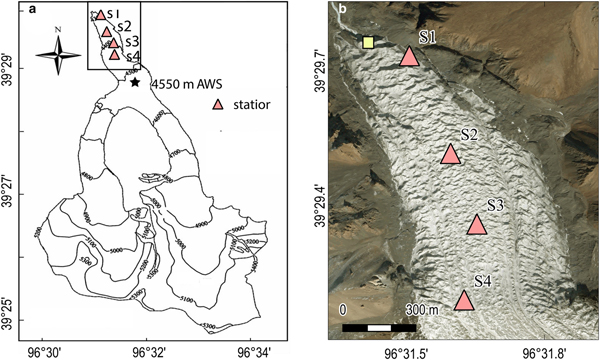
As the largest glacier in the Qilian Mountains, the LGNT is 9.85 km long and covers an area of 20.4 km2 (Du and others, Reference Du, Qin and Liu2008; Fig. 1). The LGNT consists of two tributaries and extends from 4260 to 5481 m elevation. The LGNT is a typical valley glacier in its climate and physical characteristics. Precipitation in this area is mainly affected by westerly winds all year round. The annual precipitation was 310 mm during 1960–2006 (Qin and others, Reference Qin2015), with rainfall mainly concentrated between May and September (Liu and others, Reference Liu, Qin, Du, Sun and Hou2011). In October of 2009, the monthly precipitation was <20 mm (Sun and others, Reference Sun2013). The annual air temperature was −13.2°C during 1957–2013 (Qin and others, Reference Qin2014) at 5040 m elevation. The monthly mean air temperature in October of 2009 was ~−11.2°C (Sun and others, Reference Sun2011). In October, the incoming shortwave radiation had an average value of 210.3 W m−2 and was up to 676 W m−2 at noon time (Sun and others, Reference Sun2013). The ice thickness along a transversal line at an elevation of 4458 m (close to our seismic station S4) was 56–128 m as revealed by a ground-penetration radar investigation in the ablation period (July to August) of 2009 and 2014 (Wang and others, Reference Wang2016).
(a) Contour map of Laohugou Glacier No. 12 with a contour interval of 100 m (from Liu and others, Reference Liu, Qin, Du, Sun and Hou2011). The position of the AWS is indicated by a star, and the locations of seismometers S1–S4 by triangles. (b) Enlarged satellite image (DigitalGlobe imagery taken on 9 April 2013, retrieved from http://goto.arcgisonline.com/maps/World_Imagery) of our survey area (black box in a), as well as seismometer locations. The location of our observed moulin is roughly indicated by a yellow square. Note that the station S1 is deployed near the margin of the LGNT.
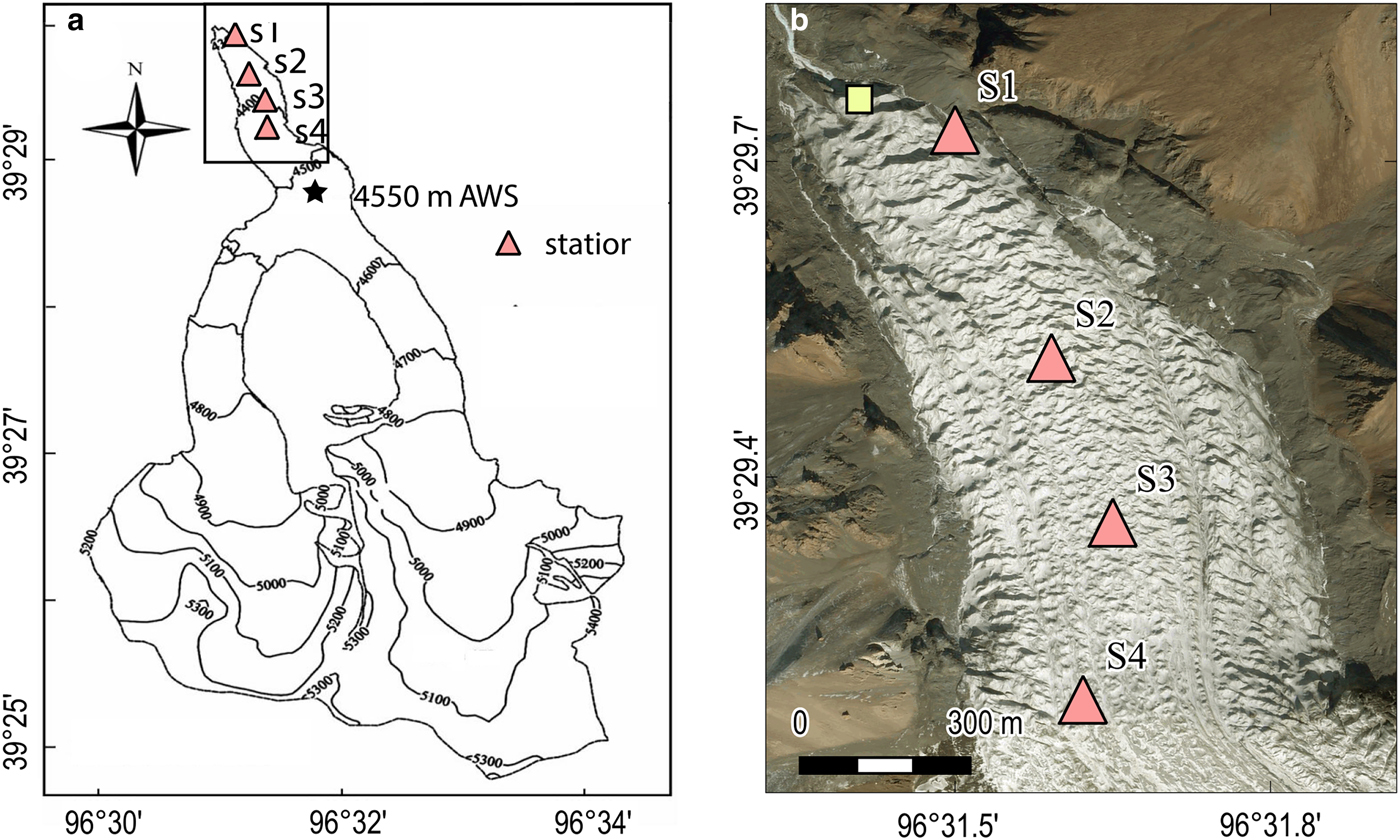
Our seismic experiment was conducted on the LGNT from 12:30 China Standard Time (CST) of 5 October through 10:16 CST of 14 October 2015. All the records are time-stamped by CST, which is 8 h ahead of UTC time. We deployed four EPS-1 digital seismometers roughly along the glacier centerline near the terminus of the LGNT at an altitude range of ~4300 to 4450 m (Fig. 1), where the averaged surface velocity was ~2.5 cm d−1 (~9 m a−1) in 2008–2009 (Liu and others, Reference Liu, Qin, Du, Sun and Hou2011). The seismometers were partially buried in the ice in a relatively flat area (without protection cover) and deployed with a spacing of 300–450 m. We checked and maintained the seismometers on a daily basis to ensure the instruments remained level and worked properly. EPS-1 is a cylinder-shaped portable digital seismometer with a radius of 70 mm and a height of 170 mm. It is a three-component seismometer accompanied with a built-in 24 bit data logger, a data storage unit, and a battery to work continuously for 20 d. The instrument response is flat from 5 to 200 Hz. The output data have a sample rate of 250 Hz (see http://www.cgif.com.cn/displayproduct.html?proID=2531321&ptid=196458 for instrument details). EPS-1 also includes an internal clock, an electronic compass, and a GPS. The electronic compass was used to record the azimuth and angles, while the GPS provided the initial time and position information. Accompanying position measurements were conducted by a geodetic group from Wuhan University at stations S2 and S3 with Leica GS10 GNSS (Global Navigation Satellite System). The Leica GS10 GNSS has a static horizontal accuracy of 3 mm + 0.5 ppm and a static vertical accuracy of 6 mm + 0.5 ppm.
An automatic weather station (AWS) was deployed on the LGNT at 4550 m elevation to measure the air temperature at 1.5 m above the glacier surface (Sun and others, Reference Sun2013, Reference Sun2014; Fig. 1). The AWS was installed on a relatively flat area of the glacier surface using a steel tripod. The temperature sensor has a measurement range of −40 to 60°C and an accuracy of ±0.2°C. The sample rate of the AWS was 0.1 Hz, while the output data were moving averages for every 30 min (Fig. 6a). The AWS also measures humidity, air pressure, and radiation, as well as wind speed and direction (Fig. 6b).
DATA PROCESSING AND SEISMIC EVENT DETECTION
To detect seismic events, we applied a classic short-term/long-term average trigger algorithm (STA/LTA) to the observed vertical component of the seismograms using SEIZMO codes (Euler G: Project SEIZMO, available at: http://epsc.wustl.edu/~ggeuler/codes/m/seizmo/). The method was proposed by Stevenson (Reference Stevenson1976) and is widely used in the identification of cryoseismic events (Bassis and others, Reference Bassis2007; Walter and others, Reference Walter, Deichmann and Funk2008; Roux and others, Reference Roux, Walter, Riesen, Sugiyama and Funk2010; Carmichael and others, Reference Carmichael, Pettit, Hoffman, Fountain and Hallet2012; Barruol and others, Reference Barruol2013; Röösli and others, Reference Röösli2014; Köhler and others, Reference Köhler, Nuth, Schweitzer, Weidle and Gibbons2015). The STA/LTA method uses short and long-term moving windows to localize the seismogram and calculate the corresponding squared amplitudes in the two windows (Trnkoczy, Reference Trnkoczy and Bormann2012). Once the ratio of the squared amplitudes in the two windows (i.e. R value) exceeds a user-defined trigger threshold R trigger, the trigger is turned on until the R value again falls below a user-defined detrigger threshold R detrigger (Fig. 2).
Typical vertical component of seismograms and STA/LTA ratios for (a, b) a short-duration event starting at 10:20:21 China Standard Time (CST), 9 October, recorded at S1, and (c, d) a long-duration events starting at 13:25:11 CST, 6 October, recorded at S2. The STA/LTA trigger parameters are listed in Table 1.
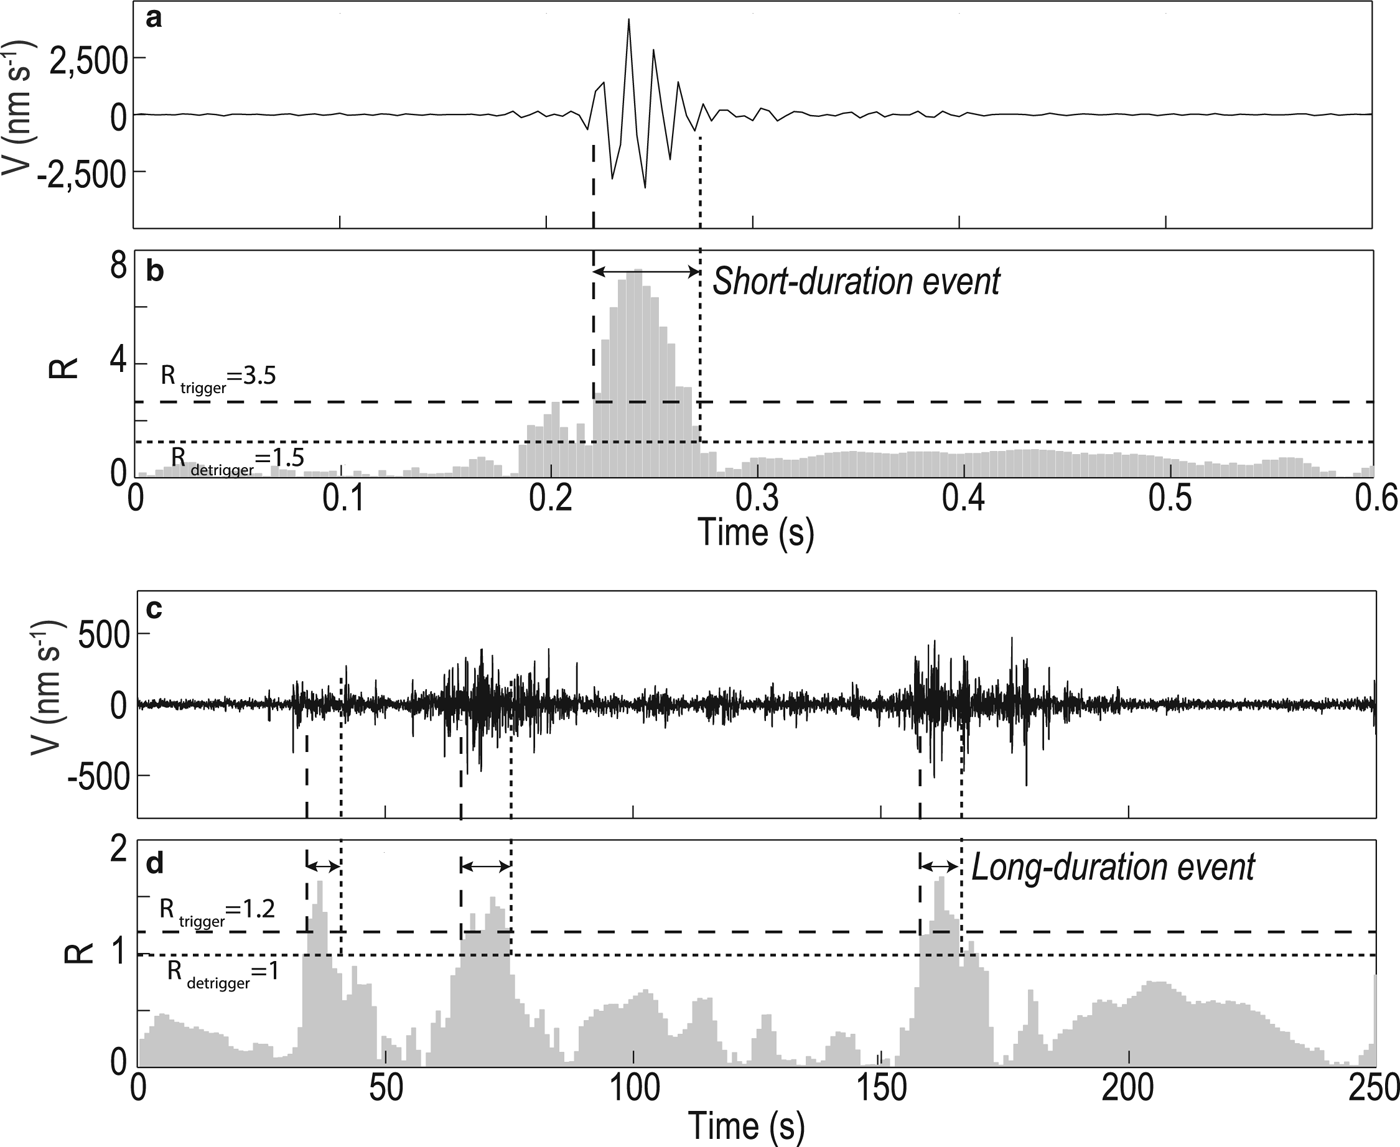
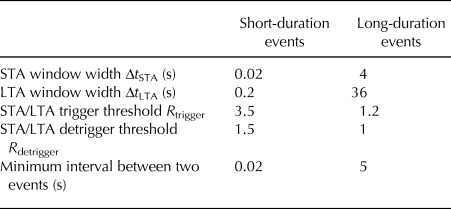
According to the amplitudes and durations, the identified seismic events were classified into long and short-duration events (Fig. 2). We chose parameters (Table 1) for the STA/LTA method based on visual inspection and manual picking of a 1-h data subset from station S1. We used a trigger threshold level R trigger of 3.5 and detrigger threshold level R detrigger of 1.5 to detect the short-duration events. The STA and LTA time windows were 0.02 and 0.2 s, respectively. The trigger and detrigger thresholds for short-duration events are close to previous studies (Walter and others, Reference Walter, Deichmann and Funk2008; Carmichael and others, Reference Carmichael, Pettit, Hoffman, Fountain and Hallet2012; Röösli and others, Reference Röösli2014), but our STA and LTA time windows are one tenth of previously used values of 0.2–1 and 2–10 s. We chose the shorter time windows to detect all the visible velocity changes in the seismograms, which would be missed if a longer time window was applied.
Parameters for seismic event identification for the STA/LTA method
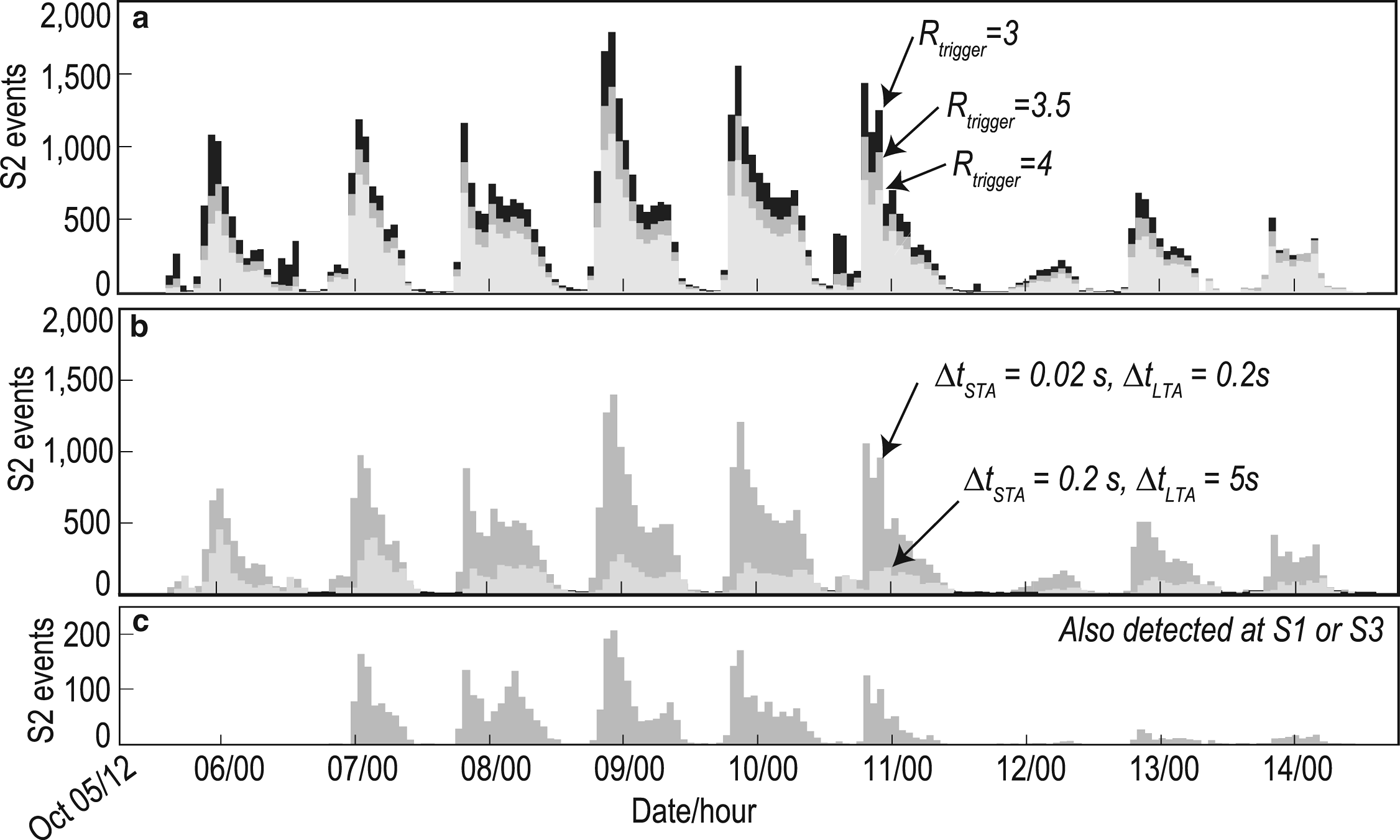
For the short-duration events, we tested the sensitivity of our results to the trigger threshold and time window (Fig. 3). The event counts detected with different trigger threshold R trigger values show similar diurnal cycles, although the numbers of seismic events identified with R trigger values of 3 and 4 are 134 and 76%, respectively, of the total number with an R trigger value of 3.5 (Fig. 3a). Using a STA time window of 0.2 s and a LTA time window of 5 s (from Barruol and others, Reference Barruol2013), we found that the number of detected short-duration events decreases to ~29% of previous values with shorter time windows (Fig. 3b). However, the diurnal variations still hold. In the following analysis, we focused on the temporal pattern of short-duration events and note that the number of detected seismic events depends on STA/LTA time windows and trigger (and detrigger) thresholds.
Sensitivity of hourly short-duration event counts at S2 to (a) trigger threshold R trigger, (b) STA/LTA window widths and (c) application of waveform association analysis (Fig. 8). Date and hour are in CST.
OBSERVATIONS
Meteorological conditions
The air temperature obtained from the AWS station at 4550 km elevation shows a clear diurnal cycle during the survey period (Fig. 6a). The average air temperature over 9 d was about −5.2°C, with a maximum temperature of 1.4°C and a minimum temperature of −8.1°C. The highest and lowest temperatures appeared at 13 CST and 7 CST, respectively. The temperatures rose rapidly from 9 CST to 12 noon and dropped slowly from 17 CST to 7 CST the following morning. The local sunrise and sunset during our survey period was ~7:30 CST and ~19 CST, respectively. The wind speed (Fig. 6b) and glacier surface humidity also show diurnal cycles, which results in a deviation of the ice surface temperature from the air temperature based on glacier surface energy budget considerations (Sun and others, Reference Sun2014). However, comparison between air and ice surface temperature measurements (Sun and others, Reference Sun2014) in June–September 2011 showed a similar diurnal pattern and same daily hours with maximum and minimum temperatures, although the glacier surface temperature was systematically lower than the air temperature by 2–4°C. In this study, we use the air temperature as a proxy for the air surface temperature, due to the lack of direct ice surface temperature measurements during our survey period.
On 11 October 2015, snowfall lasted from 15 CST to 7 CST the following morning (Fig. 6). Approximately 5 cm of snow covered the LGNT until the end of our observation. We did not collect hydrological data, but note that no sound of water flow was heard in the field and the downstream riverbed was dry during the observation period. We only observed limited surface melting in the daytime close to the glacier fringes. Although the air temperature was mostly below 0°C during our observation period, the local solar radiation, wind, and cloud may lead to slight surface melting at noon. In addition, we found an ice moulin of ~5 m wide at a distance of ~100 m to the northwest of our seismic station S1 (Fig. 1b), close to the glacier terminus. The ice moulin was dry during our survey period.
Long-duration events
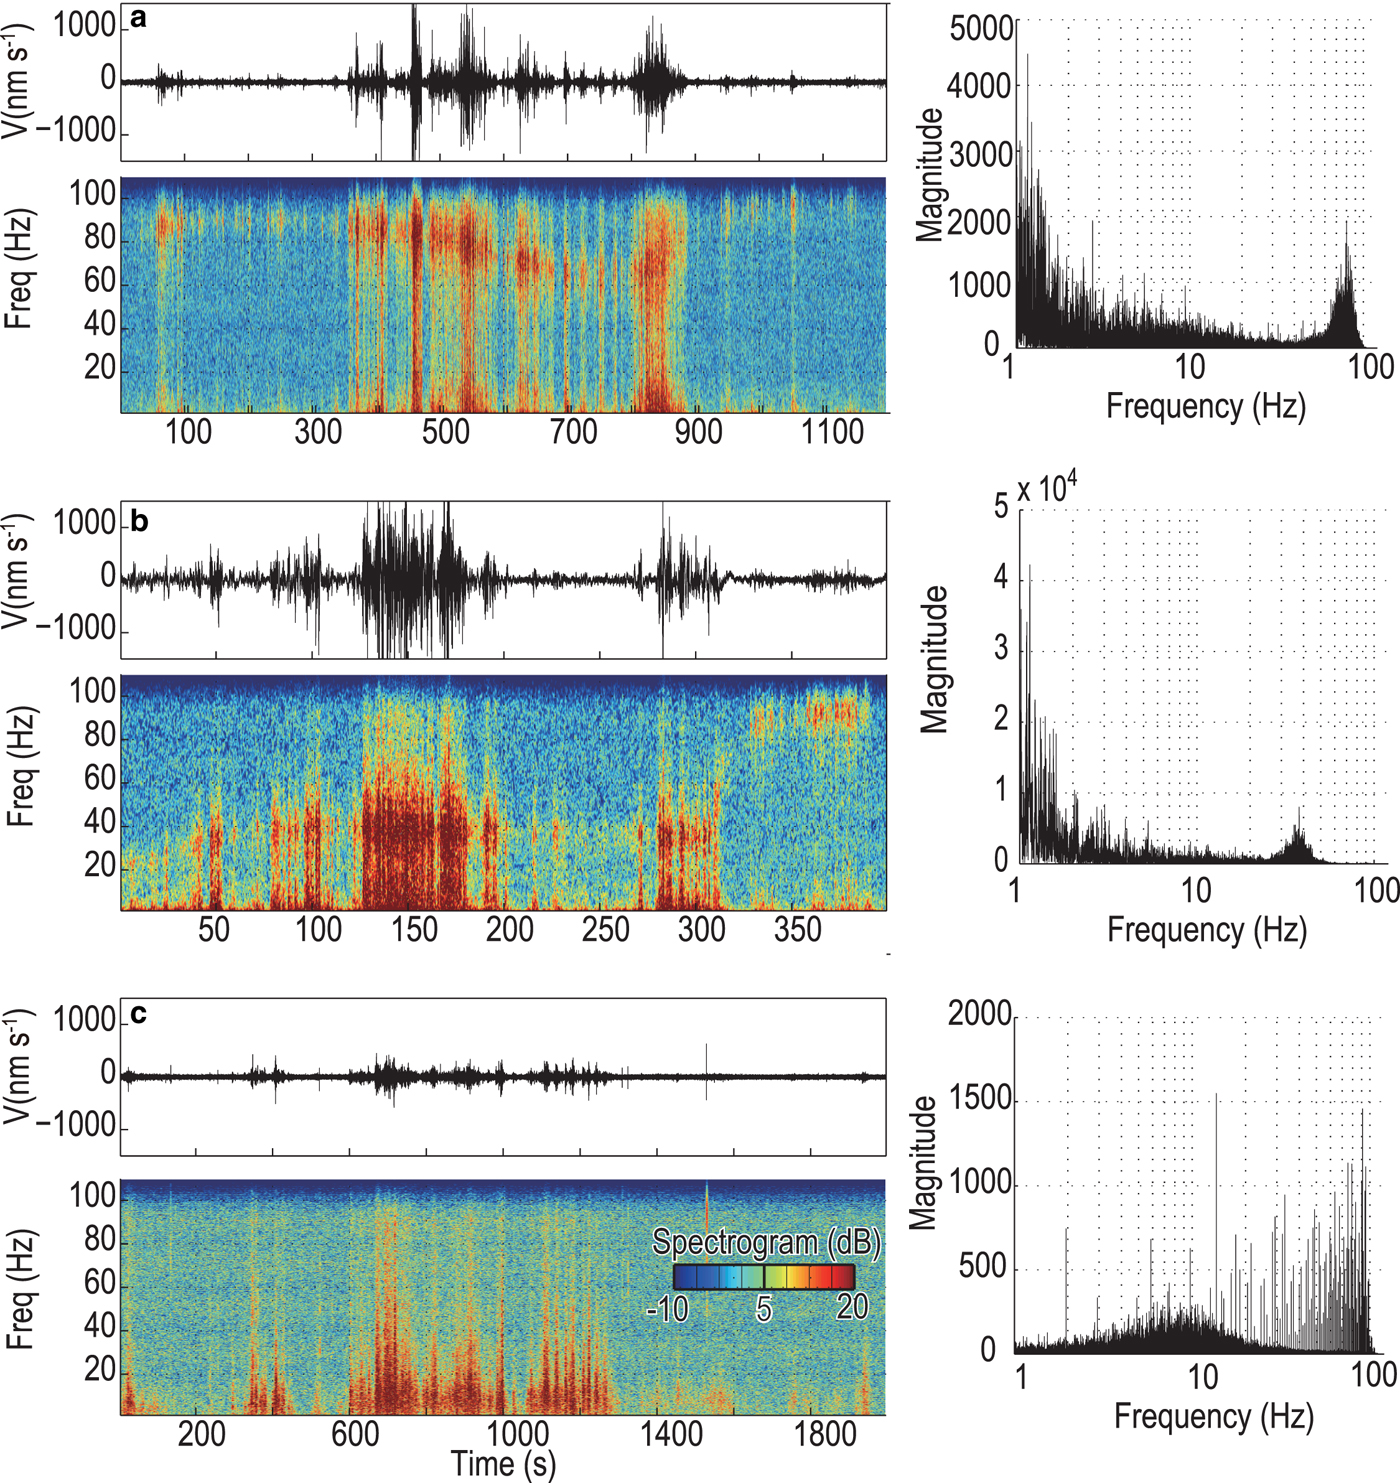
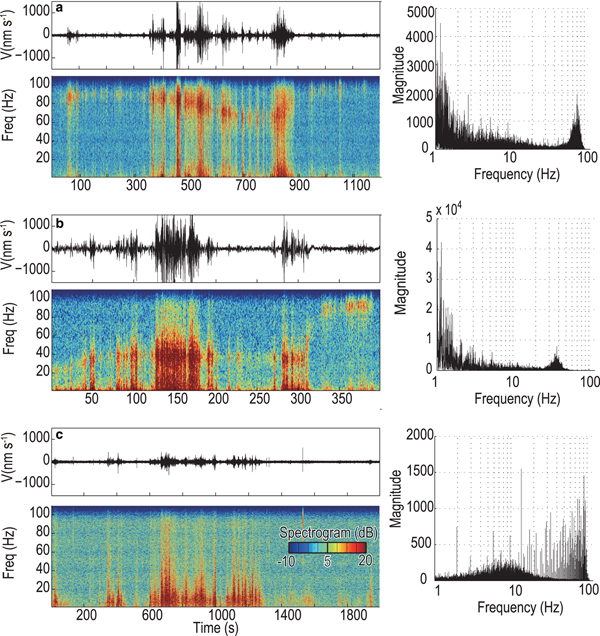
We detected a total of 158, 129, 65 and 49 long-duration events for the four stations in the 9 survey days (Fig. 4) based on the parameters in Table 1. Most of the long-duration events occurred between 12 noon and 18 CST in the daytime, when the air temperature ranged from −3 to −1°C. On the last day of our survey (i.e. 11 October), the long-duration events were also identified at night. The amplitudes of long-duration events are relatively low (Figs 2 and 5). Their waveforms lack impulsive onsets, and distinct body or surface wave arrivals. The duration of the long-duration events is tens of seconds to tens of minutes. We selected three representative long-duration events for detailed spectral analysis (Fig. 5), which shows a dominant frequency below 20 Hz. The long-duration events may also be associated with a higher secondary resonance frequency, e.g. 80 Hz in Figure 5a and 40 Hz in Figure 5b. Spectrograms for these two selected events also clearly show a temporal evolution of the resonance frequency (bottom panels of Figs 5a and b).

Waveforms (top), spectrograms (bottom) and power spectra (right) for three representative long-duration events with starting times of (a) 11:35:11 CST, (b) 12:10:05 CST and (c) 15:14:04 CST on 6 October, detected at the seismic stations S2, S2, and S4, respectively.
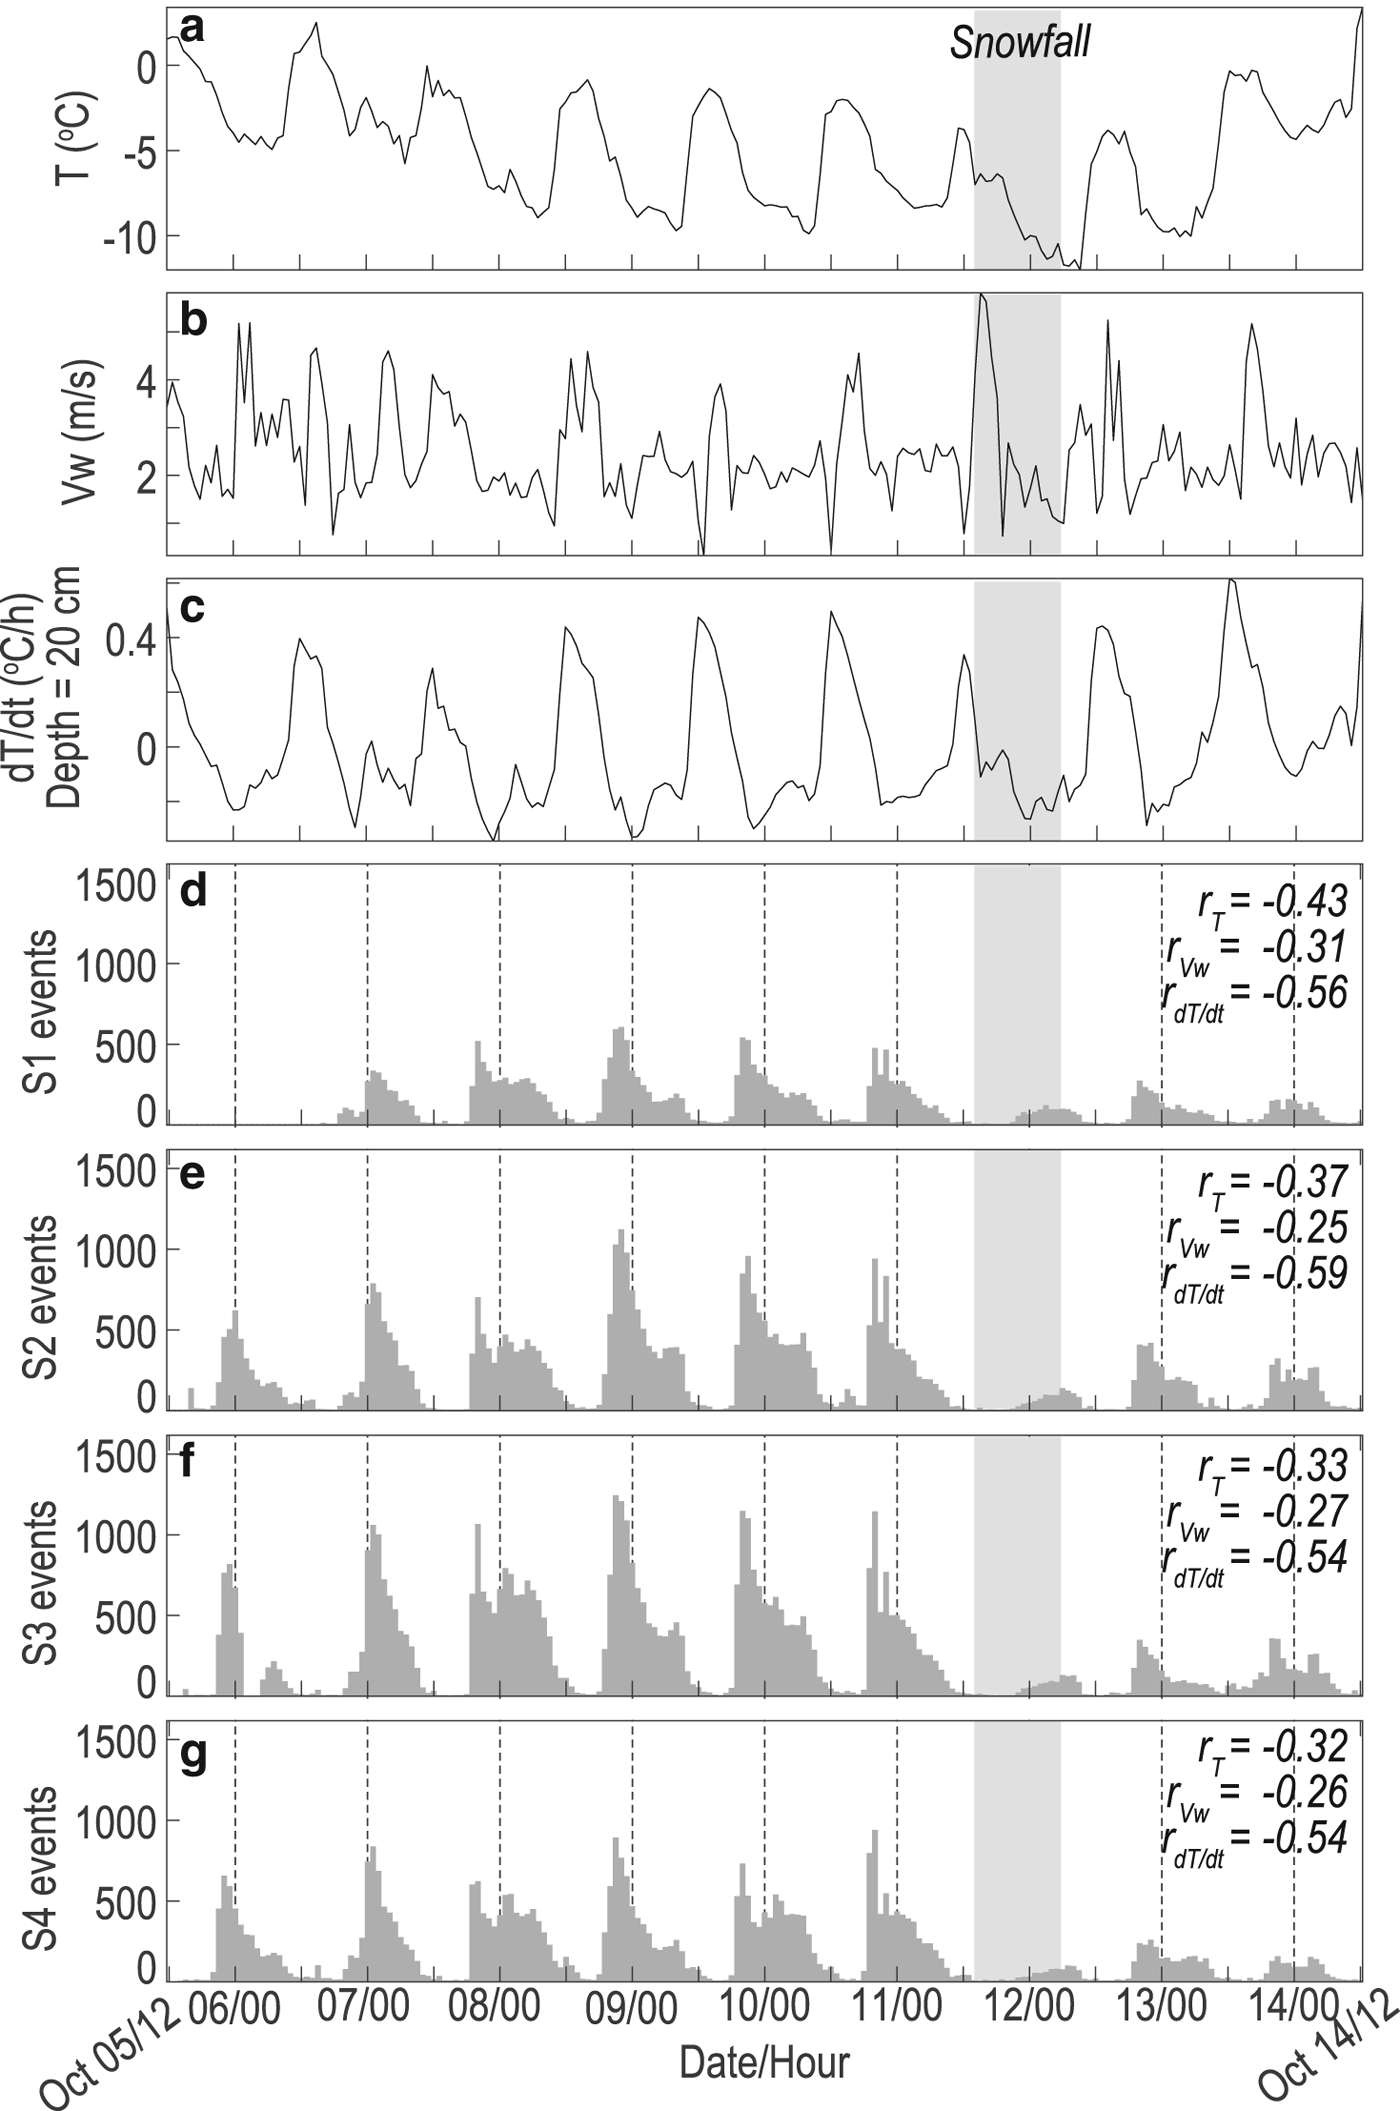
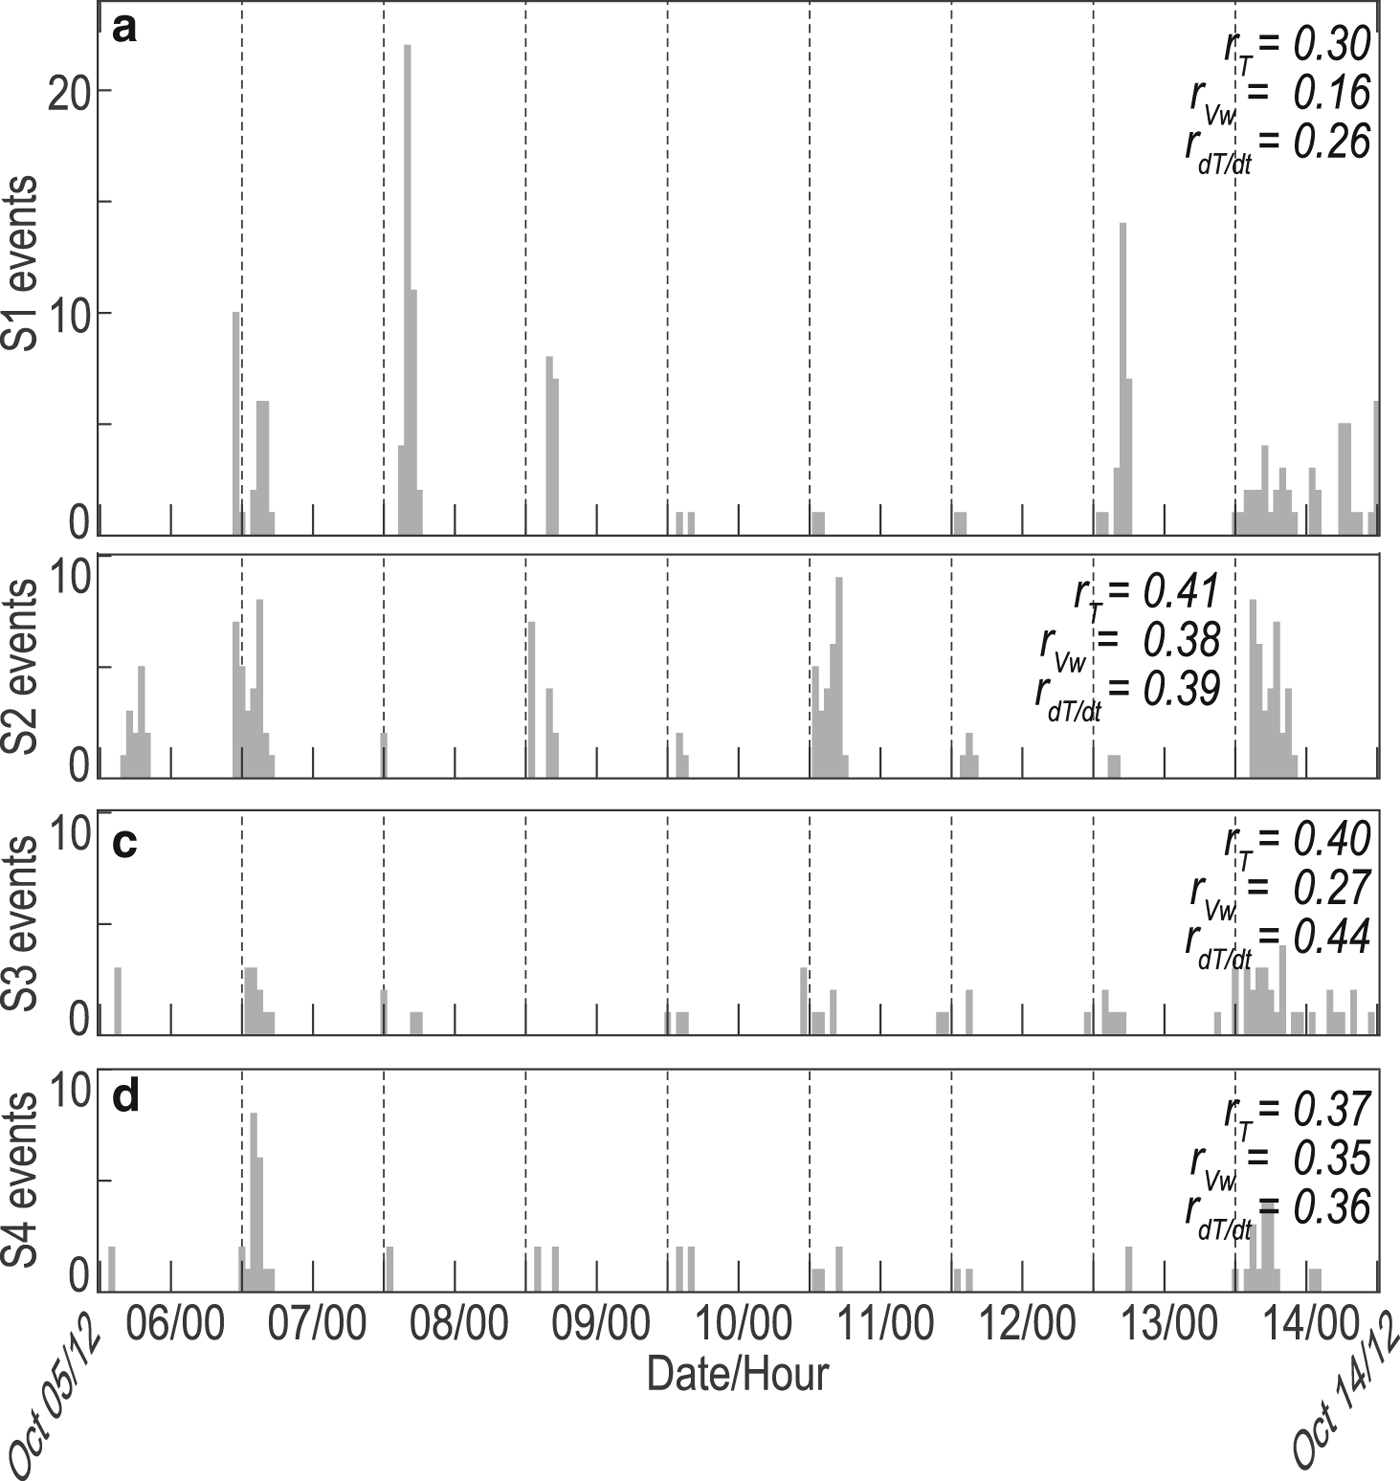
(a) Air temperature, (b) wind speed, (c) calculated temperature change rate at a depth of 20 cm and (d–g) hourly short-duration events detected at S1–S4. The correlation coefficients between short-duration events and air temperature, wind speed and temperature change rate are listed in the top right corners. Date and hour are in CST. We did not deploy station S1 on the first day.
Short-duration events
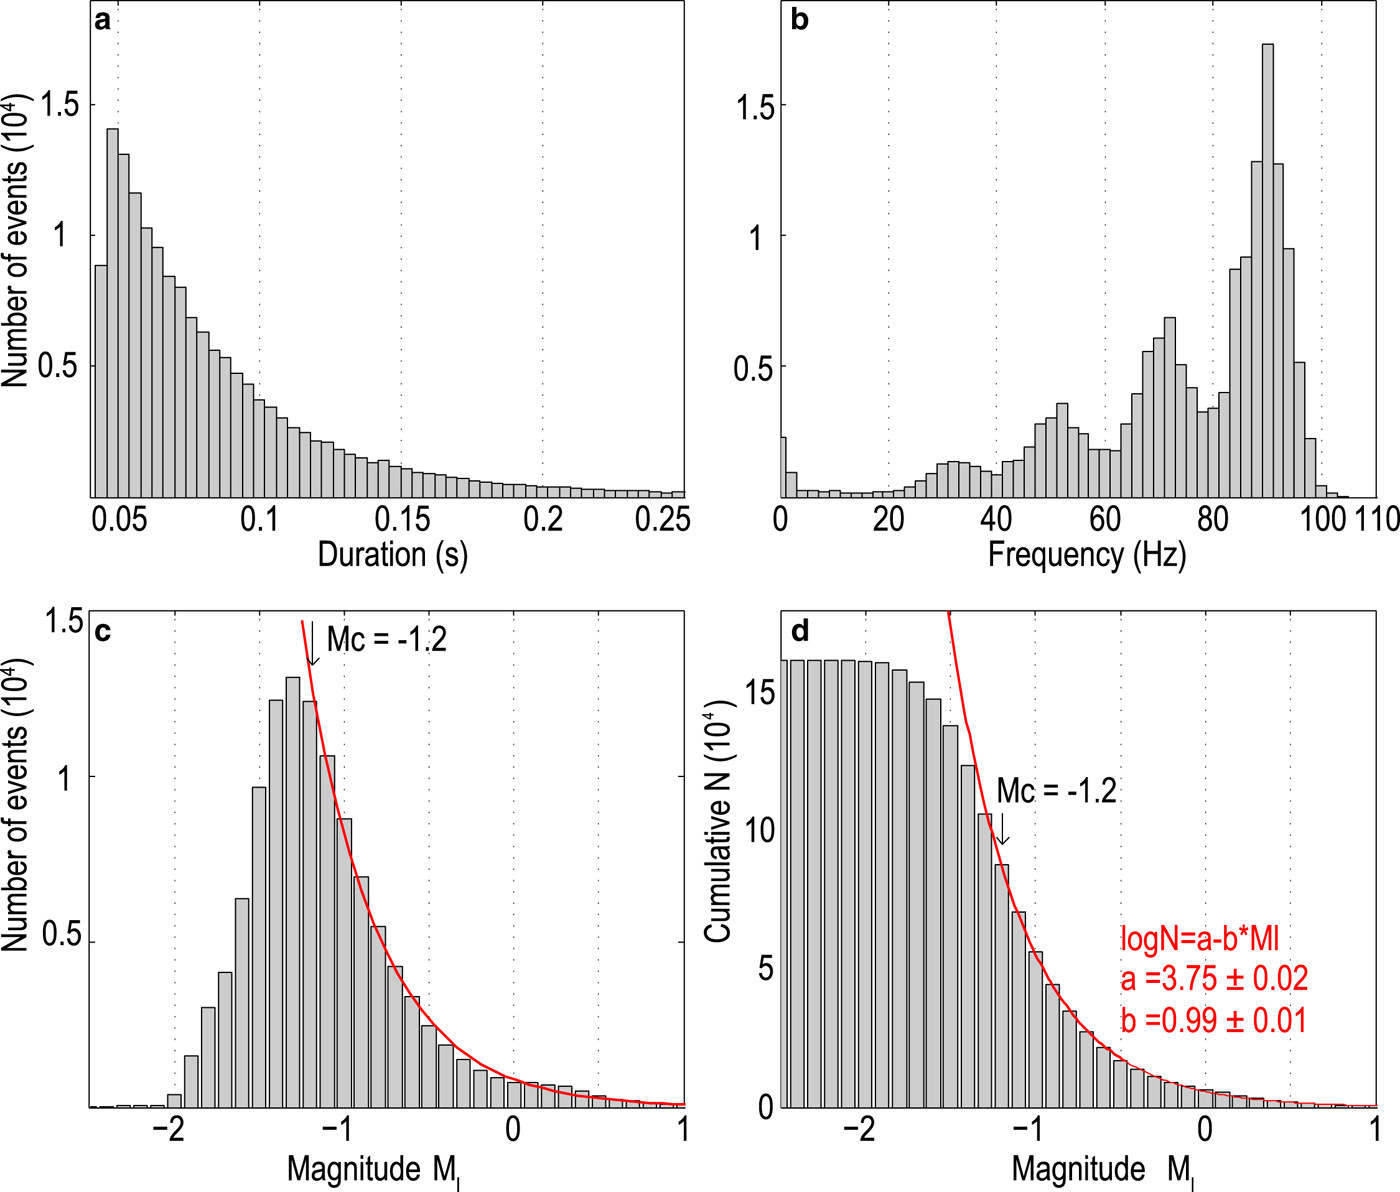
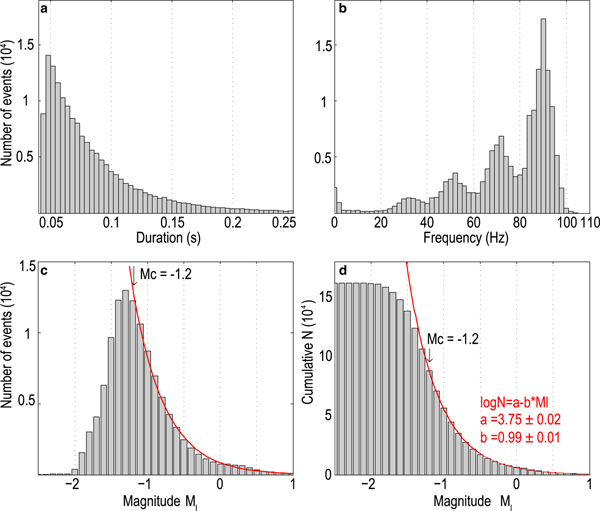
We detected 4514 short-duration events per day on average for an individual station (Fig. 6), which is hundreds of times more than the number of detected long-duration events. At each seismic station, the number of short-duration events was similar in the first 6 d of observation. After a snowfall, the daily number of short-duration events in the last 3 d of observation decreased to ~one-fifth of that during the first 6 d. Most (95%) of the short duration events lasted for 0.04–0.25 s (Fig. 7a). The waveforms of the short-duration events are dominated by Rayleigh waves without visible P- or S-phase arrivals (Fig. 2a). The dominant frequencies of the events range widely from 20 to 100 Hz, with local peaks at 30, 50, 75 and 90 Hz (Fig. 7b). The event counts increase with frequency, and the maximum frequency is close to the Nyquist frequency of 125 Hz.
Histograms of (a) duration, (b) frequency and (c) local magnitude for the short-duration seismic events. (d) Corresponding cumulative distribution of the seismic magnitude in (c). Red curves correspond to the best-fit to the Gutenberg–Richter distribution.
Estimates of the short-duration event counts after applying waveform association analysis to exclude the potential repeated counts. The events simultaneously recorded at two stations (light blue), three stations (orange), and four stations (red) are ~ 23, 4 and 0.2% of the events recorded at one station (blue).
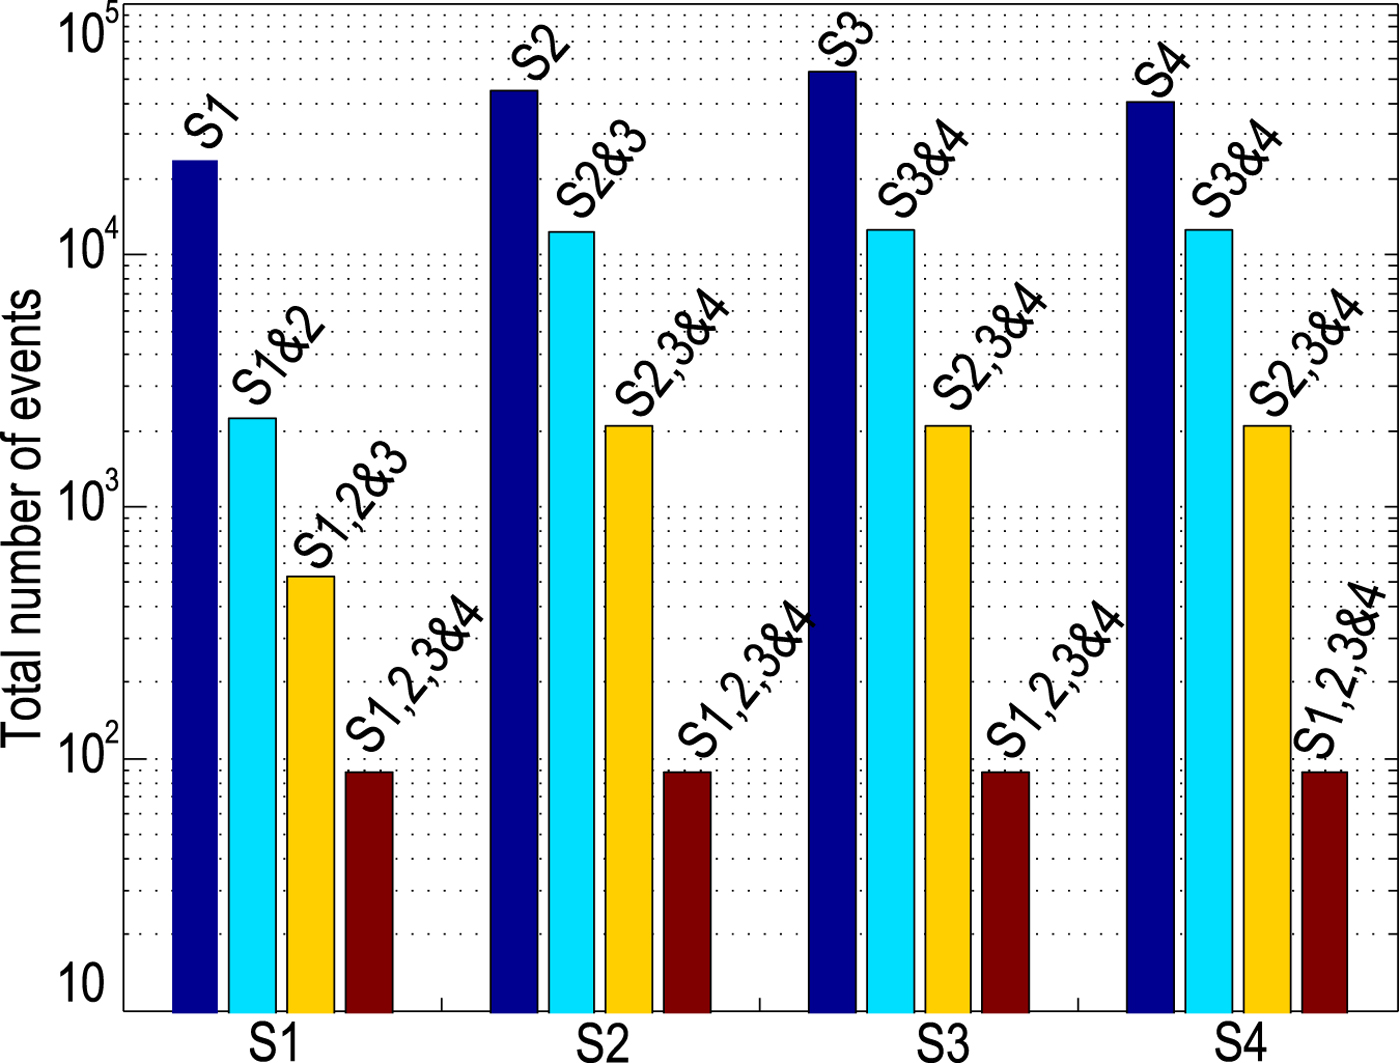
The dominance of Rayleigh waves is consistent with the waveforms observed in previous studies (Neave and Savage, Reference Neave and Savage1970; Walter and others, Reference Walter2009; Dalban Canassy and others, Reference Dalban Canassy2013; Röösli and others, Reference Röösli2014; Carmichael and others, Reference Carmichael2015), in which the source mechanism has been attributed to surface tensile cracks within the surface crevasse zone (top ~20 m of the glacier). However, our detected events are shorter in duration, higher in frequency and more frequent than reported from other glaciers. This is mainly due to our chosen shorter time windows for the STA/LTA detector, and less significantly due to repeatedly counting seismic events at multiple stations. To reduce duplicate counts, we performed a waveform association analysis, similar to Carmichael and others (Reference Carmichael2015). This analysis identifies the events detected at different stations within a time interval less than the expected travel time across the network as the same event. However, due to the difficulty of locating the small short-duration events in this study, we can only use the maximum travel time between two stations, which was calculated as the distance between two stations divided by an assumed Rayleigh wave velocity of 1660 m s−1 (Mikesell and others, Reference Mikesell2012). The waveform association analysis thus provides maximum estimates of the event counts that are recorded at two, three and four stations simultaneously, which are ~23, 4 and 0.2% of the total event counts recorded at one station (Fig. 8). The events recorded at multiple stations are expected to be larger in magnitude, and thus the rapid reduction in the event counts is in line with our expectation of an exponential decrease of event counts with magnitude. We plotted the hourly event counts detected simultaneously at two stations in Figure 3c. The diurnal cycle is clearly visible and thus is a robust observation.
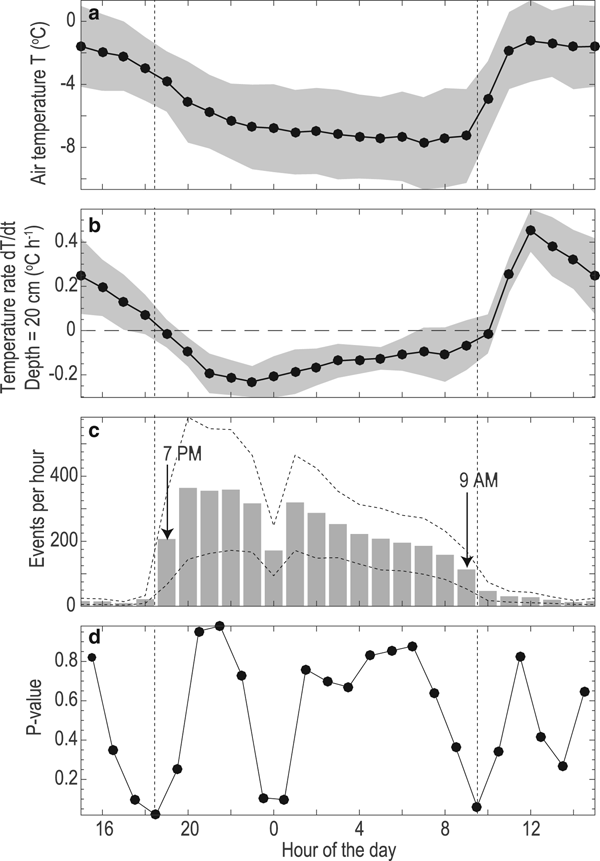
The diurnal cycle is the most significant temporal pattern of short-duration events (Figs 6 and 9). Nearly all the short-duration events occurred between 19 CST and 9 CST the following morning, with peak event counts at 20–23 CST. The starting and ending times of the daily burst of seismic events, 19 CST and 9 CST, were confirmed by low p-values in paired t-tests (Fig. 9d). These starting and ending times have an uncertainty of 1 h, as it is based on hourly seismic event counts. After the starting time of 19 CST, the event counts rapidly increased to the maximum occurrence frequency of 363 h−1 at 20 CST (Fig. 9c). The event counts then gradually decreased at night till 112 h−1 at 9 CST the next morning. In the daytime, the event frequency is <40 h−1.
Nine-day averaged (a) air temperature, (b) temperature change rate at a depth of 20 cm and (c) counts of short-duration events per hour. (d) Probability values (i.e. p-values) of the statistical test (i.e. two-sample t-test) for the hypotheses that the neighboring 2 h have different mean seismic event counts. The notable low p-values at 19 CST and 9 CST indicate the initiation and ending hours for the daily burst of the short-duration events. The gray regions and dashed lines indicate the 95% confidence intervals (i.e. 1.96 times the standard error) for the hourly mean values.
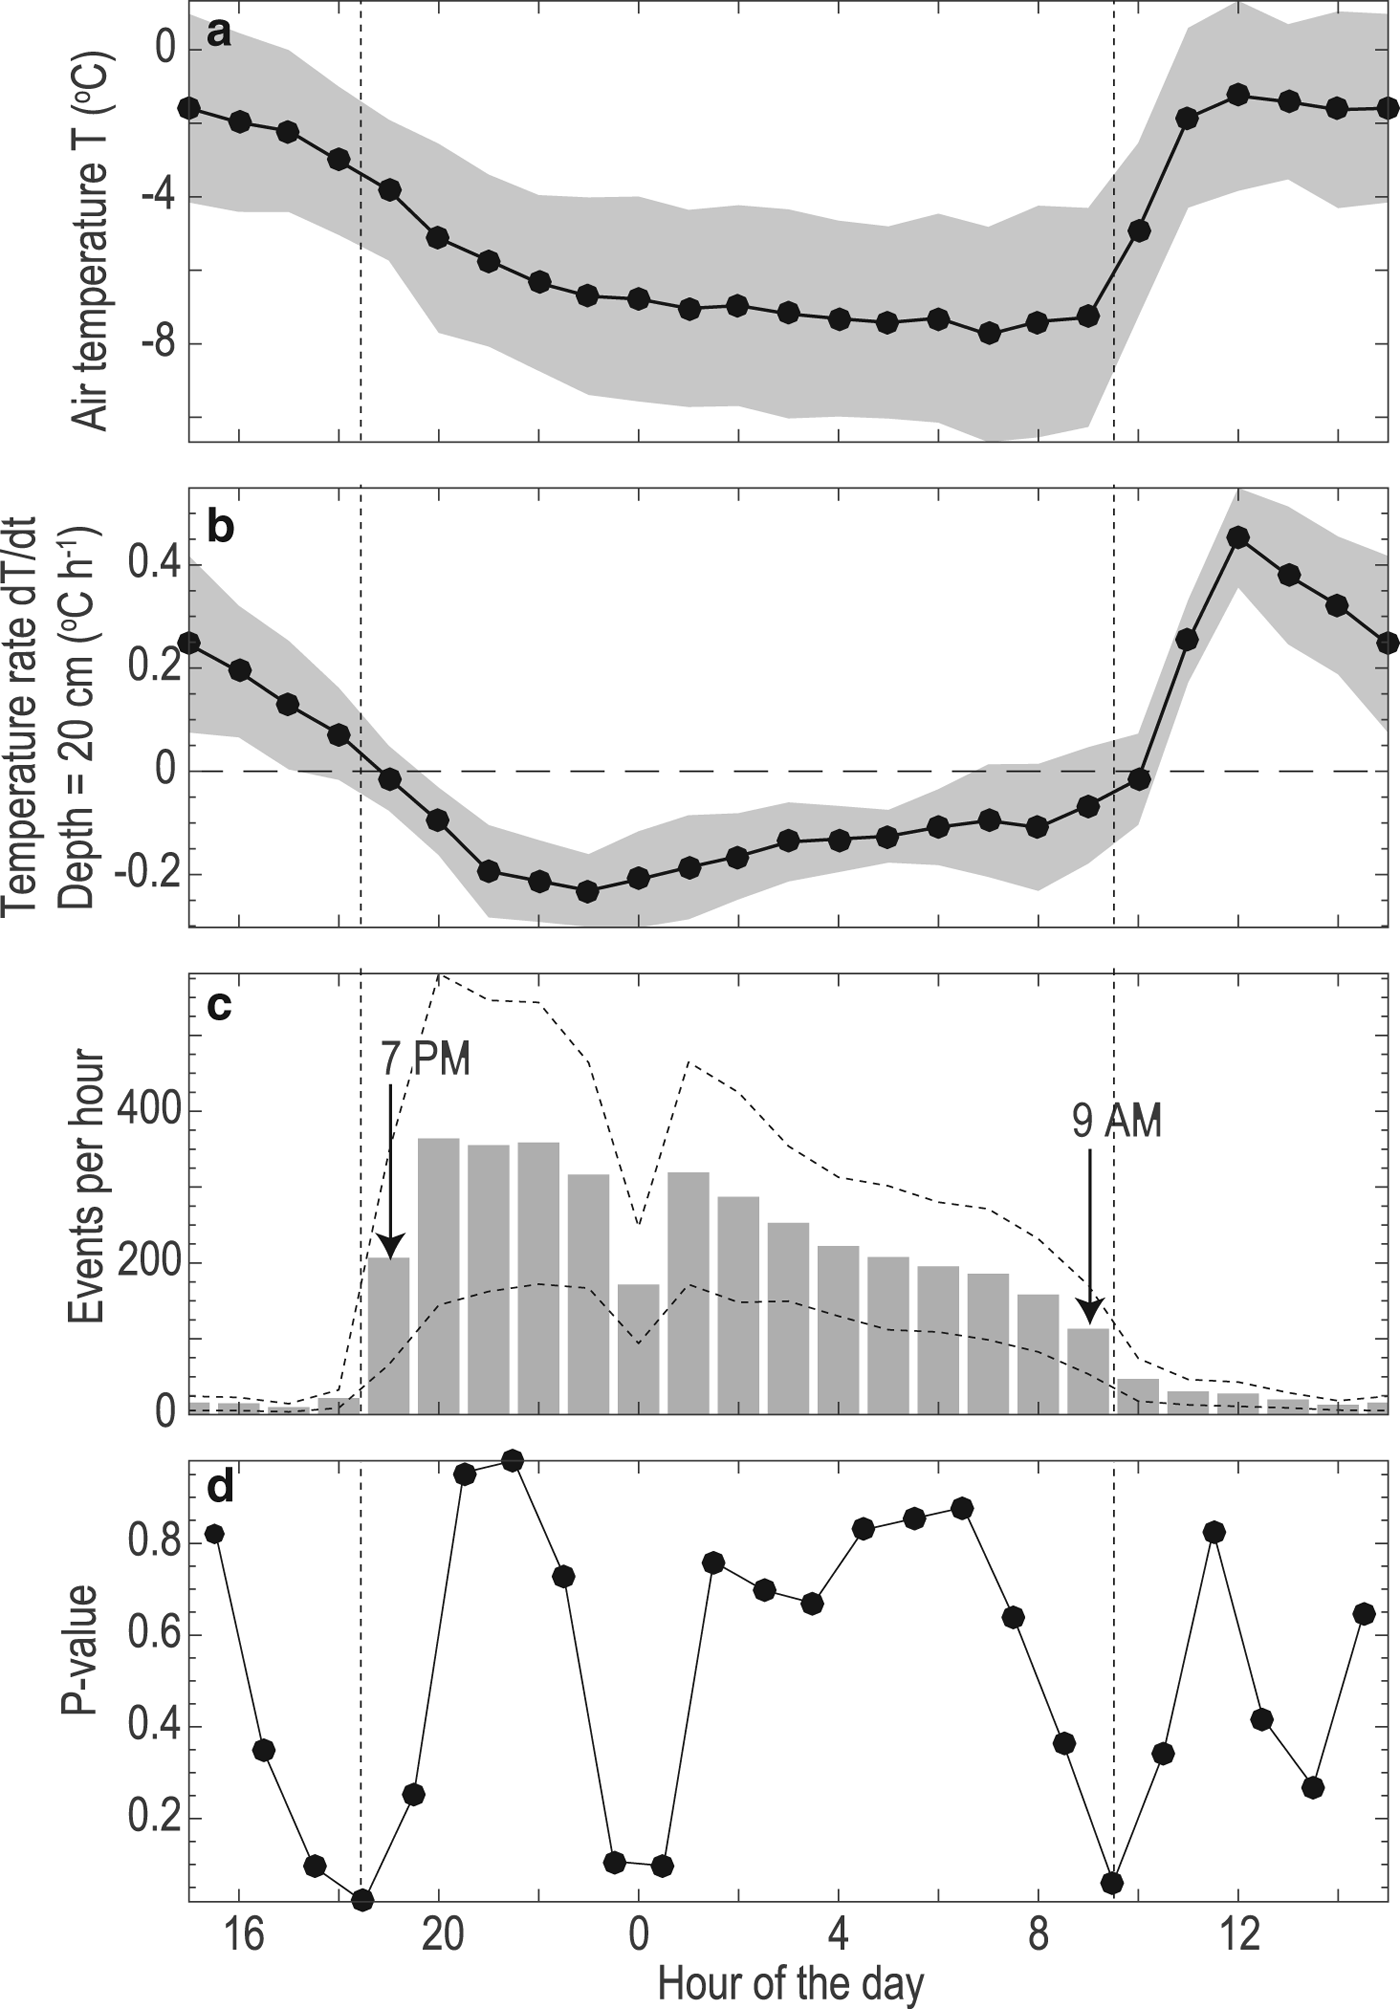
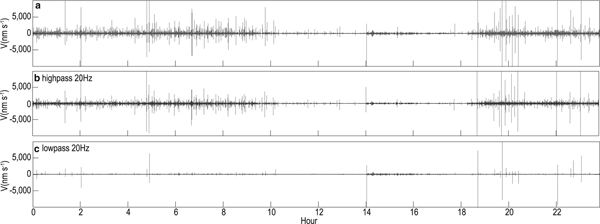
The counts of short-duration events (Figs 6d–g and 9c) are strongly and negatively correlated with the temperature fluctuation (Figs 6a and 9a) with correlation coefficients of −0.43 to −0.32 for the four seismic stations. Most short-duration events occur when the air temperature decreases from −4°C at 19 CST to −7°C at 9 CST the next morning. The occurrences of short-duration events are also negatively correlated with wind speed (Fig. 6b). It has been suggested that wind or water-generated tremor noise in the daytime may reduce the detectability of seismic events (Röösli and others, Reference Röösli2014). We applied a highpass filter at 20 Hz to suppress the low-frequency wind or water-generated noise. Results (Fig. 10b) show that the short-duration events are still concentrated at night due to their high frequency and amplitude. Therefore, the low detection of short-duration events in the daytime may not due to increased tremor noise. Instead, a source mechanism preferentially operating at night is necessary to explain the occurrence of short-duration events.
(a) One-day plot of the seismic records from 10 to 11 October at S2, and filtered seismograms after applying (b) highpass and (c) lowpass filters at 20 Hz.

Local magnitude of short-duration events
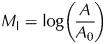
To characterize the energy/amplitude of the short-duration events, we calculated the local magnitudes (M l) using the method of Richter (Reference Richter1935):
 $$M_{\rm l} = {\rm log}\left( {\displaystyle{A \over {A_0}}} \right)$$
where the parameter A is the maximum amplitude of displacement, and A 0 is a correction factor defined by a reference zero magnitude earthquake that generates a displacement of 1 µm at a 100 km distance. We adopt the empirical A 0 value provided by Richter (Reference Richter1958), which was originally estimated for southern California but is also used worldwide (Roux and others, Reference Roux, Marsan, Métaxian, O'Brien and Moreau2008).
Our estimated M l of the short-duration events range from −2 to 0.5 (Fig 7c). Following Podolskiy and others (Reference Podolskiy and Walter2016) (citing Barruol and others, Reference Barruol2013), we found that the magnitude distribution fits a Gutenberg–Richter distribution (Gutenberg and Richter, Reference Gutenberg and Richter1944): log N = a − b × M l. We estimated the parameters a and b to be 3.75 ± 0.02 and 0.99 ± 0.01, respectively (Fig. 7d). Our estimated b value is close to 1, consistent with previous estimated b-value estimates for surface crack events (Podolskiy and Walter, Reference Podolskiy and Walter2016 and references therein). Our fitting to the Gutenberg–Richter distribution implies a magnitude of completeness of −1.2 (Fig. 7d), below which a large portion of weaker events were not detected. We also grouped the detected short-duration events on an hourly basis to test the evolution of b value. However, no clear temporal evolution trend of the b value was found.
SEISMIC SOURCE FOR SHORT-DURATION EVENTS
Thermally induced opening of surface cracks
Most of our detected short-duration events are expected to occur near the surface (maximum ~ 20 m depth) due to the dominance of Rayleigh waves (Walter and others, Reference Walter2009; Röösli and others, Reference Röösli2014; Podolskiy and Walter, Reference Podolskiy and Walter2016). In contrast, seismograms of deep or basal events have relatively large P-wave amplitudes without the presence of Rayleigh waves (Deichmann and others, Reference Deichmann2000; Dalban Canassy and others, Reference Dalban Canassy2013). Although it is impossible to determine the fracture mode (shear or tensile) of the seismic events due to the lack of P wave polarity observations, we suggest that the surface events are more likely to be tensile cracks as the tensile strength is much less than the shear strength (Schulson, Reference Schulson2002). Additionally, the tensile strength can be easily overcome at night due to thermal contraction (next paragraph). When local stress near the defects or crack tips exceeds the fracture toughness according to the fracture mechanic considerations (van der Veen, Reference van der Veen1998, Reference van der Veen1999), the formation or propagation of surface cracks can be recorded as seismic events.
The concentration of surface crack opening at night could be induced by thermal stress or refreezing meltwater. Daytime meltwater may accumulate in surface crevasses; refreezing of meltwater at night can trigger crack initiation and propagation (van der Veen, Reference van der Veen2007). An alternative mechanism is that reduced meltwater at night increases effective basal stress and thus induces spatial variations in surface strain (Carmichael and others, Reference Carmichael2015). However, the increased basal stress mechanism requires considerable amounts of meltwater at the base of the glacier, which is less likely to occur at LGNT in October.
Although we cannot exclude the effect of meltwater refreezing at night, we found that thermal contraction alone can induce enough tensile stress in the top tens of centimeters to promote tensile crack opening and seismic events (next section). This thermal contraction effect is supported by the significant negative correlation between the counts of short-duration events and the air temperature, and temperature change rate (Fig. 6). A similar negative correlation has been reported at a Himalayan glacier (Podolskiy and others, Reference Podolskiy, Fujita, Sunako, Tsushima and Kayastha2018) and interpreted as having a thermal origin. In addition, the snowfall on the 7th day of our observations is expected to damp heat conduction. The corresponding reduction in the thermal stress can explain the observed decrease in the icequake event number after the snowfall, which further corroborates the causal relationship between the thermal stress and short-duration events.
Thermal stress evolution
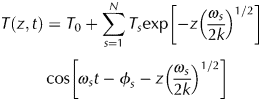
As the temperature decreases, the thermal contraction of the ice exerts tensile stress on the surface ice layer. Once the stress exceeds a threshold value, the opening of surface cracks occurs, which could be recorded as icequakes. To quantify the thermal stress in response to the diurnal temperature fluctuation, we first calculated the propagation of the temperature waves T(z, t) at depth z and time t based on the Fourier equation of heat conduction following Sanderson (Reference Sanderson1978) and Nishio (Reference Nishio1983):
 $$\eqalign{T(z,t) & = T_0 + \mathop \sum \limits_{s = 1}^N T_s{\rm exp}\left[ {-z{\left( {\displaystyle{{\omega_s} \over {2k}}} \right)}^{1/2}} \right] \cr & \cos \left[ {\omega_st-\phi_s-z{\left( {\displaystyle{{\omega_s} \over {2k}}} \right)}^{1/2}} \right]\;} $$
where the thermal diffusivity k is assumed to be 1.091 × 10⁻⁶ m2 s−1 for a constant ice density of 0.9 g cm−3 (Sanderson, Reference Sanderson1978). The temperature amplitudes T 0 and T s, frequency ω s and phase ϕ s depend on the Fourier transformation of surface temperature (assuming to be equal to the air temperature):  $T(0,t) = T_0 + \mathop {\sum}_{s = 1}^N T_s\,{\rm cos}(\omega _st-\phi _s)$. The Fourier transformation was computed using the Matlab Fast Fourier transformation codes fft and ifft, in combination with Fourier coefficient conversion codes complex2real and real2complex (written by Boynton GM for the course of Introduction to Programing for the Behavioral Sciences, Autumn, 2015, University of Washington. Retrieved from http://courses.washington.edu/matlab1/matlab).
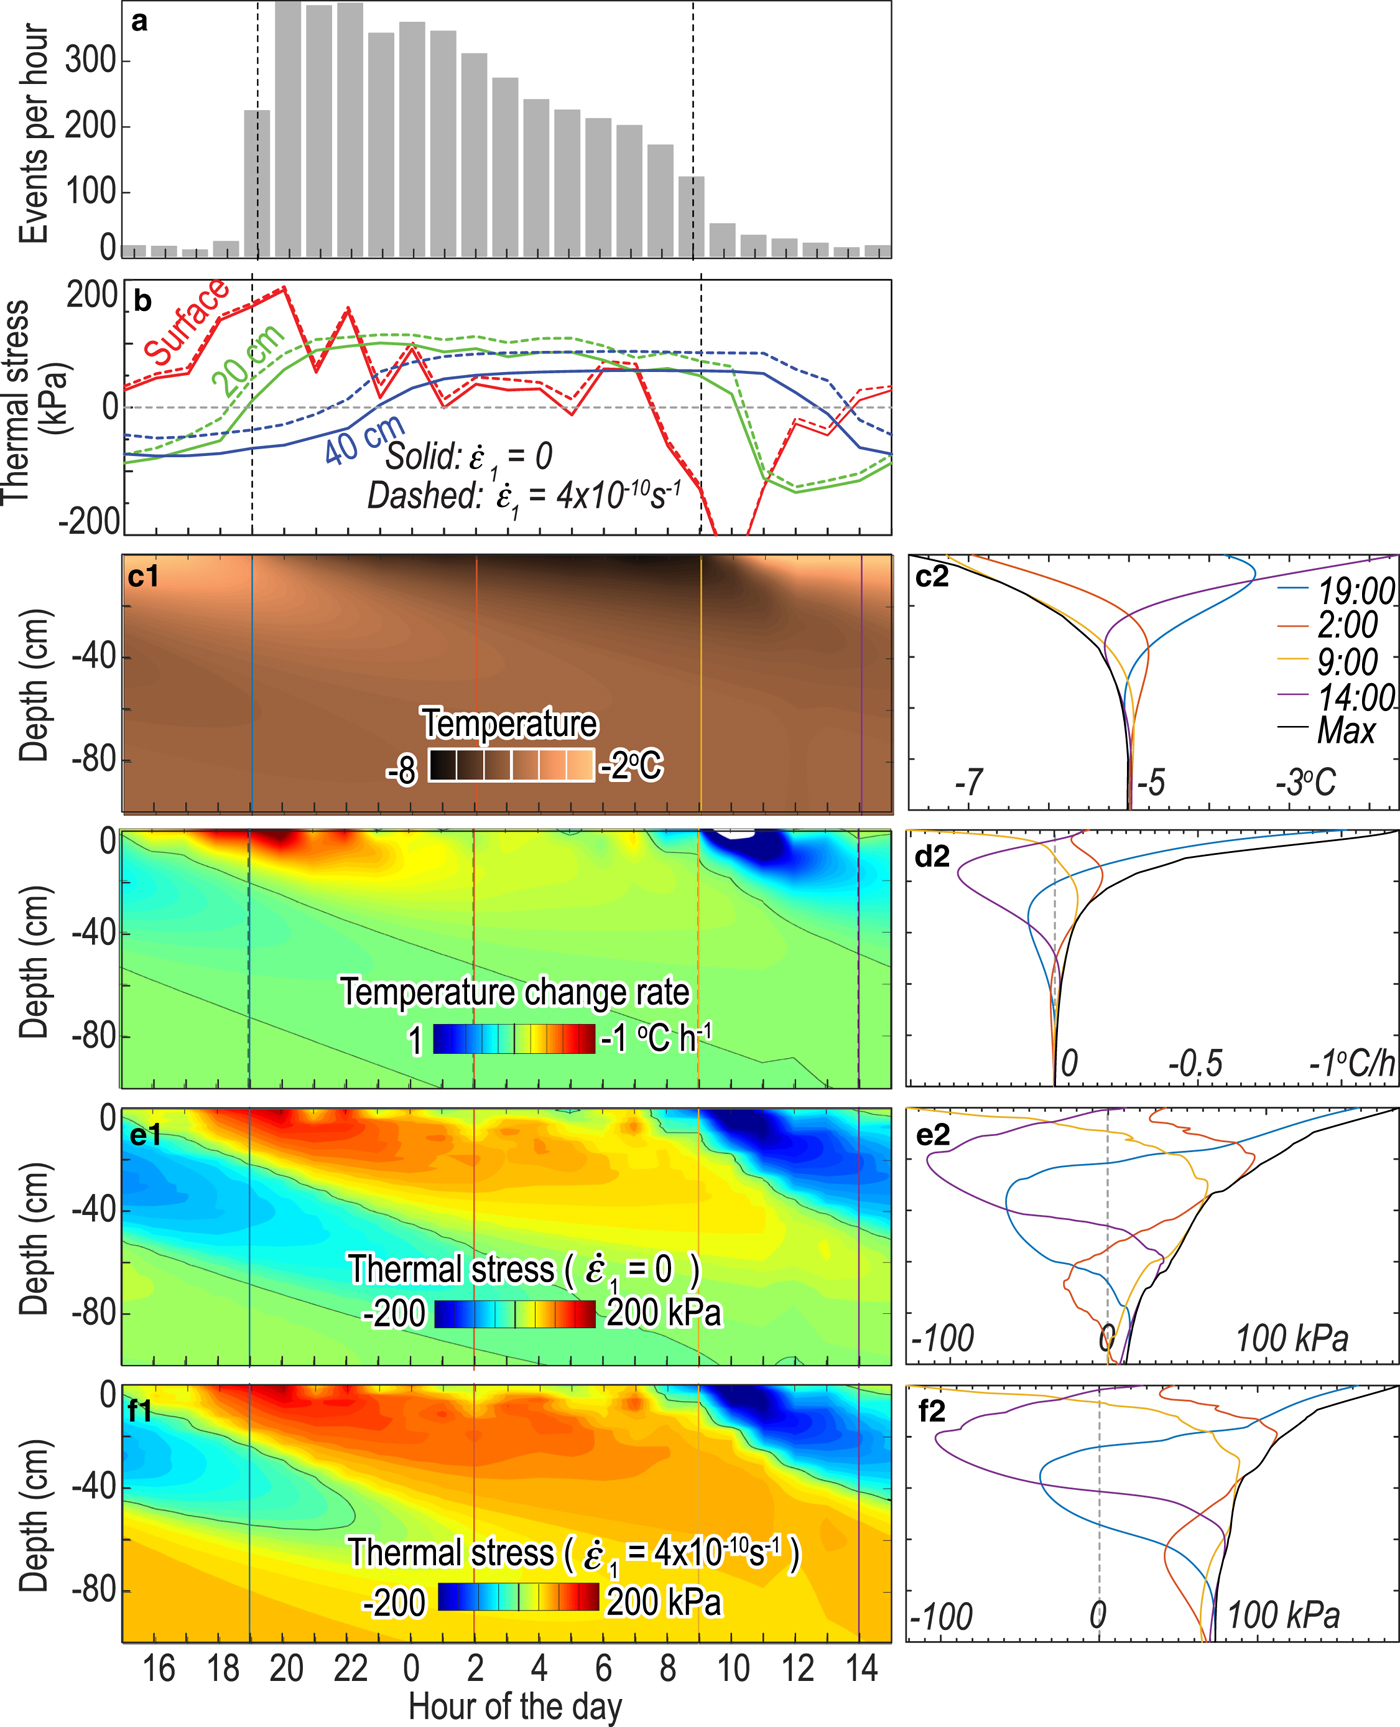
The short-duration events mostly occur when the temperature drops at a depth of 20 cm (i.e. when temperature change rate is negative). The correlation of the short-duration event counts with the temperature change rate at 20 cm depth (Figs 6c and 9b) is −0.56 to −0.54 for the four seismic stations, which is more significant than the correlation with the surface temperature fluctuation. The daily-averaged evolution of the temperature and temperature change rate within the top one meter of the glacier ice clearly shows diurnal variations (Figs 11c1 and d1). Figures 11c2 and d2 show depth-dependent temperature and temperature rate profiles at four representative hours. The diurnal temperature cycle only influences the top 1 m of the glacier, with rapidly decreasing amplitude with depth due to attenuation of temperature waves (black curves in Figs 11c2 and d2).
Hourly short-duration event counts, temperature, temperature change rate and thermal stress averaged for the 9 survey days. (a) Counts of short-duration events per hour (same with Fig. 9c). (b) Calculated thermal stress evolution at a depth of 0 (red), 20 (green) and 40 cm (blue). The solid and dashed curves correspond to (e1–2) the first scenario without background strain rate and (f1–2) the second scenario with background strain rate, respectively. (c1–2) Temperature wave propagation and corresponding depth-dependent temperature profiles at four representative times. Black curve shows the lower enveloping curve of the temperature at various depths. (d1–2) Depth-dependent evolution of temperature change rate and corresponding temperature change rate profiles. Black curve shows the higher enveloping curve. (e1–2) Calculated thermal stress evolution for the first scenario without background strain rate, and depth-dependent profiles. Black curve shows the upper enveloping curve of the tensile stress at various depths. (f1–2) Calculated thermal stress evolution for the second scenario with a background strain rate. The horizontal tension is positive.
Sanderson (Reference Sanderson1978) considered that the surface ice layer cannot move as it is constrained both horizontally and vertically. Internal stress, instead of strain, is thus induced by temperature changes. This thermal stress was calculated by considering the strain rate that would occur if the ice body is free to expand or contract, and then estimating the stress required to reduce the strain rate to zero using Glen's flow law (Glen, Reference Glen1955):
 $${\dot{\varepsilon}} ^{\prime}_i = C\tau ^{n-1}\sigma _i^{^\ast}, $$
where τ is the second invariant of the deviatoric stress tensor  $\sigma _i^* $ and C is the creep parameter. The best estimate for n is 3 based on laboratory experiments and glacial morphologic studies (Sanderson, Reference Sanderson1978; Cuffey and Paterson, Reference Cuffey and Paterson2010).
The final formula in Sanderson (Reference Sanderson1978) to estimate the horizontal principal stresses due to restrained thermal expansion and contraction are as follows:
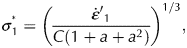 $$\sigma _1^{^\ast} = \left( {\displaystyle{{{{\dot{\varepsilon}}^{\prime}}_1} \over {C(1 + a + a^2)}}} \right)^{1/3},$$
 $$\sigma _2^{^\ast} = a\sigma _1^{^\ast}, $$
 where  ${\dot{\varepsilon}} ^{\prime}_1 = \dot{\varepsilon} _1-\alpha ((\partial T)/(\partial t))$ and ${\dot{\varepsilon}} ^{\prime}_2 = \dot{\varepsilon} _2-\alpha ((\partial T)/(\partial t))$ are the sum of the background strain rates, $\dot{\varepsilon} _1$ and $\dot{\varepsilon} _2$, minus the thermal strain rate (extension or contraction) if the ice body is unconstrained. $a = {\dot{\varepsilon}} ^{\prime}_2/{\dot{\varepsilon}} ^{\prime}_1$ is the ratio between the two strain rate components. The expansion coefficient α is assumed to be linearly related to the temperature as α = 5.4 × 10⁻⁵ + 1.8 × 10⁻⁷T (Nishio, Reference Nishio1983) instead of a constant value in Sanderson (Reference Sanderson1978).
The creep factor C depends on the temperature following an Arrhenius relationship:  $C = C_*{\rm e}^{-(Q/R)\lpar {(1/T)-(1/T_*)} \rpar }$, where T is the variable temperature that depends on both depth and time, and T * = 263 K is a transition temperature above which ice softening increases. The gas constant R is equal to 8.314 J mol−1 K−1. The parameter values C * = 3.5 × 10⁻²⁵ Pa−3 s−1 and Q = 1.15 × 10⁵ J mol−1 are based on laboratory experiments and glacial morphologic studies (Cuffey and Paterson, Reference Cuffey and Paterson2010 and reference therein). This C * value is several orders of magnitude larger than the value used by Sanderson (Reference Sanderson1978), while Q is only slightly larger than Sanderson (Reference Sanderson1978). This updated C * value incorporates the state-of-the-art lab and field measurements of the glacier creep characteristics, resulting in a lower magnitude of stress in our calculation than Sanderson (Reference Sanderson1978).
We considered two scenarios for the background strain rate:  $\dot{\varepsilon} _1 = \dot{\varepsilon} _2 = 0$ and $\dot{\varepsilon} _1$ = 4 × 10⁻¹⁰ s−1 (i.e. 0.013 a−1) and $\dot{\varepsilon} _2$ = −4 × 10⁻¹⁰ s−1. The calculated thermal stress $\sigma _1^* $ has similar diurnal pattern in the top 50 cm of the glacier (Figs 11e–f), but the latter scenario is associated with an additional extensional stress of ~70 kPa at depth due to the background extensional strain rate (Fig. 11f). Our stress calculation for the first scenario shows that the thermal expansion and contraction of the ice leads to diurnal variations in $\sigma _1^* $ from compression to tension with a maximum tensile stress of 48–184 kPa in the top 50 cm (Fig. 11e2). The calculated surface stress becomes tensile after 15 CST as the air temperature starts to decrease (red curves in Fig. 11b). The tensile stress region extends to 20 cm when the hourly short-duration events notably increase at 19 CST. At this time, the surface tensile stress is 156 kPa. After that, the tensile stress region continuously penetrates to greater depth, with reduced amplitude due to depth attenuation of temperature waves. At 8 CST, the air temperature starts to increase and the surface stress becomes compressional. Accordingly, the tensile stress region shrinks. One hour after that, the top 10 cm becomes compressional in stress. This is also the ending time of the daily burst of short-duration events.
For the latter scenario with background strain rate, we assumed a background compressional strain rate  $\dot{\varepsilon} _2$ of −4 × 10⁻¹⁰ s−1. This strain rate is based on the surface velocity difference at elevations of ~4400 m and 4500 m measured in autumn and winter by Liu and others (Reference Liu, Qin, Du, Sun and Hou2011). This compressional strain rate is expected to be longitudinal. We further assumed a maximum extensional strain rate $\dot{\varepsilon} _1$ = 4 × 10⁻¹⁰ s−1, presumably in the transverse direction, as the magnitude of the maximum extensional strain is expected to be close to $\dot{\varepsilon} _2$ from previous glacier strain rate measurements (Meier and others, Reference Meier, Kamb, Allen and Sharp1974). The maximum tensional stress for this scenario is the same with the first scenario on the surface, but an increase of 36 kPa at 50 cm depth in comparison with the first scenario is due to the background tensional strain rate. The background strain rate dominantly controls the stress state at one-meter depth or deeper, as the stress asymptotically approaches 73 kPa in this scenario (Fig. 11f2). The enhanced tensile stress at depth can promote downward propagation of surface cracks and continued seismic events.
In either scenario, our thermal stress calculation clearly shows that the daily variations in the glacier thermal state are prominent only in the top tens of centimeters of the glacier. If the thermal effect dominates, it implies that the night-time short-duration events occur or at least initiate within the top tens of centimeters. In addition, the thermal stress is much lower than the stress threshold of 1 MPa that is required to fracture intact ice (Schulson, Reference Schulson1999 and references therein). Instead, the thermal stress is on the same order of magnitude as the critical tensile stress for crack nucleation and propagation if small pre-existing defects or weak planes exist (van der Veen, Reference van der Veen1998).
Comparison with fracture mechanics
Based on the fracture mechanic considerations, the initiation of seismic events implies the moment when the maximum thermal stress reaches the critical tensile stress for fracture formation. The thermal tensile stress during 19 CST to 9 CST the next day with daily bursts of short-duration events is on the order of tens of kilopascals with a maximum tensile stress of 156 kPa on the surface. The calculated thermal tensile stress is consistent with the fracture models of van der Veen (Reference van der Veen1998), who suggests a critical tensile stress range of 90–320 kPa for a densely spaced crack system. The nonexistence of a clear b-value evolution trend implies that the detected short-duration events at different hours of the day likely occur in a similar strain and stress state (Nishio, Reference Nishio1983; Podolskiy and Walter, Reference Podolskiy and Walter2016). As the state of stress and strain differs notably with depth, the short-duration events may not propagate with depth, but mainly correspond to initiation of new surface cracks.
The uncertainties in our stress calculation are primarily due to the applicability of Glen's flow law and a lack of constraints on creep parameter C * in Glen's flow law. The applicability of Glen's flow law in different temperature and strain rate region is currently under debate (Schulson and Duval, Reference Schulson and Duval2009) and requires further strain and stress measurements. For example, Weiss and others (Reference Weiss, Schulson and Stern2007) found that instead of viscous deformation, the winter and/or perennial sea ice behaves as an elastic-brittle body. In this scenario, the temperature difference between the surface and bottom of the glacier may induce a thermal bending moment at night (Evans and Untersteiner, Reference Evans and Untersteiner1971; Bažant, Reference Bažant1992; Carmichael and others, Reference Carmichael, Pettit, Hoffman, Fountain and Hallet2012), which is later released by microseismic events. For the creep parameter, material properties such as impurities, reduced grain size, increased water content and anisotropic ice fabrics can increase C * by several fold, and the field measurements of C * in different glaciers also commonly varies by a factor of 1–3 (Cuffey and Paterson, Reference Cuffey and Paterson2010 and references therein). Material factors are also suggested to influence the fracture toughness (Vaughan, Reference Vaughan1993; Rist and others, Reference Rist1996, Reference Rist1999). Therefore, local field stress and strain measurements are necessary for further calibrating the constitutive relationship and quantitatively understanding icequakes and glacier dynamics.
POSSIBLE SOURCES FOR LONG-DURATION EVENTS
The tremor-like long-duration events can be produced by subglacial water flow or repeated basal ruptures (Helmstetter and others, Reference Helmstetter, Moreau, Nicolas, Comon and Gay2015; Podolskiy and Walter, Reference Podolskiy and Walter2016). The correlation between ice stream velocity and tremor signal is necessary to associate the tremor with basal ruptures (Winberry and others, Reference Winberry, Anandakrishnan, Wiens and Alley2013). However, there is no variations of glacier displacement correlated with the long-duration events in the coincident position measurements at stations S2 and S3 (Yan Peng, manuscript in preparation). Considering the slow surface velocity (~9 cm a−1) in the study area (Liu and others, Reference Liu, Qin, Du, Sun and Hou2011; Wang and others, Reference Wang2016) and the thinness of the ice (56–128 m), we excluded the mechanism of repeated basal rupture for the long-duration events. Instead, we suggest that our long-duration events are most likely due to subglacial water flow. Firstly, our tremor-like long-duration events emit seismic energy in a dominant frequency of <20 Hz, which have been attributed to water resonance in fluid-filled moulin (Röösli and others, Reference Röösli2014). Our observed secondary resonance frequency of 40 or 80 Hz is also close to the water resonance frequency of 30–80 Hz for water-filled fractures (Helmstetter and others, Reference Helmstetter, Moreau, Nicolas, Comon and Gay2015). In addition, more counts of long-duration events are observed at down-glacier stations, where melting is likely to be more prevalent and water flow should be larger. We also found an ice moulin near the seismic station S1 where the largest number of long-duration events were detected. It is thus possible that a large amount of these events are associated with water resonance in the ice moulin. Although we did not directly observe water flow in the moulin or downstream riverbed, surface melting in the daytime may be guided by the near-surface hydrological system into the ice moulin. Finally, the temporal evolution of the resonance frequency (Fig. 5) is also consistent with the water resonance mechanism, as it can be explained by the changes in the fracture width/length or water level (Röösli and others, Reference Röösli2014; Helmstetter and others, Reference Helmstetter, Moreau, Nicolas, Comon and Gay2015). Therefore, we suggest that the most likely source mechanism for the long-duration events is water resonance within the ice moulin.
We cannot exclude the influence of wind as the hourly event counts and wind speed are positively correlated with correlation coefficients of 0.26–0.44. In addition, the wind speed at 14–18 CST (Fig. 6b) exceeds a critical value of 3 m s−1 that can induce large seismic noise (Withers and others, Reference Withers, Aster, Young and Chael1996). However, the wind noise cannot explain the existence of resonance frequencies at selected frequency ranges (e.g. 80 Hz in Fig 5a). Although additional seismic measurements within deep boreholes are necessary to elucidate this point, we suggest that wind noise alone cannot explain the all of detected long-duration events.
CONCLUSIONS
Our observations and analyses of seismic events and temperature fluctuations in LGNT lead to the following conclusions:
(1) We detected long-duration tremor-like events in the daytime and short-duration seismic events in the night-time at LGNT.
(2) The night-time short-duration events are characterized by relatively short duration, high dominant frequency, large event counts, and dominance of Rayleigh waves, and are thus inferred to be caused by near-surface crack opening. On a daily basis, the occurrence of the short-duration events was negatively correlated with the temperature and temperature change rate. Although we cannot exclude the effect of meltwater refreezing, night-time thermal tensile stress in the top tens of centimeters of the glacier exceeds the critical tensile stress and thus is enough to induce ice fractures and associated seismicity.
(3) The daytime long-duration events are characterized by relatively long duration, low dominant frequency, low event number, and tremor-like waveform. They are likely related to water resonance in an ice moulin filled by daytime meltwater.
ACKNOWLEDGEMENTS
We thank Qin Xiang at Cold and Arid Regions Environmental and Engineering Research Institute, Chinese Academy of Sciences, Yan Peng at Wuhan university and other colleagues working at Qilian Mountain Station of Glaciology for their support of the seismic experiment. We also thank F. Walter, E. Podolskiy and J. Amundson for their valuable reviews and constructive comments. The project was supported by the National Natural Science Foundation of China (41576065, 41776189, 41806067, 91628301), the Scientific Research Fund of the Second Institute of Oceanography, SOA (QNYC201503), the Chinese Polar Environment Comprehensive Investigation and Assessment Programmes (CHINARE 03-03, 04-03, and 01-03), the Key Laboratory of Ocean and Marginal Sea Geology, Chinese Academy of Sciences (No. OMG18-XX) and the Chinese Academy of Sciences (Y4SL021001).






 Open access

