


1. Introduction
At the beginning of the second decade of the 2000s, the European Commission started measuring the progress of Member States (MS) towards digitalisation. A measurement initiative called the e-Government Benchmark was created in 2013,Footnote 1 and subsequently integrated into a broader ‘Digital Economy and Society Index’ (DESI).Footnote 2 In 2022 the DESI was officially incorporated in the ‘Digital Decade Policy Programme 2030’ as set out by the Commission in its 2021 communication entitled ‘2030 Digital Compass’Footnote 3 (hereinafter DDPP 2030) and renamed ‘DESI Dashboard for the Digital Decade’ (hereinafter DESI Dashboard).Footnote 4 The DESI Dashboard is now used by the European Union (EU) as the core tool ‘to monitor the progress of the Union towards the general objectives and the digital targets’Footnote 5 of the DDPP 2030, the overall aim of which is to empower citizens and businesses through digital transformation. Further, on the assumption that ‘the degree of digitalisation of the economy or society is a critical underpinning of economic and societal resilience as well as a factor in their global influence’,Footnote 6 the DDPP 2030 identifies the DESI Dashboard as the tool to measure and stimulate improvements in the achievement by the MS and the EU of many economic, social and environmental targets included in the 2030 Agenda for Sustainable Development adopted by the General Assembly of the United Nations in 2015.Footnote 7 This is in line with the current EU sustainability agenda, whose main axes include a more circular and climate-neutral economy, sustainable product design, corporate sustainability, fair labour and digitalisation.Footnote 8
Section 2 will take a more detailed look at what the DESI Dashboard is and how its message and mission are taken for granted by the wider public. As we will see, the Dashboard is expected to provide a reliable description of the state of the art and, implicitly, to push MS to improve their level of digitalisation and sustainability performance. However, a closer analysis of the variables that the Dashboard considers (Section 3) and the methodology on which that is based (Section 4) reveals a different picture. As emphasised in Section 5, the DESI Dashboard does not collect objective data on crystal-clear targets, and is not concerned with sustainability challenges. Rather, the DESI Dashboard embeds a very specific, neo-liberal vision of digitalisation policy, hiding this vision behind a veil of numbers. As Section 6 will remind us, none of this is new in the world of quantitative measurements. The literature on ‘new governance’ has long highlighted the EU’s increasing use of soft, and often quantitative, instruments to coordinate and direct state action, especially where the competences, powers and consensus for ‘hard’ intervention are lacking.Footnote 9 The growing reliance on quantitative techniques, performance-based assessments and self-regulation to pursue pro-market policies – what has been called the ‘managerial turn’Footnote 10 of contemporary governance – is certainly not an EU specificity: a similar shift is taking place at virtually every level of our societies, at least in the so-called Global North.Footnote 11 Similarly, the use of quantitative indicators to pursue sustainability policies on paper only through soft law means is a feature that characterises the entire field, within and beyond the EU borders.Footnote 12 From this point of view, the main contribution of this short contribution lies in providing the first (to the author’s knowledge) deep dive analysis of the contents and the methodology underlying the DESI Dashboard. At the same time, the study confirms the governance dynamics we are trapped in, the lies we like to believe, and the truths that are right in front of us, but which are easier to manage when they are covered by a thick layer of numerical dust.
2. The DESI Dashboard in a Nutshell
As said, the ‘DESI Dashboard for the Digital Decade’ aims to provide a reliable and multi-dimensional picture of the annual progress of MS and of the EU towards achieving the targets and sub-targets set forth by the Commission Decision (EU) 2022/2481 on the Digital Decade Policy Programme (the ‘DDPP Decision’).Footnote 13
More precisely, the DDPP Decision sets out four digital targets that the EU and the MS are expected to achieve by 2030: ‘(1) a digitally skilled population and highly skilled digital professionals, with the aim of achieving gender balance […]; (2) secure, resilient, performant and sustainable digital infrastructures […], (3) the digital transformation of businesses […], (4) the digitalisation of public services’.Footnote 14 For every target, the Decision identifies a small number of quantitative sub-targets (between two and four for each target). The targets and sub-targets are described as being functional not only to implement the EU’s agenda of empowering citizens and businesses through digital transformation,Footnote 15 but also to achieve a wide range of targets included in the UN’s 2030 Agenda for Sustainable Development. The DDPP explicitly refers to the UN targets on industrial development, research and innovation, the fight against climate change, sustainability challenges, fairness and equality for all, and the realisation of social rights, including the right to education.Footnote 16 Digitalisation is thus described by the DDPP as fundamental for both the creation and functioning of the single market and for the achievement of many other prosperity goals, following a trope that is now very common in techno-legal scholarship, within and beyond Europe.Footnote 17 Interestingly, the incorporation of the DESI Dashboard in the European Commission’s digitalisation strategy determined only minor changes in the Dashboard methodology.Footnote 18 The DESI Dashboard measurements are repeated every year, and the results are freely available on the EU’s website together with explanatory notes and detailed country reports.Footnote 19
Since the DESI Dashboard was launched, first as the e-Government Benchmark, then as DESI, and finally as the DESI Dashboard, its figures have provided a stimulus for national reforms towards automated government.Footnote 20 In the European literature on digitalisation, results in the DESI Dashboard are often used as a source of evidence of countries’ performance and achievements.Footnote 21 Most importantly, over the past few years, hundreds of papers based on the DESI Dashboard data have been published by European and non-European researchers.Footnote 22 These studies, mostly authored by economists and political scientists, have taken the DESI data as a reliable picture of the level of digitalisation in Europe, and then reworked such data in combination with other quantitative information. Some of these studies examine the overall economic and political prospects of particular countries in Europe and beyond,Footnote 23 while others look for correlations between national scores in the DESI and countries’ performance in other areas, so as to confirm theories about the enabling role of digitalisation in the pursuit of other goals, including development.Footnote 24 This is a common effect of quantitative measures: when numbers are out in the open and freely available, they provide a readily accessible form of knowledge that is vested with the legitimacy of (apparent) expertise and numbers. It is a form of knowledge that is particularly suited to informing people’s actions, fostering untested explanations and correlations, and providing a pseudo-scientific basis of legitimacy for a variety of other foreseen and unforeseen uses.Footnote 25 No one seems interested in examining what the DESI Dashboard really counts, and what policies it actually pursues. No one seems interested in checking how exactly the DESI Dashboard is contributing to fight climate change or promote equality. The main point of this Dialogue and Debate essay is that we should be asking ourselves such questions.
3. Opening up the DESI Dashboard I: the contents
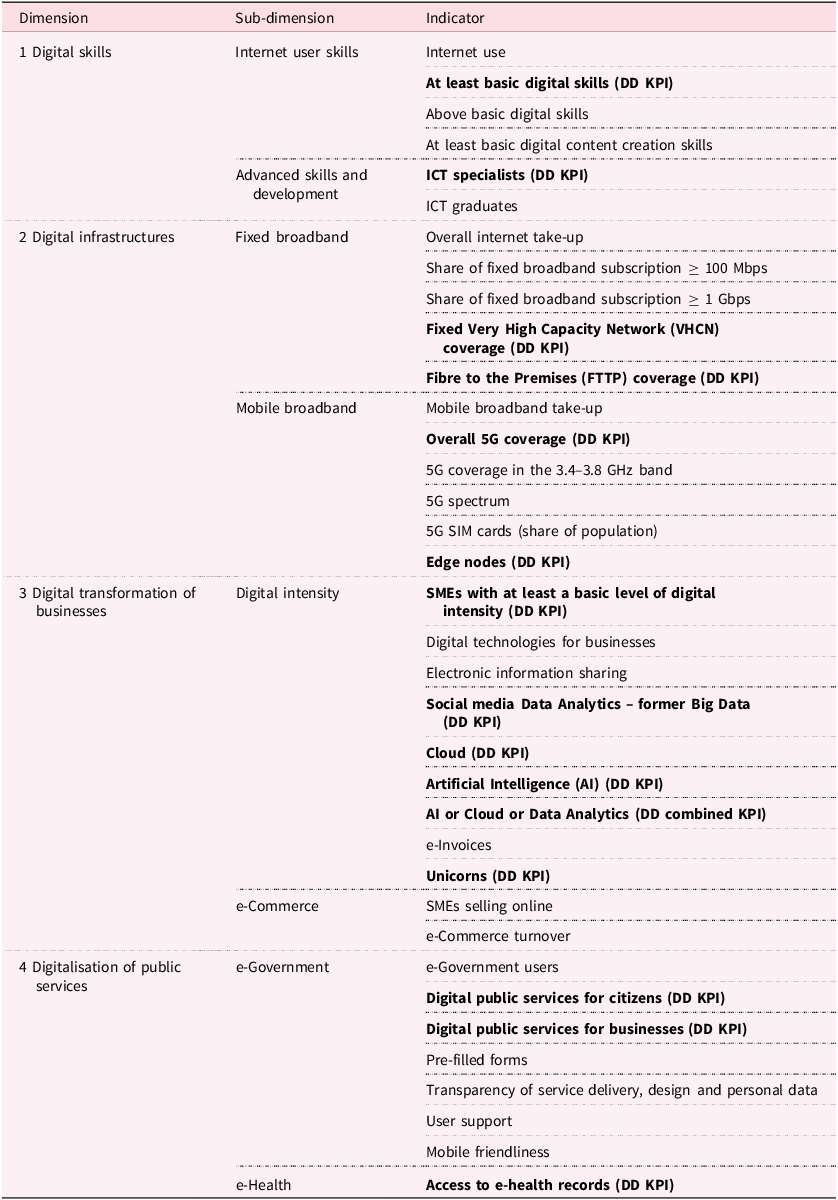
In its current form,Footnote 26 the DESI Dashboard claims to measure four dimensions – digital skills, infrastructures, transformation of businesses and digitalisation of public services – corresponding to the four digital targets identified by the DDPP Decision. Each dimension is divided into sub-dimensions; the sub-dimensions are investigated through specific indicators (from one to nine per sub-dimension), for a total of 36 indicators. These indicators roughly correspond to the sub-targets identified by the DDPP Decision.
As already mentioned, the European Commission is expected to rely on the DESI Dashboard ‘to monitor the progress of the Union towards the general objectives and the digital targets’.Footnote 27 To this purpose, the DDPP Decision empowers the Commission to set out, by an implementing act, indicators within the DESI which constitute Key Performance Indicators (KPIs) for each digital target. The Commission did this with the Implementing Decision (EU) 2023/1353,Footnote 28 which identified 15 KPIs within the 36 DESI indicators. Table 1 below summarises the dimensions, sub-dimensions and indicators in the DESI; the 15 indicators in bold are the current KPIs.
On the DESI Dashboard – data from the European Commission, DESI 2025 methodological note, Brussels, 16 June 2025, SWD(2025) 295 final, 3–10, at https://digital-strategy.ec.europa.eu/en/library/digital-decade-2025-desi-methodological-note

The questions asked under each indicator include the following: What is the percentage of the population with basic digital skills (under ‘internet user skills’)? How many ICT specialists are employed in the country (under ‘advanced skills and development’)? How many households have internet access at home (under ‘fixed broadband’)? What percentage of the populated area has coverage by at least one 5G mobile network (under ‘mobile broadband’)? What is the percentage of enterprises using AI technology and how many ‘unicorn’ digital platforms have their seat in the EU (under ‘digital intensity’)? What is the percentage of small-and-medium enterprises that sell their products and services online (under ‘e-commerce’)? What is the share of administrative steps for starting and carrying out a business that can be completed online (under ‘e-Government’)? To what extent do citizens have online access to their electronic health records data nationwide (under ‘e-Health’)?
These questions clearly emphasise certain aspects of digitalisation, in particular those related to the realisation of the digital single market. None of the variables address the achievement of sustainability goals. On the contrary, the DESI pushes for a world in which a significant proportion of the European population is increasingly connected and able to shop online (first and second dimensions), in which businesses are active online (third dimension), in which many ICT specialists are being trained (first dimension), and in which public administrations have completed the transition to e-government (fourth dimension). The speed with which the DESI calls for these priorities to be pursued is such that it inevitably discourages experimentation with local solutions based on trial and error. Rather, the DESI pushes European citizens, businesses and public administrations to maintain their dependence on the non-European digital service providers that currently dominate the digital ecosystem.Footnote 29 The agenda pursued by the DESI is therefore not simply pro-market: it favours a specific vision of the European market that focuses more on people’s ability to spend online than on building European digital autonomy and sovereignty. Moreover, while in principle the pursuit of sustainability is not necessarily antithetical to pro-market policies, none of the variables included in the DESI seem to be directly related to sustainability, no matter how the latter is understood.
This is of course a political choice; this essay does not aim to question the merits of this choice. Rather, the main point of this essay concerns the form in which such a policy choice is being made, and it can be summarised in a twofold observation.
Let us start with sustainability. The vision of digitalisation embodied in the Dashboard variables does not correspond to the sustainable-friendly agenda that the Dashboard officially promotes. On paper, the DESI Dashboard is supposed to measure digitalisation as functional to the achievement of several goals of the UN 2030 Agenda for Sustainable Development. But the Dashboard asks nothing about – let us say – the carbon footprint of the digital market, the number of digital awareness programmes in schools, the mental health of young users, the conditions of workers employed in the e-commerce sector, the equality and fairness of the automated administration. On the contrary, it rewards performance in areas that are arguably very bad for sustainability: for instance, it measures and therefore promotes connectivity for all and the endless growth of e-commerce without simultaneously having any consideration of their possible environmental costs.Footnote 30 From this point of view, the official sustainable vest of the DESI Dashboard works as a green-washing device for a market-oriented indicator designed to push pro-market digitalisation policies.
Second, even leaving aside the missing variables on sustainability, the vision of digitalisation embodied by the DESI Dashboard is only one of many possible pro-digital-market scenarios that may be envisaged. An alternative DESI Dashboard might for example focus on people’s (perceptions of) security online and on the share of the population that contributes to Wikipedia or uses open-source software. Other possible variables might cover the number and success of digital-related patents by European companies, the long-term value and financial stability of European unicorns, the share of the hardware and software market occupied by European companies abroad. Similarly, an indicator on digitalisation might well consider the resilience of digital infrastructure to cyber-attacks, the degree of technological dependence on non-European tech giants, the cost to public administrations of the transition to e-government, and so on and so forth. These variables would still be pro-market, although they would push for a different kind of digital market. Yet, all these possible alternative scenarios are silenced by the absence in the DESI Dashboard of any variable that might be important to measure these alternative worlds. Most importantly, the possibility of alternatives itself is obscured by the assertiveness with which the DESI Dashboard claims to measure progress in digitalisation, as if there is only one possible form of digitalisation, and only one way to progress towards it.
4. Opening up the DESI Dashboard II: the methodology
When dealing with a quantitative measurement, it is essential to look in detail not only at what the measurement is counting, but also at the way in which the measurement is carried out, ie, the methodology of counting. We, therefore, need to take a closer look at the methodology used to answer the questions posed by the DESI and collect data on national performance.Footnote 31
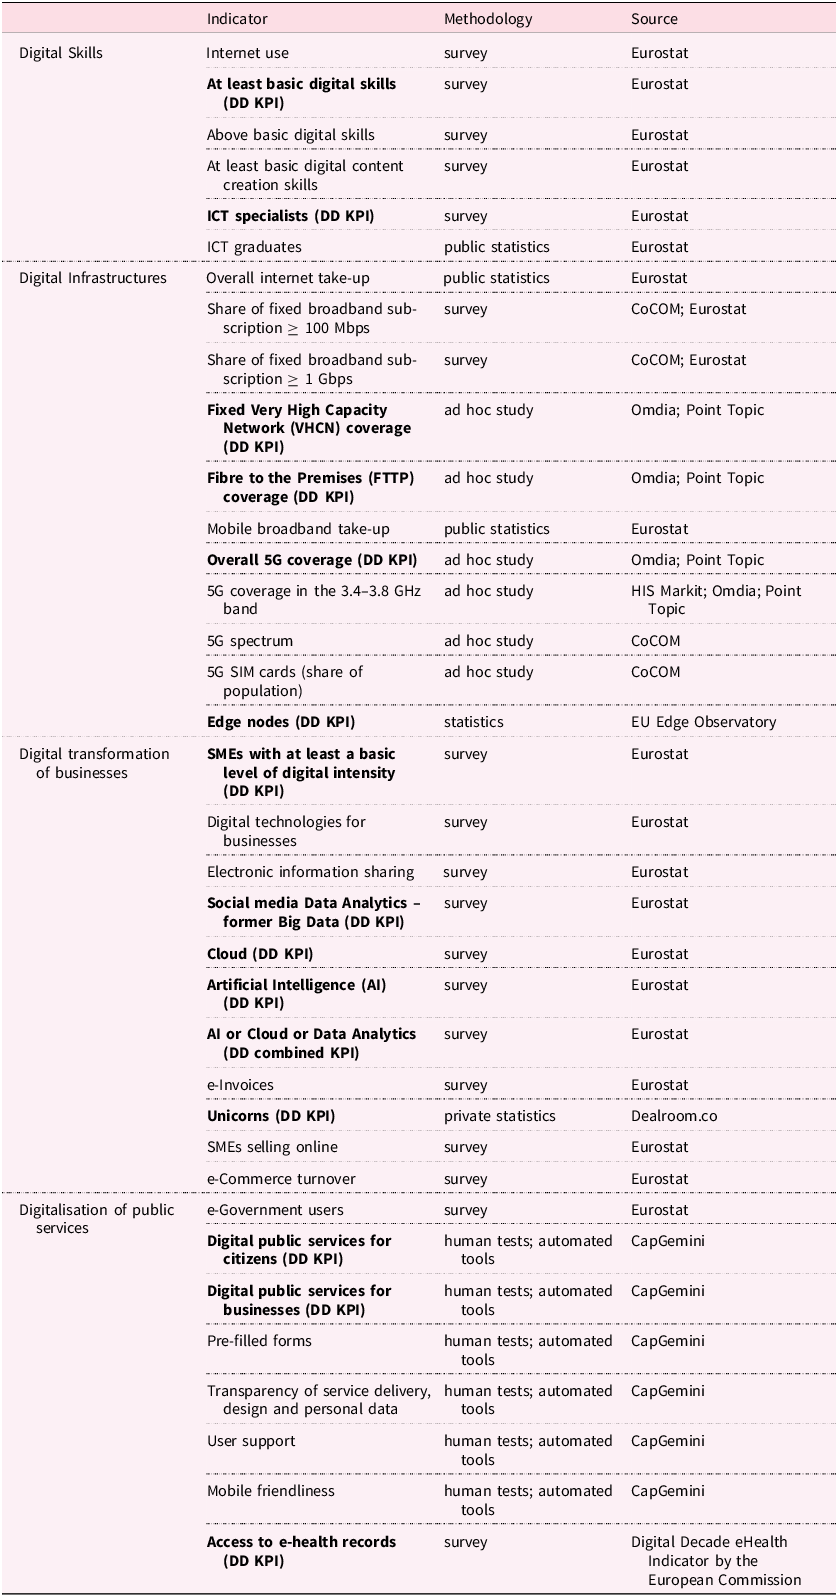
The DESI is prepared annually by the European Commission by combining data available from, or provided by, many different sources. The list of the methodology and source used for each indicator for the 2025 edition of the DESI is provided in Table 2 below.
On the DESI Dashboard – data from the European Commission, DESI 2025 methodological note, Brussels, 16 June 2025, SWD (2025) 295 final, 12–15, at https://digital-strategy.ec.europa.eu/en/library/digital-decade-2025-desi-methodological-note

As the table shows, data for the first and the third dimensions are almost exclusively derived from Eurostat surveys, that is, through harmonised surveys carried out in each MS by Eurostat’s partner institutes at the national level.Footnote 32
For the second dimension, much of the data is collected by the European Commission either through its Communications Committee (CoCOM) or by relying on the results of studies performed by external companies. CoCOM is established under Article 118 of the European Electronic Communications Code and is composed of representatives of the national regulatory authorities in the MS.Footnote 33 The data collected by the CoCOM are therefore national data provided by the MS, which means that the answers to these questions depend on the MS’s self-assessment. The external companies involved in the commissioned studies are private information service providers such as the UK-based OMDIAFootnote 34 and Point Topic,Footnote 35 the UK–American IHS Market,Footnote 36 and the Dutch data provider dealroom.co.Footnote 37 Incidentally, this shows how private actors increasingly participate in the collection, processing and presentation of data that enable public-driven technologies of governance to function.
This is also confirmed by the main source of data for the fourth dimension: the eGovernment Benchmark, published annually by the French company CapGemini, on behalf of the European Commission.Footnote 38 CapGemini relies on a dual methodology: on the one hand national real-life human testers, specifically trained for this purpose, try to access digital public services in each country and then report on their experiences; on the other hand, automated assessment tools check national websites and assess them on the basis of some criteria defined by the European Commission.Footnote 39 As shown in Table 2, one entry of the fourth dimension is built on the ‘Digital Decade eHealth Indicator Study’, which is a stand-alone indicator produced annually by the European Commission through an EU-wide survey.Footnote 40
All of the above means that the DESI Dashboard relies to a limited extent on countries’ self-assessment; the majority of sources for the indicators, especially for the KPIs, are Eurostat and third-party sources, mostly private companies specialised in information services. This makes the DESI a composite indicator, ie, an indicator the results of which are based on the aggregation of data extracted from other indicators and the reliability of which therefore depends on the reliability of its third-party providers. One can probably assume that the national partner institutions of Eurostat collect data according to rigorous and harmonised procedures for social surveys, even though this is by no means an absolute guarantee against misunderstandings, mishaps and mistakes.Footnote 41 It is much more difficult to verify the validity of data provided directly by national governments and private companies. Such a verification would require full access to all the information provided by governments and companies, as well as a thorough study of how each piece of information was collected in national languages and later converted into numbers. In addition, this inquiry would also require checking whether the data was consistently interpreted while being reworked, combined and repackaged into the DESI Dashboard.Footnote 42 All this is to say that no matter how good the effort, data collected by the DESI Dashboard can hardly be considered as reliable and objective. As with any measure of social phenomena, the methodological choices and passages underlying the construction of the measurement affect the results the measurement conveys.Footnote 43
A last note. Prima facie, it appears that the MS’ direct contribution to the making of the DESI is minimal. However, such a conclusion needs to be qualified. The DDPP Decision obliges countries to collect their own data on the objectives of the Digital DecadeFootnote 44; the data then feeds Eurostat’s surveys. The way in which MS perform data collection therefore directly determines the information that enters into the second dimension on infrastructures (through the Communications Committee), and in the first and third dimensions on digital skills and transformation of businesses (through Eurostat). This implies that there is plenty of room for MS to submit data that best suits their own narratives and results in the best possible reflection of the digital progress made by MS, thus reducing the descriptive value of the DESI.
5. What the DESI Dashboard really does
The above makes clear that the DESI Dashboard is not an objective measure of digitalisation.
The DESI Dashboard is not objective because measurements of social phenomena rarely are: all of the methodological choices required to construct them – the variables to be considered, the data to be included, the source for the data, the technical procedures to make the data comparable – affect the final result.Footnote 45 In the case of the DESI Dashboard, part of the indicator is fed with statistical data stemming from national Union-wide surveys, and part is based on self-assessments by states and assessments by third party experts. This is, of course, what usually happens with measurements produced by international organisations, whose function is often more to socialise states through measurement rather than to collect objective information on what is allegedly being measured.Footnote 46 No matter what it claims to do, the DESI Dashboard, does not provide an accurate description of the reality: its figures have travelled a long way from their collection to their inclusion in the DESI, undergoing multiple reinterpretations and repurposing that have likely changed their original meaning.
Methodology aside, the point remains that the DESI Dashboard is not an objective measure of digitalisation, and provides no measure of the contribution of digitalisation to sustainability. We have already noted that the DESI Dashboard clearly defends one particular pro-market vision of digitalisation: a vision that emphasises certain aspects of digitalisation while silencing all others.Footnote 47 The DESI Dashboard does not pay attention to issues that are not related to the fast creation of a single digital market as envisaged by the European Commission. The variables included in the DESI Dashboard shed light only on the kind of entrepreneurship favoured by the Commission: essentially, e-commerce and online access to public services. By contrast, the DESI Dashboard asks nothing about the strength of the European technological sector. It asks nothing about citizens’ digital engagement and awareness. Yet, because it is presented as an indicator of digitalisation (without further adjectives or qualifications), the users and readers of the DESI Dashboard are not made aware of all the aspects of digitalisation it does not consider. This is a common feature of social measurements: any quantitative assessment of the social world focuses on a few variables, that capture a fraction (often, the fraction that is easiest to count) of what is being measured, while attention is lost to any other variable. Far from being a purely technical matter, the choice of variables thus implies the choice of a specific agenda to be pursued, of the problems to be tackled and of the approaches to be favoured.
This is not all. The DESI Dashboard does not cover anything that may be directly related to sustainability. It does not ask questions about the eco-friendliness of digital strategies, the recycling of technological devices, the energy consumption of digital infrastructures, the labour conditions of those who work in the current platform and information economy. It does not investigate any variable which may point out at the many ways in which digitalisation may be tackling – or exacerbate – the climate crisis, resource depletion and social inequalities inside and outside Europe.Footnote 48
The end result is quite paradoxical. Under the DDPP Decision, the DESI Dashboard is officially based on the idea that digitalisation will not only strengthen the European economy, but will also help fight climate change, address sustainability challenges and promote equality for all.Footnote 49 The idea that digitalisation and more generally emerging technologies will solve all our problems, including those created by technologies, is a typical techno-salvation argument that is very powerful and increasingly fashionable,Footnote 50 but very difficult to prove – hence the many economic and political science studies mentioned in Section 2 that use the DESI Dashboard data to explore the link between digitalisation and sustainability. These studies suggest that such a link exists, and they further validate the premise on which the DESI Dashboard is built.Footnote 51
Yet, the truth is that DESI Dashboard provides no data on the impact of digitalisation on sustainability, nor it promotes the sustainability of consumption and production in the digital marketplace. The DESI Dashboard only provides numerical nudges for a Europe in which, thanks to a largely non-European digital infrastructure, everyone is connected and able to interact online with businesses and governments.Footnote 52
So, while the DESI Dashboard reassures us that we as Europeans are addressing sustainability challenges by embracing digitalisation, it also pushes for the pursuit of a political and economic agenda that has little (if anything) to do with sustainability, embeds a specific vision of the European digital market, and remains invisible to the casual observer. The numbers in the DESI Dashboard are presented as objective measures that would help us build our hopes, but in fact hide the extent to which DESI figures are entrenching our digital present and making it our digital future.
6. Nothing new under the sun
What the DESI Dashboard is doing is nothing exceptional. We have already noted that, in the ‘new governance’ perspective, the Dashboard can be understood as one of the operational strategies adopted by the EU, and in particular by the European Commission, where the competences, powers and consensus for ‘hard’ interventions are lacking in order to achieve effects that are similar, if not more incisive, than those achieved through positive law.Footnote 53 Quantitative indicators identify quantifiable objectives and monitor progress through measurement or self-measurement. The repetition of these measurement exercises facilitate the spread of standards and practices through horizontal coordination, self-regulation and self-governance rather than through the use of vertical commands. Not surprisingly, in the 21st century, EU institutions have increasingly relied on quantitative measures to monitor companies and states, to build their expertise in new areas, and to softly claim competence in new sectors.Footnote 54
There is nothing new in the fact that, in the absence of a clear competence in the digital domain, the European Commission has relied on a quantitative measure of digitalisation to support its strategy for the creation of a single digital market, to legitimise and justify its own intervention, and to align MS preferences around a pro-market, neo-liberal agenda, making them accountable for any failure to participate in the game. By mapping and counting social data, the DESI Dashboard builds up the expertise of the Commission in the market for data and transforms complex information into simplified and commensurable quantities, whose aura of scientificity easily replaces other forms of judgment on social realities.Footnote 55 At the same time, as an evidence-based, mechanistic and technical tool, the DESI Dashboard has the capacity to obscure policy choices, to align MS’ preferences around a common goal, and to promote change not by command or political consensus, but by demanding and offering performance data.Footnote 56 This ability is commonly exploited by international organisations, which often use quantitative measurements to invisibly exercise power on Member States and to shift on the latter the responsibility for (measuring) the realisation of their own agendas. Thanks to the repetition of measurements over time and their media exposure, the measured states are then pressured to reorient their agendas and to conform to the standards embedded in the measurements or to adopt rank-seeking and gaming strategies, ie, techniques for manipulating data and improving results in ways that are unrelated to the motivation underlying the quantitative exercise.Footnote 57 The feedback and reflexive cycles generated by the repetition of measurements can, of course, extend well beyond the biunivocal relationship between those who measure and those who are measured, to include any third party who uses and relies on the quantitative measurements.Footnote 58 In the case of the DESI Dashboard, we have seen, for example, that the Dashboard is relied on by many academic studies. These studies take the validity of the DESI Dashboard for granted, and further entrench the role of the Dashboard in the market of ideas, crystallising its vision as the vision about digitalisation.
The ‘managerial turn’Footnote 59 is not an EU specificity. It is taking place virtually everywhere. At least in the so-called Global North, objectified and standardised methods of quantification are nowadays one of the preferred means to manage the complexity of contemporary globalised societies.Footnote 60 Yet, while the managerial turn may be largely inevitable, its implications remain open to critique. As engaged academics in Europe, we need to question the images and the scenarios that numbers seem to offer us. We need to delve into the language of indicators, targets and dimensions to see which issues are promoted and which others are discarded. We need to lift the veil on the ways in which catchy ideals and objectives – such as digitalisation and sustainability – are obscurely instrumentalised by institutions to pursue an agenda of their own. We need to recover the substance beneath the form, to examine what is being done, to understand what substantive choices are being made, to watch carefully for the alternatives we are (invisibly but inevitably) leaving behind.Footnote 61
Competing interests
None.

 Open access