The British North American colonies were the first Western economies to emit sizable amounts of paper money—called bills of credit. Colonial legislatures had bills printed and placed in their treasuries. They directly spent this money on soldiers' pay, military provisions, salaries, and so on. They also loaned it on interest to their subjects, who secured these loans by pledging their lands as collateral. These colony-specific, legislature-issued paper monies formed an important part of the circulating medium of exchange in many colonies (Brock Reference Brock1975).
Colonial New Jersey's paper money regime has not been modeled nor its performance statistically analyzed before. Here, I apply my decomposition model of inside monies to colonial New Jersey's paper money regime. This model represents a new approach to conceptualizing and to measuring how colonial paper monies performed. This application to New Jersey is my pilot project, namely my first application of this model to a particular colony's paper money.
THE VALUE DECOMPOSITION OF COLONIAL PAPER MONEY
The observed market exchange value (MEV) of colonial paper money is decomposed into its component parts, see equation (1). MEV equals its expected real asset present value (APV – RD), namely its value as just another non-money barter asset, plus its transaction premium (TP) that measures its pure “moneyness” value, namely its extra value as a transacting medium of exchange. Positive values for TP measure the willingness of the public to pay a premium above the bills' expected real asset present value, because the bills serve as a more convenient transacting medium than the next best alternative. The expected real asset present value is further separated into its pure time-discounting component (APV), and its default risk component (RD). All components in equation (1) are calculated as a percentage of face value in order to be in a comparable metric.
For a pure fiat currency, by definition, MEV ≈ TP and its (APV – RD) ≈ 0. For a pure commodity or asset money, produced in an open-access competitive market, arbitrage yields MEV ≈ (APV – RD), leaving its TP ≈ 0 in long-run equilibrium. Somewhere between these pure cases resides the local paper monies used by colonial societies. If the long-run development of a society involves the transition from commodity to fiat money, measuring where that society's money is on that evolutionary spectrum informs us about that society's development and the state of its monetary institutions (Redish Reference Redish1993). The decomposition in equation (1) can be used to disentangle the extent that colonial paper money functioned as a commodity or asset medium of exchange ((APV – RD) / MEV) versus as a fiat currency (TP / MEV).
Empirical measurement is the difficult part of applying this approach. While I can measure MEV using data on exchange rates, RD and TP cannot be independently measured. In addition, measuring APV entails constructing a counterfactual value, namely a bill's value when not used as a money and when no risk of default is expected. Given that it is being used as money and may have had some default risk, constructing this counterfactual and disentangling it from MEV requires attention.
Fortunately, colonial bills of credit were structured as zero-coupon bonds (Grubb Reference Grubb2016, pp. 164–83; Hutchinson and Rachal Reference Hutchinson and Rachal1962 vol. 1, pp. 306–06; Labaree Reference Labaree1967 vol. 11, pp. 13–15; Smith Reference Smith1937, pp. 310–12). They had legally defined maturity dates when they were paid off at face value in specie equivalents by the issuing government. No interest was paid in the interim between emission and redemption. Given expected maturity dates, payoff values, and an appropriate time-discount rate, the APV of these bills as risk-free non-money tradable bonds can be calculated independent of their MEV.
Moving the variables that can be independently measured to the left-hand side and the variables that cannot be independently measured to the right-hand side yields equation (2). In terms of proportions, the ratio (APV t / MEV t) shows how much of MEV t is accounted for by APV t with the residual share being accounted for by (TP – RD)t. The gap between MEV t and APV t, measures the magnitude of (TP – RD)t.
The possibility that TP t > 0 and RD t > 0 by sizable magnitudes simultaneously is unlikely. An asset with a high default risk is unlikely to have an excess transaction premium, namely be the preferred medium of exchange relative to assets with lower default risks. While it is mathematically possible for (TP – RD) to equal 1 percent of MEV because TP = 1 percent and RD = 0 percent, or because TP = 100 percent and RD = 99 percent, the later possibility is absurd in practice. Behaviorally, TP is likely a negative function of RD. As RD takes on positive values, TP is quickly driven to zero. The transaction premium is not about convenience per se, but about how much people are willing to pay for that convenience over and above the convenience value of the next best alternative medium of exchange. It is an opportunity cost measure. Thus, when (TP – RD)t > 0, it is primarily due to TP t > 0; and when (TP – RD)t < 0, it is primarily due to RD t > 0. The exercise here is to see how far this approach gets us in terms of reframing our understanding of the value and performance of colonial paper money.
DATA ON MEV AND APV
To apply equation (2), two data sets are required. I must compile the market exchange value (MEV) of a colony's bills of credit, and I must calculate the counterfactual expected time-discounted asset value (APV) of a colony's bills of credit as risk-free non-money bonds. I chose New Jersey as the colony of application for several reasons. First, I constructed the required data on paper money emissions and yearly redemptions needed to calculate APV for New Jersey's entire history of emitting paper money, see Figure 1 (Grubb Reference Grubb2015, pp. 15–16, 24). Second, New Jersey has the longest continuous paper money time series for a North American colony operating under the same legal tender regime. Third, knowing the face-value specie equivalence of a bill at redemption is required to construct MEV and APV. New Jersey printed this information on the face of each bill (Grubb Reference Grubb2015, p. 18; Newman Reference Newman2008, pp. 249–58).
NEW JERSEY PAPER MONEY, 1709–1775

The Observed Average Yearly Market Exchange Value (MEV)
I use the observed market exchange rates between New Jersey bills of credit and bills of exchange paying pounds sterling in London to construct MEV. These exchange rates are from merchant account books and statements by government officials. I started with the work of John J. McCusker (Reference McCusker1978, pp. 172–73) and consulted all the original sources listed therein. I corrected the errors (typos) in the McCusker data for the years 1739, 1741, and 1762 based on what was found in these original sources. I also added a few exchange rates found in other primary sources not originally included in the McCusker data. The data are expressed as the face value amount of New Jersey bills of credit needed to buy, in New Jersey, a one pound sterling bill of exchange drawn on London, see Table 1.
EXPECTED APV, AVERAGE EXCHANGE RATES, AND IMPUTED R*, 1709–1775

Sources:
Documents Relating to the Colonial History of the State of New Jersey (1881–1905 vol. 3, p. 21; vol. 4, p. 241; vol. 5, pp. 153–55, 190, 193, 287, 417; vol. 6, pp. 62, 68, 82–83, 132–35; vol. 7, pp. 246, 393, 398–99; vol. 10, pp. 50–51; vol. 12, pp. 19, 31, 64); Grubb (Reference Grubb2015, pp. 15–16, 24); Kemmerer (Reference Kemmerer1956, pp. 111–12, 118–19, 121, 123); Sherwood (Reference Sherwood1851, p. 147); McCusker (Reference McCusker1978, pp. 172–74); Morris (Reference Morris1852, pp. 49, 103–04, 133, 157); Tanner (Reference Tanner1908, p. 556).
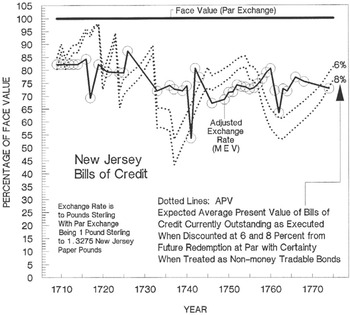
I adjusted these exchange rates to account for the cost of getting a bill of exchange to London and getting it liquidated into specie usable in New Jersey. I estimated that cost to be 7.09 percent—derived from New Jersey exchange rates quoted in 1703/1704 before bills of credit were issued (McCusker Reference McCusker1978, p. 172; see also Bush Reference Bush1982, pp. 10–13, 315–16). As such, the realized par exchange rate of a New Jersey bill of credit is 1.2334£NJ = 1£S compared with the legal par exchange rate of 1.3275£NJ = 1£S—derived from the face of the bill (£NJ = New Jersey pounds; £S = pounds sterling). MEV is calculated by dividing this adjusted number (1.2334) by the observed exchange rates in Table 1. Compared with using the legal par exchange rate, using the realized par rate as the numerator makes MEV a smaller percentage of face value. MEV measures the spot-market conversion in New Jersey of New Jersey paper pounds into an outside silver commodity money expressed as a percentage of the face value of New Jersey pounds. The MEV data are displayed in Figure 2.
MEV AND APV FOR NEW JERSEY BILLS OF CREDIT, 1709–1774

A Bill's Expected Yearly Risk-Free Asset Present Value (APV)
New Jersey's paper money had a bearer-bond quality that required an explicit redemption exercise to extinguish the principal expressed on the face of the bills. These redemption rules were embedded in each paper money act or in an ancillary revenue act passed by the New Jersey legislature. For a given emission of bills, redemption was legislated to take place over a window of years. A multi-year redemption system was used to keep the amount of annual redemption payments within historically feasible limits, thus giving the redemption exercise fiscal credibility. New Jersey, however, legislated no mechanisms to determine which bills would be redeemed in which years within the redemption window legislatively designated for those bills (Grubb Reference Grubb2015).
New Jersey subjects are assumed to act as if they understood their paper money to be zero-coupon bonds requiring time-discounting to ascertain their present value, and to know how to calculate this present value (Labaree Reference Labaree1967 vol. 11, pp. 13–15; Ricord Reference Ricord1892 vol. 17, p. 159; Smith Reference Smith1937, pp. 310–12). The public is assumed to know the quantity of New Jersey bills in circulation each year (M i) and the amounts redeemed (RED i) each year as shown in Farley Grubb (Reference Grubb2015, pp. 15–16, 24). The public is also assumed not to know in which year a given bill currently outstanding would be redeemed within its legislatively designated redemption window. Thus, the public responded only to the expected redemption of a bill currently outstanding.
The amount of New Jersey paper money outstanding in a given year is assumed to be redeemed by all bills actually redeemed in the immediately following years until the year when that original amount is fully redeemed. These yearly redemption amounts are divided by the initial amount outstanding from the chosen year to assign a yearly weight to its contribution in the redemption process. The time discounts between the initial year and the redemption year are multiplied by the contribution-weights for their respective years. The time-discount-weight values for each year are summed to get the expected risk-free present value of a representative bill outstanding for that chosen year.
This redemption structure is justified by New Jersey law that made its paper money a legal tender throughout its history of emissions. Legal tender status made bills from different emissions that were concurrently outstanding fungible across the separately legislated redemption windows for each emission. New Jersey law, however, limited how long each emission would be accepted for redemption (Bush Reference Bush1977, pp. 311, 432, 480–81; 1980, pp. 350, 376, 419, 551, 574, 633, 676). The bills from each emission were dated (Newman Reference Newman2008, pp. 249–58). Thus, subjects had an incentive to redeem the oldest bills in their possession first.
Mathematically, APV i = ∑t = i T (RED t/M i)e -rt, where r is the risk-free interest rate or opportunity cost of capital, M i = the face value amount of New Jersey bills outstanding in year i, RED t = the face value amount of New Jersey bills redeemed and retired from circulation each year, with REDT being the amount in the last year of redemption that satisfies ∑t= i T (RED t/M i) = 1. No time-series of market-generated interest rates for any class of assets currently exists for colonial America. Therefore, I use the r considered normal by colonials for assets with relatively low default expectations. This rate is used as a proxy for what in modern analysis is designated as the risk-free rate. Given some uncertainty over this rate, an r between 6 and 8 percent is used. Prior to 1730, a rate as high as 10 percent could be considered within this norm (Bush Reference Bush1977, pp. 241–43, 266–67, 502–04; 1986, pp. 235–37; Documents Relating to the Colonial History of the State of New Jersey vol. 5, p. 91; Grubb Reference Grubb2016, pp. 163–64). Table 1 and Figure 2 present APV calculations using 6 and 8 percent interest rates.
APV i is not mechanically linked to M i. For any given M i, APV i can take on any value between 0 and 100 percent, because the legislature has unrestricted choice over T and RED t. Given r, APV i is under the control of the legislature through its legal design and execution of its paper money laws.
A Bill's Expected Yearly Risk-Adjusted Asset Present Value (APV – RD)
I employ an alternative method to get at the same issue. If TP = 0, then MEV measures the current spot market value of these bills as non-money bonds. Given the expected redemption structure of the bills, the interest rate (r*) that makes MEV = (APV – RD) is calculated, namely select r* such that MEV i = ∑t = i T (RED t/M i)e – r* t. If in fact TP = 0, then r* represents the first time-series of market-generated interest rates for any asset class in colonial America. Table 1 and Figure 3 report r* for the years with data on MEV.
IMPUTED r*, 1709–1774

If r* is within the normal range of risk-free interest rates, then the proposition that the bills are simply non-money barter assets with no special “moneyness” value or fiat currency attributes cannot be rejected. If r* is above this range, then nothing changes from the above conclusion except that now RD > 0, namely the bills are risky non-money bonds. If r* is below this range, then the proposition that RD ≈ 0 and TP > 0, namely that the bills have some “moneyness” value, cannot be rejected. The magnitude, by which r* is outside the normal range of risk-free interest rates, measures the extent that RD > 0 when r* is above that range, and the extent that TP > 0 when r* is below that range.
COMPOSITIONAL ANALYSIS OF MEV
Figure 2 compares the levels over time of MEV and APV, when APV is discounted at 6 and 8 percent. From 1709 through 1774, it shows that MEV and APV are strikingly similar. Using the 8 percent discount rate, MEV and APV start at the same value in 1710 and end at the same value in 1774. From 1709 through 1774, using only the years with existent exchange rates and the 8 percent discount rate, APV accounts for 95 percent, leaving (TP – RD) to account for only 5 percent, of MEV. Using a 6 percent discount rate, APV ≈ MEV and (TP – RD) ≈ 0.
In some years APV > MEV, implying that (TP – RD) < 0. Given that TP cannot be negative, RD > 0 in the years 1710 through 1719, 1741, and 1746 through 1756. For 1710 through 1719, a positive RD is consistent with these bills being an innovation and with New Jersey experiencing difficulty redeeming them as promised. In 1711, the New Jersey assembly admitted that “…several Mistakes have been committed, by which the Currency of the said Bills hath hitherto been very much Obstructed” (Bush Reference Bush1977, p. 97). In 1714, the assembly noted that “…there are considerable Sums of money remaining due and unpaid…,” and that “…Taxes,…not being fully paid, the said Bills cannot be sunk according to the true intent and meaning of the said Act” (Bush Reference Bush1977, pp. 125, 129). In 1719, the legislature moved to enforce tax payments. The bills were eventually redeemed in 1724 (Grubb Reference Grubb2015; Kemmerer Reference Kemmerer1940, pp. 107–13).
War panic is associated with a brief collapse in MEV in 1741. Two events explain the positive RD in the years 1746 through 1756. First, in 1746 the New Jersey assembly emitted 10,000£NJ in new bills to support King George's War (Grubb Reference Grubb2015). They made no explicit provisions to redeem these bills, hoping the British Crown would reimburse the colony post-war. This hope went unfulfilled (Bush 1980, pp. 109–11). Explicit provisions to redeem these bills were not enacted until 1753. That year, the assembly noted,
[the] Bills of Credit, issued by Virtue of several Acts of General Assembly for aiding His Majesty in the late War, against the Powers of France and Spain; and the Funds at first design'd by the Legislature for sinking the said Bills have failed; by Reason whereof not only the Public Credit in general, but also the Possessors of those Bills in particular may greatly suffer unless Provisions be made for sinking the same in a convenient Time some other way. (Bush 1980, pp. 21–28, 219–33, italics in the original)
The delay between emission and enactment of redemption structures increased the RD of the bills emitted in 1746, a situation which lasted through 1753.
Second, in 1749 the Crown disallowed a 40,000£NJ paper money act passed by the New Jersey assembly in 1748. This was the first overt disallowance of a paper money act passed by the New Jersey assembly. New Jersey did not succeed in emitting new paper money until 1755 (Grubb Reference Grubb2015; Kemmerer Reference Kemmerer1940, pp. 211–21). Uncertainty over the monetary powers of the New Jersey assembly produced a positive RD in the years between 1749 and 1755.
Dropping the years when (TP – RD) < 0, APV accounts for 92 and 86 percent of MEV, and TP accounts for 8 and 14 percent of MEV, when discounted at 6 and 8 percent, respectively. TP peaks from 1724 to 1740 and from 1758 to 1768. In both periods, TP averages about 9 and 17 percent of MEV when APV is discounted at 6 and 8 percent, respectively.
In addition to having similar overall levels in terms of percentage of face value, Table 2 shows that MEV and APV are co-integrated and that ΔMEV tracks ΔAPV through time. A strong statistically significant positive association between MEV and APV exists.
MEV'S STATISTICAL RELATIONSHIP TO APV, 1709–1774

*** Statistical significance above the 0.01 level.
** Statistical significance above the 0.05 level.
* Statistical significance above the 0.1 level.
Notes:
Data are annual. Standard errors are in parentheses under their respective coefficients. z t = regression error term. Dickey-Fuller critical values are used for the (t–1) independent variables, see Enders (Reference Enders1995, p. 419). Serial correlation was corrected by including one lag of the dependent variable (coefficients not reported). These corrected regressions were tested with Durbin's Alternative Test for autocorrelation which failed to reject the hypothesis of no serial correlation above the 0.1 level. For the co-integration tests, Durbin's Alternative Test for autocorrelation failed to reject the hypothesis of no serial correlation above the 0.1 level.
Sources:
Figure 2; Table 1; Grubb (Reference Grubb2015). Linear interpolations between years with missing values for MEV are used. APV8t = APV t when discounted at 8 percent; APV6t = APV t when discounted at 6 percent.
Figure 3 shows the same result from an alternative angle. It displays r* from 1709 through 1774 along with the range of normal interest rates. In 54 percent of the years with r* data, r* is within or above the normal range of interest rates. For a majority of the period covered, therefore, the proposition that New Jersey bills were simply barter assets with no “moneyness” value or fiat currency attributes cannot be rejected. For a few years, namely 1710 through 1719, 1741, and 1746 through 1756, New Jersey bills experienced a positive RD as indicated by r* being above the normal range of interest rates. From 1716 through 1719, this RD was substantial. In the other years, RD was only 4 or 5 percentage points.
In 46 percent of the years with r* data, 1724 through 1743 and 1758 through 1768, r* is below the normal range of interest rates. Therefore, the proposition that RD ≈ 0 and TP > 0, namely that New Jersey bills had some “moneyness” value, cannot be rejected in these years. These below-normal r* rates do not represent the normal market rate being driven down by the emission of paper money. In the first period, paper money was emitted through a land bank where the money was borrowed at 5 percent interest (Grubb 2015). It would be irrational for subjects to borrow paper money at 5 percent when the market rate was below 5 percent. The second period was during the last years of the Seven Years War and its aftermath. No contemporary writer or any other evidence indicates that normal interest rates were as low as r* in these years. Therefore, the below-normal r* rates represent something other than a low opportunity cost of capital driven by the emission of paper money. In other words, the proposition that TP > 0 cannot be rejected in these years.
The results in this section show that colonial New Jersey paper money was not a fiat currency. It was overwhelmingly a real barter asset. Figure 2 shows no overall depreciation of New Jersey paper money, depreciation here meaning a loss of asset principal as measured in present value terms. The fact that New Jersey paper money traded below face value does not mean that it had depreciated or that inflation had eroded its value. The difference between the bills' face value and their MEV was overwhelmingly due to time-discounting and not depreciation. The existence of a positive TP on average between 1709 and 1774 indicates that the bills actually traded at an appreciated value. Scholars have habitually confused time-discounting with depreciation. In years of monetary troubles, namely worries over redemption, TP eroded toward zero and RD became positive. But in normal years, TP accounted for 8 to 17 percent of the bills' market exchange value, enough to make the bills the preferred medium of exchange.
PERFORMANCE DETERMINANTS
Table 3 evaluates the performance of colonial New Jersey's paper money by estimating how the quantity of bills in circulation and their emission-redemption structure affected the bills' (TP – RD). (TP – RD)t is measured by (MEV – APV)t, see equation (2). Because (TP – RD) cannot be decomposed empirically, careful interpretation of the independent variables is needed to assess ΔTP versus ΔRD. The regressions explain 65 to 68 percent of the variance in (TP – RD). The negative trend is consistent with increasing British interference with New Jersey's power to emit paper money late in the colonial era eroding the TP of New Jersey paper money (Grubb Reference Grubb2015, Kemmerer Reference Kemmerer1940).
DETERMINANTS OF THE TRANSACTION PREMIUM, 1709–1774

*** Statistically significant above the 0.01 level.
** Statistically significant above the 0.05 level.
* Statistically significant above the 0.1 level.
+++ Statistically significant above the 0.11 level.
++ Statistically significant above the 0.13 level.
Notes:
See the notes to Table 2. (TP8t – RD t) = (MEV t – APV8t), and (TP6t – RD t) = (MEV t – APV6t). Land Bank Emissions are coded as one for the years 1724 through 1753 and zero otherwise. Both (TP – RD) regressions were corrected for serial correlation by adding three lags of the dependent variable to the specification (coefficients not reported). These corrected regressions were tested with Durbin's Alternative Test for autocorrelation which failed to reject the hypothesis of no serial correlation above the 0.1 level. (TP t – RD t) is a stationary series, see Grubb (Reference Grubb2014).
Sources:
Figure 2; Table 1; Carter, et al. (Reference Carter, Sigmund Gartner and Haines2006 vol. 5, p. 652) for New Jersey's white population with linear interpolated values used between decadal benchmarks; Grubb (Reference Grubb2014, Reference Grubb2015).
Two variables have a positive statistically significant impact on (TP – RD), namely per capita paper money in circulation and the method of injecting paper money into the economy. Under the land bank method, subjects borrowed newly printed paper money from the colony's treasury on interest and then paid back (redeemed) their loans on a fixed schedule (Grubb Reference Grubb2015). Under the direct spending method, future taxes were scheduled to redeem the spent bills. Bills redeemed under either method were removed from circulation and destroyed. The land bank method predominated from 1724 to 1753. Borrowings were constrained. No subject could borrow more than a fraction of the assessed value of his land holdings. A cap of 100£NJ was placed on loans to any single person, and bills to be loaned were distributed among the counties on fixed-quota allotments (Bush Reference Bush1977, pp. 301–19, 427–38, 474–87).
Because land-bank emissions were broadly spread among the populace, the paper money experienced familiarity and universality of usage as a medium of exchange. These features added value to New Jersey's bills above their real asset present value as just non-money tradable bonds. The land pledged to back these borrowings, and the aggressiveness of the colonial administration in enforcing repayment of loans and foreclosing on the property of delinquent borrowers, reduced the RD associated with New Jersey paper money compared with the alternative injection method. The positive association of land-bank emissions with (TP – RD) could have been through both a relative increase in TP and a relative decrease in RD between the 1724–1753 land-bank years and the pre-1724 and post-1753 tax-redemption years.
The non-land-bank injection method entailed the legislature directly spending paper money on soldiers' pay and government salaries, and then redeeming the bills through future taxes. The public may have considered the APV of bills backed by the promise of future tax collection to require a relatively higher RD than bills backed by land pledges, for example see the RD > 0 in the years 1710 through 1719 and 1753 through 1756 in Figure 2. Such injections were also more narrowly based and less likely to penetrate as quickly or as far into local trading networks. Lacking universal familiarity as a medium of exchange, New Jersey's bills gained relatively less TP under the direct-spending injection method even in years when RD ≈ 0.
The two paper money emissions disallowed by the Crown, 40,000£NJ in 1748 and 100,000£NJ in 1769 (and again in 1774), were both land-bank emissions (Bush Reference Bush1982, pp. 523–47; 1986, pp. 441–56; Grubb Reference Grubb2015). The New Jersey assembly wanted to continue the land bank emission method after its last land bank was finished in 1753, in part, because this method enhanced the TP and reduced the RD associated with its bills of credit.
The most interesting variable in Table 3 is the positive and statistically significant effect of the per capita amounts of paper money in circulation on (TP – RD). Placing more paper money in circulation, regardless of the method of injection, increased the strain on executing redemptions as promised. As such, RD should not fall, and so increases in TP must account for this positive association. More paper money in circulation per capita increased its ubiquity and familiarity of usage, which in turn led the public to increasingly treat this money as fiat currency. This process was accomplished by the public not time-discounting these bills when used in trade as much as would be required if they were just non-money barter bonds.
CONCLUSIONS
I decompose the market value of colonial New Jersey's paper money into its real asset present value and its transaction premium or “moneyness” value. This approach provides a consistent, coherent, and statistically successful method for measuring the value and performance of colonial paper monies. Colonial New Jersey's paper money was not predominantly a fiat currency. Its real asset present value accounted for more than 80 percent, whereas its value as money per se accounted for under 20 percent, of its market value. On average, the paper money did not depreciate, namely fall below its real asset present value. The transaction premium was positively associated with the quantity of paper money issued. This association absorbed the pressure, given an under-monetized economy, to reduce the market value of paper money caused by increases in the quantity of paper money. Finally, the model identifies periods when non-redemption became a concern, and measures the size of the risk discounts generated by those concerns. My decomposition model of inside money, and its application here to colonial New Jersey, provides a template for reevaluating the paper money regimes of other colonies.