


1. Introduction
In nature and in industrial systems, the flow-induced vibrations (FIV) of bluff bodies are frequently encountered in physical configurations that involve a structural restoring force (SRF) and thus a structural natural frequency (Païdoussis, Price & de Langre Reference Païdoussis, Price and de Langre2010). This is in particular the case of vortex-induced vibrations (VIV), a form of FIV which develops through synchronization between body motion and flow unsteadiness. As a result, in the canonical problem employed to study VIV, i.e. a circular cylinder free to translate along a rectilinear path in the direction normal to the current, the body is usually mounted on an elastic support (Williamson & Govardhan Reference Williamson and Govardhan2004). Yet, VIV still occur when the elastic support and associated SRF are removed, including at Reynolds number ( $Re$, based on the body diameter and inflow velocity) values lower than the critical threshold of $47$ that marks the onset of flow unsteadiness for a fixed cylinder (Shiels, Leonard & Roshko Reference Shiels, Leonard and Roshko2001; Govardhan & Williamson Reference Govardhan and Williamson2002; Ryan, Thompson & Hourigan Reference Ryan, Thompson and Hourigan2005; Navrose & Mittal Reference Navrose and Mittal2017; Bourguet Reference Bourguet2023a).
The vibrations appearing in the above canonical problem without SRF deviate from those typically reported with SRF: their onset is delayed from  $Re\approx 20$ to $Re\approx 30$, and they only exhibit substantial magnitudes over a narrow range of low values of the structure to displaced fluid mass ratio, with lower peak amplitudes. The deviation between the responses with and without SRF can be analysed under a harmonic oscillation assumption, which is often acceptable in this context (Govardhan & Williamson Reference Govardhan and Williamson2002). This analysis shows that the responses accessible without SRF correspond to the subset of those occurring with SRF where the effective added mass due to fluid forcing is negative. Along a rectilinear path, this subset does not include the peak amplitude responses observed with SRF, which are characterized by positive added mass values (e.g. Hover, Techet & Triantafyllou Reference Hover, Techet and Triantafyllou1998), and it may even vanish, depending on $Re$.
$Re$.
The present work was motivated by two recent studies concerning a cylinder immersed in a current and free to translate along a circular arc, with and without SRF (Bourguet Reference Bourguet2023a,Reference Bourguetb). Path curvature induces a global enhancement of the responses developing without SRF. Among other aspects, it causes a reduction of the critical value of  $Re$ for the onset of vibrations/flow unsteadiness, and an amplification of the responses, which tend to be comparable to those observed with SRF. The increasing trend of the response frequency with path curvature magnitude, identified with SRF, suggests a reduction of the effective added mass, which may become negative for most of the vibrations of substantial amplitudes. These responses could thus be reached without SRF. The possible convergence of the behaviours of the systems with and without SRF, under the effect of path curvature, is the object of this work. In order to explore this convergence, the systems with and without SRF are considered over a range of circular path radii, including the limiting case where the radius tends to infinity, i.e. the rectilinear path configuration. The investigation is based on numerical simulations at $Re=25$, a subcritical value for which rectilinear vibrations arise with SRF (Cossu & Morino Reference Cossu and Morino2000; Kou et al. Reference Kou, Zhang, Liu and Li2017; Dolci & Carmo Reference Dolci and Carmo2019) but not without SRF (Bourguet Reference Bourguet2023a), and $Re=100$, the postcritical value selected in the above-mentioned prior studies on this topic.
2. Physical configuration and numerical method
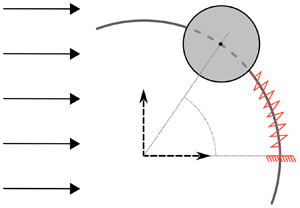
A sketch of the physical configuration is presented in figure 1(a). The circular cylinder of diameter  $D$ and mass per unit length $M_c$ is parallel to the $z$ axis and placed in an incompressible uniform current of velocity $U$, density $\rho _f$, viscosity $\mu$, aligned with the $x$ axis. The Reynolds number, $Re=\rho _f U D/\mu$, is kept below or equal to $100$. The flow is two-dimensional across the parameter space investigated. This point has been verified via three-dimensional simulations. The two-dimensional Navier–Stokes equations are employed to predict the flow dynamics. The cylinder is free to translate along a circular path of radius $R$, parallel to the $(x,y)$ plane and centred at the origin of the $(x,y,z)$ frame. The stiffness of the elastic support is denoted by $K$; it is set to zero when the SRF is removed. The cylinder position is tracked by the angle $\theta$ relative to the $x$ axis. The physical variables are non-dimensionalized by $D$,
$D$,  $U$ and $\rho _f$. The non-dimensional curvilinear displacement of the body along the circular path is $\zeta =\theta /\kappa$, where $\kappa =D/R$ is the non-dimensional curvature magnitude. The limiting case where $R$ tends to infinity ( $\kappa =0$) corresponds to the transverse rectilinear motion configuration, where $\zeta$ is the non-dimensional displacement aligned with the $y$ axis. The in-line, transverse and tangential force coefficients are defined as $\{C_x,C_y,C\}=2 \{F_x,F_y,F\} /(\rho _f D U^2)$, where $F_x$, $F_y$ and $F$ are the dimensional fluid forces per unit length, parallel to the $x$ and $y$ axes, and to the direction of body motion, respectively. The motion of the cylinder is governed by the following equation:
 \begin{equation} \ddot{\zeta} + \left(2{\rm \pi} f_n\right)^2 \zeta = \dfrac{2C}{{\rm \pi} m^\star},\quad {\rm with}\ C={-}C_x \sin\left(\kappa\zeta\right) + C_y \cos\left(\kappa\zeta\right)\!. \end{equation}
The  $\dot {\ }$ symbol designates the non-dimensional time derivative. The structure to displaced fluid mass ratio, the non-dimensional natural frequency and associated reduced velocity are defined as $m^\star =4 M_c/({\rm \pi} \rho _f D^2)$, $f_n=D/(2{\rm \pi} U)\sqrt {K/M_c}$ and $U^\star =1/f_n$, respectively. In the absence of SRF ( $f_n=0$), the mass ratio is denoted by $m^\star _0$. No structural damping is included but the analysis presented hereafter also applies to damped systems.

Figure 1. (a) Sketch of the physical configuration. (b) Relative differences of the displacement amplitude ( $\zeta _{max}$) and frequency ( $f_\zeta$) with respect to the fifth-order simulation results, as functions of the polynomial order, without SRF at $Re=100$, for $\kappa =1$ and $m^\star _0=0.1$. (c) Rectilinear displacement amplitude with SRF as a function of $U^\star$, at $Re=100$ for $m^\star =10$; the present results are compared with those reported by Singh & Mittal (Reference Singh and Mittal2005) and Zhang et al. (Reference Zhang, Li, Ye and Jiang2015).
Considering a harmonic response at frequency  $f_\zeta$, the dynamics equation (2.1) indicates that the same behaviour can be observed with and without SRF, i.e. for $f_n>0$ and $f_n=0$, when
 \begin{equation} m^\star_0=m^\star\Bigg[1-\left(\dfrac{f_n}{f_\zeta}\right)^2\Bigg]={-}C_m, \end{equation}
where  $C_m$ is the effective added mass coefficient. Without SRF, the condition $m^\star _0>0$ implies that $C_m$ is negative, as also noted by Govardhan & Williamson (Reference Govardhan and Williamson2002). Therefore, only a part of the responses reached with SRF can be attained without SRF: the responses where $C_m<0$, or equivalently $f_\zeta >f_n$. The actual vibrations are often close to sinusoidal and (2.2) will be used to explore the connection between the responses arising with and without SRF, in particular the evolution of the response range accessible without SRF as $\kappa$ is varied.
A quasi-steady model of  $C$ and its first-order approximation about $\zeta =\dot \zeta =0$ can be expressed as follows (Bourguet Reference Bourguet2023b):
 \begin{equation} C^{qs} ={-}\bar{C}^{ f}_x (\dot\zeta+\sin(\kappa\zeta))\sqrt{\dot\zeta^2+2\dot\zeta\sin\left(\kappa\zeta\right)+1} \approx{-}\bar{C}^{ f}_x ( \dot\zeta + \kappa\zeta ), \end{equation}
where  $\bar {C}^{f}_x$ is the mean in-line force (or drag) coefficient in the fixed body case. The $\bar {\ }$ symbol denotes the time-averaged value. The term relative to $\zeta$ in the $C^{qs}$ approximation is used to derive a modified natural frequency
 \begin{equation} f^\prime_n=\sqrt{f^2_n+\dfrac{\bar{C}^{f}_x \kappa}{2 {\rm \pi}^3 m^\star}}. \end{equation}
The system behaviour generally departs from the quasi-steady assumption, i.e. decoupling of the flow and moving body time scales. Yet,  $f^\prime _n$ was shown to be significant, especially without SRF ( $f_n=0$), as it determines the location of the vibration region in the $(\kappa,m^\star _0)$ parameter space (Bourguet Reference Bourguet2023a). Assuming that a peak of vibration occurs close to $f^\prime _n$ when this frequency coincides with the Strouhal frequency ( $St$, frequency of flow unsteadiness for a fixed body), (2.4) indicates that the peak encountered with SRF should (i) shift towards higher $U^\star$ values, and (ii) involve higher frequencies relative to $f_n$, as $\kappa$ is increased. This suggests a decreasing trend of $C_m$ (2.2) and thus an expansion of the response range accessible without SRF. These conjectures are examined in the next section on the basis of numerical simulations.
The numerical method is the same as in previous studies concerning comparable systems (Bourguet Reference Bourguet2023a,Reference Bourguetb). It is briefly summarized and some additional convergence/validation results are presented. The coupled flow–structure equations are solved by the parallelized code Nektar, which is based on the spectral/ $hp$ element method (Karniadakis & Sherwin Reference Karniadakis and Sherwin1999). Body motion is taken into account by adding inertial terms in the Navier–Stokes equations (Newman & Karniadakis Reference Newman and Karniadakis1997). The large rectangular computational domain ( $350D$ downstream and $250D$ in front, above and below the cylinder) is discretized into $3975$ spectral elements. A no-slip condition is applied on the cylinder surface. The free-stream value is assigned for the velocity at the upstream boundary. At the downstream boundary, a Neumann-type boundary condition is used. Flow periodicity conditions are employed on the upper and lower boundaries.
Figure 1(b) depicts a convergence study in a typical case of curvilinear vibrations without SRF, at  $Re=100$. The evolutions of the relative differences with respect to the fifth-order simulation results, for the displacement amplitude and frequency ( $f_\zeta$), as functions of the spectral element polynomial order, show that an increase from order $4$ to $5$ has not impact on the results. Here, and in the following, $\bar {\zeta }=0$ and the amplitude is measured as the maximum value of the displacement signal ( $\zeta _{max}$). A polynomial order of $4$ was selected. A similar procedure was employed to set the non-dimensional time step to $0.0025$. The rectilinear displacement amplitudes observed with SRF at $Re=100$ are compared in figure 1(c) with those reported by Singh & Mittal (Reference Singh and Mittal2005) and Zhang et al. (Reference Zhang, Li, Ye and Jiang2015). This comparison confirms the validity of the present numerical method.
Each simulation is initialized with the established flow past a fixed body at the selected  $Re$. Then, the body is released with an initial velocity $\dot \zeta =0.1$. The analysis is based on time series collected after convergence, over $30$ oscillation cycles in the unsteady cases.
3. Flow-induced vibrations with and without SRF
As a first step, focus is placed on the behaviour of the flow–structure system with SRF. The vibrations occurring at  $Re=25$ and $Re=100$, i.e. subcritical and postcritical values of $Re$, are depicted in figures 2 and 3, which represent the displacement amplitude and frequency as functions of $U^\star$, for $m^\star =10$. At each $Re$, the rectilinear path configuration ( $\kappa =0$) is considered first, then $\kappa$ is progressively increased to visualize its influence on response properties. In all cases, the displacement amplitude exhibits a bell-shaped trend as a function of $U^\star$, which is typical of VIV. On each side of the bell-shaped curve, the flow–structure system reaches a steady state at $Re=25$, while residual oscillations of low amplitudes persist at $Re=100$. To facilitate the presentation, at $Re=100$, the term ‘vibration region’ designates the $U^\star$ (or $-C_m$ in the following) range where $\zeta _{max}>0.1$.

Figure 2. Displacement (a–d) amplitude and (e–h) frequency with SRF, as functions of  $U^\star$ ( $m^\star =10$), at $Re=25$, for (a,e) $\kappa =0$, (b, f) $\kappa =0.1$, (c,g) $\kappa =0.5$ and (d,h) $\kappa =2$. The displacement frequency is plotted together with the natural frequency, the modified natural frequency (2.4) and $St$; the frequency range is normalized by the natural frequency. Yellow and grey background colours denote the regions where $C_m<0$ ( $f_\zeta >f_n$) and $C_m>0$ ( $f_\zeta < f_n$), i.e. the regions of responses accessible and inaccessible without SRF, respectively.

Figure 3. Same as figure 2 at  $Re=100$ for (a, f) $\kappa =0$, (b,g) $\kappa =0.1$, (c,h) $\kappa =1$, (d,i) $\kappa =5$ and (e, j) $\kappa =11$.
Body motion and flow unsteadiness are always synchronized at  $Re=25$, regardless of $\kappa$. This locked regime, which corresponds to the lock-in condition usually reported for VIV (Williamson & Govardhan Reference Williamson and Govardhan2004), also dominates at $Re=100$. In addition, a desynchronized regime, called unlocked and enhanced by path curvature (Bourguet Reference Bourguet2023b), may develop at this $Re$, near the edges of the vibration region. Despite the possible emergence of small higher-harmonic contributions and incommensurable components (at flow unsteadiness frequency in the unlocked regime), the vibrations remain close to sinusoidal in most cases. This justifies the application of the analysis introduced in § 2 (2.2) to link the responses arising with and without SRF. The value of $C_m$ discussed hereafter is determined via (2.2). It is equal to the partial added mass coefficient associated with the spectral components of $\zeta$ and $C$ at the dominant frequency of body displacement ( $f_\zeta$), and thus to the total added mass coefficient for sinusoidal oscillations. In figures 2 and 3, $f_\zeta$ is normalized by $f_n$ and plotted together with the normalized values of $f^\prime _n$ and $St$. At $Re=25$, the $St$ value ( $0.105$) is that obtained by Kou et al. (Reference Kou, Zhang, Liu and Li2017) by triggering the flow, and is $St=0.164$ at $Re=100$.
Along a rectilinear path ( $\kappa =0$), the structural responses occur below $f_n$ for all $U^\star$ at $Re=25$, and over a large portion of the vibration region, which includes the peak amplitude, at $Re=100$. Equation (2.2) predicts that the responses where $f_\zeta >f_n$ ( $C_m<0$) can be attained without SRF, while those where $f_\zeta < f_n$ ( $C_m>0$) cannot be reached. The corresponding $U^\star$ ranges are indicated by yellow and grey background colours, respectively. As shown later in this section, these predictions are confirmed by the simulations carried out without SRF.
Within the vibration region, the ratio  $f_\zeta /f_n$ tends to increase with $\kappa$. The proximity between $f_\zeta$ and $f^\prime _n$ suggests that this increasing trend is driven by the evolution of $f^\prime _n$, whose deviation from $f_n$ is governed by the combined effects of the mean drag force and path curvature (2.4). The $U^\star$ range where $f_\zeta >f_n$ expands towards the lower limit of the vibration region, and crosses this limit, as $\kappa$ is increased. According to (2.2), this signifies a progressive widening of the subset of responses accessible without SRF. For $\kappa =2$ at $Re=25$ and $\kappa =5$ at $Re=100$, this subset encompasses all the responses encountered in the vibration region.
Figure 4 represents the vibration region, as well as the areas of responses accessible and inaccessible without SRF, in the  $(\kappa,U^\star )$ and $(\kappa,-C_m)$ domains, for each $Re$. It provides a global visualization of the expansion of the accessible response area, and of the simultaneous reduction of the inaccessible response area, within the vibration region, as $\kappa$ is increased. This phenomenon corresponds to a regular translation of the vibration region along the effective added mass axis (figure 4a ii,b ii). The location of the peak amplitude (red dashed-dotted line) does not precisely coincide with $f^\prime _n=St$ (figures 2 and 3), but it shifts towards higher $U^\star$ when $\kappa$ is increased, as conjectured on the basis of (2.4). It can be noted that the peak amplitude enters the accessible response area for $\kappa \approx 0.7$, at both $Re$ values. The similitude in the distribution of the accessible and inaccessible response areas relative to the vibration region, at $Re=25$ and $Re=100$, denotes a continuity of the physical mechanisms between the subcritical- and postcritical- $Re$ ranges.

Figure 4. Vibration region with SRF in the  $(\kappa,U^\star )$ domain (a i,b i), and in the $(\kappa,-C_m)$ domain (a ii,b ii), at (a) $Re=25$ and (b) $Re=100$. Black solid and dashed lines delimit the areas where $\zeta _{max}>0$ in (a) and $\zeta _{max}>0.1$ in (b). Yellow and grey background colours denote the regions where $C_m<0$ ( $f_\zeta >f_n$) and $C_m>0$ ( $f_\zeta < f_n$), i.e. the regions of responses accessible and inaccessible without SRF, respectively. A red dashed-dotted line locates the value of $U^\star$ or $-C_m$ where the peak amplitude is reached. Grey dotted lines indicate the cases visualized in figures 2, 3, 5 and 6.
In order to compare the responses of the systems with and without SRF, the displacement amplitudes and frequencies measured in both cases are plotted as functions of  $-C_m$ in figures 5 ( $Re=25$) and 6 ( $Re=100$). The values of $\kappa$ are the same as in figures 2 and 3. It is recalled that $C_m$ is determined via (2.2) and thus $-C_m=m^\star _0$ in the absence of SRF; here, $m^\star _0$ ranges from $0.05$ to $10$ while $m^\star =10$. These plots further illustrate the translation of the vibration region identified with SRF, from positive to negative $C_m$ values, as $\kappa$ is increased.

Figure 5. Displacement (a–d) amplitudes and (e–h) frequencies with and without SRF, as functions of  $-C_m$, at $Re=25$, for (a,e) $\kappa =0$, (b, f) $\kappa =0.1$, (c,g) $\kappa =0.5$ and (d,h) $\kappa =2$; without SRF, $-C_m=m^\star _0$. The displacement frequencies are plotted together with the modified natural frequency ((2.4) with $f_n=0$) and $St$. Yellow and grey background colours denote the regions of negative and positive $C_m$, respectively.

Figure 6. Same as figure 5 at  $Re=100$ for (a, f) $\kappa =0$, (b,g) $\kappa =0.1$, (c,h) $\kappa =1$, (d,i) $\kappa =5$ and (e, j) $\kappa =11$.
Without SRF, no vibration appears at  $Re=25$ for $\kappa =0$. At $Re=100$, the rectilinear responses present substantial magnitudes only for low $m^\star _0$, and their frequencies are restrained to a narrow range lower than $St$. An increase of $\kappa$ results in the emergence of vibrations at $Re=25$ and in an amplification of the responses, which exhibit substantial magnitudes over wider $m^\star _0$ intervals, and explore extended frequency ranges, roughly following the trend of $f^\prime _n$. As for the system with SRF, the locked regime dominates the flow-body dynamics and the responses are overall close to sinusoidal. Occurrences of the unlocked regime at $Re=100$ may, however, cause some slight deviations from harmonic evolutions (Bourguet Reference Bourguet2023a).
The vibrations developing with and without SRF for  $C_m<0$ are almost identical at $Re=25$ (figure 5). At $Re=100$, some differences are expected due to possible deviations from sinusoidal oscillations, but the collapse of the responses appearing with and without SRF globally persists (figure 6). This indicates that the responses encountered with SRF can provide a reasonable a priori estimate of those arising without SRF. When the vibration region observed with SRF moves towards negative $C_m$ values, as $\kappa$ is increased, all the responses with substantial amplitudes reached with SRF are progressively attained without SRF. Beyond a certain $\kappa$ value, the presence or absence of SRF becomes nearly indiscernible. In other words, the behaviours of the systems with and without SRF, which clearly differ for $\kappa =0$, tend to converge under the effect of path curvature.
4. Conclusions
The FIV of a cylinder with and without SRF have been examined with special attention paid to the influence of path curvature on their evolutions and possible connections. The study was conducted numerically for a cylinder, mounted on an elastic support or not, and free to translate along a circular path of variable radius, within a current at subcritical and postcritical Reynolds numbers,  $Re=25$ and $Re=100$.
Under a harmonic oscillation assumption, the responses accessible without SRF correspond to those observed with SRF for which the effective added mass is negative. The actual vibrations issued from the simulations with and without SRF, and associated with negative  $C_m$, globally collapse. Such a collapse is expected as the vibrations, which mainly develop through flow-body synchronization, and less frequently through a desynchronized regime, are generally close to sinusoidal. Along a transverse rectilinear path, i.e. the limiting case where path radius tends to infinity, most of the significant vibrations arising with SRF are characterized by positive $C_m$ and thus a priori inaccessible without SRF. The simulated behaviours of the systems with and without SRF do indeed differ: vibrations occur with SRF but not without SRF at $Re=25$, and the peak amplitudes reached with SRF at $Re=100$ are not attained without SRF.
The principal result of this work is that the response ranges explored with and without SRF progressively converge as path curvature magnitude is increased. The simulations with SRF show that an increase of curvature magnitude causes a reduction of  $C_m$, which indicates an expansion of the response range accessible without SRF. This expansion is confirmed by the simulations without SRF. It can be linked to the combined effects of the mean drag and path curvature, which tend to increase the ratio between the displacement and natural frequencies, or, equivalently, reduce $C_m$. The convergence of the system behaviours is accompanied by an enhancement of the responses appearing without SRF, as illustrated by the emergence of vibrations at $Re=25$ and the widening of the mass-ratio intervals where significant responses develop. Beyond a certain curvature magnitude, all the significant vibrations encountered with SRF are also attained without SRF, and the presence or absence of SRF is virtually undetectable.
The similitude of the observations made at  $Re=25$ and $Re=100$ reflects a continuity of the physical mechanisms at play between the subcritical- and postcritical- $Re$ ranges. This suggests that the phenomena described here, in particular the convergence of the responses occurring with and without SRF, could persist at higher $Re$.
$Re$.
Acknowledgements
This work was performed using HPC resources from CALMIP (grants 2023-P1248 and 2024-P1248).
Funding
This research received no specific grant from any funding agency, commercial or not-for-profit sectors.
Declaration of interests
The author reports no conflict of interest.


 Open access