


The prevalence of obesity continues to rise worldwide. According to a 2014 WHO report, 1·9 billion people aged 18 years or over in the world are overweight, 600 million of whom are estimated to be obese( 1 ). Obesity is directly related to various adverse health outcomes such as osteoarthritis and back pain and is also indirectly associated with type 2 diabetes and hypertension( Reference Thijssen, van Caam and van der Kraan 2 – Reference Vaneckova, Maletinska and Behuliak 4 ), among other illnesses.
Several indicators have been used to define obesity in the literature, including BMI, waist circumference (WC) and percentage of body fat (%BF). Different anthropometry indices have been suggested for predicting the risk of obesity-associated diseases such as diabetes and coronary artery disease( Reference Xiao, Liu and Sun 5 – Reference Aune, Sen and Schlesinger 11 ). Moreover, the classification of obesity may change when factors such as race or ethnicity are considered( Reference Rahman and Berenson 12 , Reference Anoop 13 ). The WHO classifies obesity based on BMI, a simple index that categorizes adults as underweight (BMI<18·5 kg/m2), overweight (BMI=25·0–29·9 kg/m2) or obese (BMI≥30·0 kg/m2)( 14 ). However, BMI does not distinguish between muscle or fat in a person’s weight. Because the relative level of fat increases and the mass of muscle decreases with age, such factors should also be considered( Reference Rothman 15 ). Body fat distribution is also an important factor in predicting obesity-related diseases. Therefore, WC is widely used to measure central or abdominal obesity( Reference Klein, Allison and Heym 16 , Reference Janssen, Katzmarzyk and Ross 17 ). Research has also shown that %BF measured using whole body dual-energy X-ray absorptiometry could compensate for the underestimation of obesity using BMI( Reference Pasco, Holloway and Dobbins 18 ).
Given the various health outcomes linked to obesity, there is a need for a composite indicator to comprehensively reflect the co-morbidities and quality of life related to obesity that could guide its management. The Edmonton Obesity Staging System (EOSS) is a recently derived composite indicator aiming to fulfil this role( Reference Sharma and Kushner 19 ). It considers physical, psychological and functional limitations and classifies individuals into five stages of obesity-related health risk (see Table 1)( Reference Sharma and Kushner 19 ).
Edmonton Obesity Staging System and clinical features for classification
GFR, glomerular filtration rate.
† Stage 4 is excluded from the analysis as relevant information is not available.
The objective of the current study was to assess commonly used obesity indicators in comparison with the EOSS indicator in predicting comprehensive health status with regard to obesity. The findings of the study will contribute to the use of a single, effective obesity indicator to identify individuals with adverse health outcomes related to obesity, which will consequently enhance effective obesity-related disease management.
Methods
Data
Data collected as part of the Korea National Health and Nutrition Examination Survey (KNHANES) between July 2008 and May 2011 were used. The KNHANES data set is an ongoing nationally representative cross-sectional survey and data are collected annually. However, %BF was measured only between 2008 and 2011, which constrained the use of these data to only those four years for the current study( Reference Kim 20 ). The KNHANES data are strong given that all obesity-related indicators are directly measured( Reference Kim 20 ).
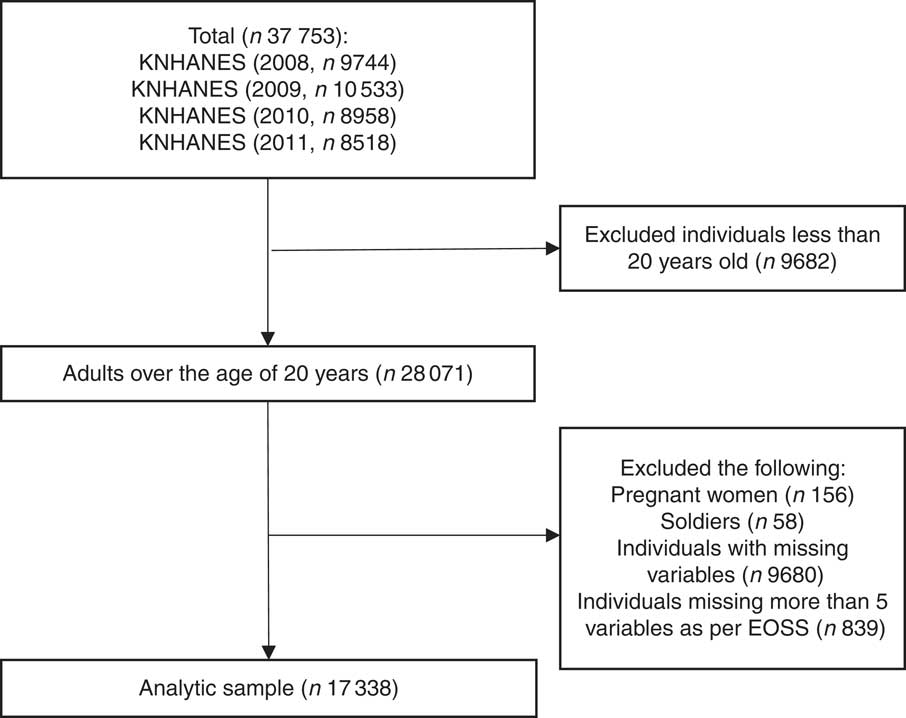
A total of 37753 individuals were observed between 2008 and 2011, of whom adults over the age of 20 years were included in the current study (n 28701). For the remaining adult sample, groups from whom meaningful data could not be collected, such as pregnant women (n 156) and soldiers (n 58), were excluded. Furthermore, 9680 participants with missing values from among the selected obesity indicators were excluded, as were 839 individuals who could not be staged according to the EOSS owing to inadequate health information. Therefore, after applying the exclusion criteria, a total of 17338 adults were included for study analysis (Fig. 1).
Sample selection process (KNHANES, Korea National Health and Nutrition Examination Survey; EOSS, Edmonton Obesity Staging System)
Obesity indices
Four indirect obesity indicators were used to define obesity: BMI (body weight in kilograms divided by the square of height in metres), WC (in centimetres), waist-to-height ratio (WHtR; calculated by dividing WC in centimetres by height in centimetres) and %BF. Based on each indicator, obesity was defined as follows: (i) BMI≥30·0 kg/m2; (ii) WHtR>0·53 and >0·49, respectively, for men and women( Reference Parikh, Joshi and Menon 21 – Reference Schneider, Friedrich and Klotsche 23 ); (iii) %BF>25 and >32 %, respectively, for men and women according to the American Council on Exercise( Reference Bryant and Greent 24 ); and (iv) abdominal obesity (measured by WC) >90 and >85 cm, respectively, for men and women( Reference Berber, Gomez-Santos and Fanghanel 25 ).
The EOSS was used as a composite indicator to define obesity (Table 1). Stage 0 is defined by a lack of signs of risk factors related to obesity. Stage 1 signifies that there are subclinical risk factors related to obesity but mild physical, psychological or functional limitations. Stage 2 indicates that the patient has developed a chronic disease related to obesity and requires treatment. Stage 3 is defined by significant damage to end organs due to obesity. Stage 4 signifies that the patient has severe co-morbidities related to obesity and may have end-stage disease or that the patient has severe psychological disease or functional limitations. Because the KNHANES does not currently use its data to classify individuals into different EOSS stages, this classification was performed using current practice guidelines. An individual with an EOSS classification of stage 2 or higher was defined as obese( Reference Kuk, Ardern and Church 26 ).
Cohen’s κ coefficient was used to measure inter-measurement agreement for obesity. Conformity between internal and five indirect obesity indicators was used as the binary dependent variable. We further assessed conformity between the indirect and internal obesity indicators for the actual presence of obesity-related diseases based on the EOSS as follows: (i) percentage agreement (proportion classified as obese and severely unhealthy as a result of obesity among the total sample); (ii) sensitivity (proportion classified as obese among individuals severely unhealthy as a result of obesity); and (iii) specificity (proportion classified as non-obese among fairly healthy individuals).
Covariates
Sociodemographic characteristics including sex, marital status, residential area, occupation, smoking habit, drinking habit, number of household members and household income were considered used as the independent variables. Marital status was classified as married or single/non-married, as reported. Residential area was classified into cities and rural areas. Cities were further classified into large (metropolitan) and small cities. No high-school diploma, high-school diploma, and college diploma or a higher qualification comprised the educational background classification.
No occupation, blue-collar workers and white-collar workers comprised the classification for occupation-related variables. Individuals who responded that they had no job, as well as those who were housewives or students, were all included in the no occupation group. Blue-collar workers included those working in the fisheries, forestry and agricultural industries, workers employed in device and machine manipulation and assembly, and manual workers. White-collar workers included managers, professionals, office workers, and service and sales personnel. Respondents were categorized as significant drinkers if they reported drinking more than five times per week (with the rest as the reference). Monthly household income in 10000 won was calculated by dividing total household income by the number of family members in each household.
Statistical methods
A t test was conducted to compare specificity and sensitivity across different indirect obesity measurements. Logistic regression analysis was used to identify sociodemographic factors showing the strongest association with the conformity of indirect obesity indicators and obesity as identified by the EOSS. The complex sampling design was adjusted for in all analyses. The statistical software package Stata version 13 (2009) was used for all analyses.
Results
The prevalence of obesity was 3·67 % based on BMI. When WC was used, 26·26 % of women and 43·30 % of men were classified as obese. The prevalence further changed to 46·30 % when %BF was used. Depending on the obesity indicator, there was a twelvefold difference in prevalence rate. Almost half of the sample lived in a large city. Approximately one-third of the sampled persons were current smokers, while 21·97 % reported heavy alcohol consumption. According to the general characteristics of the study sample, 33·23 % of the 17 338 respondents would be considered obese based on the EOSS. Specifically, 2·80 % would be classified as being in stage 0, 30·44 % as being in stage 1, 62·78 % as being in stage 2 and 3·99 % as being in stage 3 (Table 2).
Characteristics of the study participants: adults aged ≥20 years, Korea National Health and Nutrition Examination Survey, 2008–2011

EOSS, Edmonton Obesity Staging System; WC, waist circumference; WHtR, waist-to-height ratio; %BF, percentage of body fat.
† Obesity is determined if individuals belong to the EOSS stage 2 or higher.
‡ Obesity is determined if BMI≥30 0 kg/m2.
§ Obesity is considered to exist when WC is >90 and >85 cm for men and women, respectively.
║ Obesity is considered to exist when WHtR is >0·53 and >0·49 for men and women, respectively.
¶ Obesity is considered to exist when %BF is >25 and >32 % for men and women, respectively.
†† Large city=business or financial hub; small city=metropolitan city, rural area=county/town.
‡‡ Monthly household income calculated by dividing total household income by the number of family members in the household (unit: 10000 won).
§§ Those with no occupation=those who responded that they do not have job, including housewives and students. Blue-collar workers=skilled workers in the agriculture, forestry and fisheries industries, workers employed in device and machine manipulation and assembly, and manual workers. White-collar workers=managers, professionals, office workers, and service and sales staff.
║║ Smoking=those who smoke currently; non-smokers=those who do not smoke currently.
¶¶ Excessive drinking=those who responded that they drink more than five times per week.
Overall, Cohen’s κ coefficient was low when the EOSS was compared with indirect obesity indicators, ranging between 0·0228 and 0·1819. Across indirect obesity indicators, the intra-measurement agreement was the highest between WHtR and WC, followed by WHtR and %BF (Table 3).
Cohen’s κ statistics for obesity measurements among adults aged ≥20 years, Korea National Health and Nutrition Examination Survey, 2008–2011
EOSS, Edmonton Obesity Staging System; WHtR, waist-to-height ratio; %BF, percentage of body fat; WC, waist circumference.
† EOSS stage 2 or higher.
‡ BMI ≥30 0 kg/m2.
§ WHtR>0·53 (for men) or >0·49 (for women).
║ %BF>25 % (for men) or >32 % (for women).
¶ WC>90 cm (for men) or >85 cm (for women).
The level of conformity to the EOSS was the highest for WHtR (60·77 %) followed by %BF (55·20 %). The level of conformity was lowest for BMI (35·96 %). Conformity was then further dissected in terms of sensitivity and specificity. The sensitivities of the indirect obesity indicators showed significant variations by indicator, with the smallest for BMI (4·8 %) and largest for WHtR (53·7 %). These results imply that, for example, only 4·8 % of individuals considered obese by the EOSS would be classified as obese based on BMI. At the same time, the specificities of the indirect obesity indicators had a relatively tight range, largest for BMI (98·4 %) and smallest for %BF (63·0 %). The levels of sensitivity and specificity were all statistically significantly different from each other across all indirect obesity indicators at the 1 % significance level (Table 4).
Concordance in classification between the Edmonton Obesity Staging System (EOSS) and other obesity measurement indices among adults aged ≥20 years, Korea National Health and Nutrition Examination Survey, 2008–2011

WHtR, waist-to-height ratio; %BF, percentage of body fat; WC, waist circumference.
† Statistically significantly different from the validity value using BMI for obesity measurement at the 5 % level.
‡ Statistically significantly different from the validity value using WHtR for obesity measurement at the 5 % level.
§ Statistically significantly different from the validity value using %BF for obesity measurement at the 5 % level.
Table 5 presents a multivariate logistic regression analysis of the conformity between health status with regard to obesity based on the EOSS and indirect obesity indicators. The probability that obesity classification would conform between BMI and the EOSS was 0·58 times less likely for men than for women, 0·79 times less likely for the non-employed than for blue-collar workers, and less likely for individuals in each older age group than for those in their 20s. However, the probability of conformity was 1·16 times higher for non-heavy drinkers than for heavy drinkers and higher for the more highly educated groups (1·32 and 1·48 times more likely for high-school graduates and college graduates, respectively) than for those with less than a high-school education (model A of Table 5).
Logistic regression analysis on the conformity of the Edmonton Obesity Staging System (EOSS) obesity classification to the classification based on indirect indices among adults aged ≥20 years, Korea National Health and Nutrition Examination Survey, 2008–2011

WHtR, waist-to-height ratio; %BF, percentage of body fat; WC, waist circumference.
*P<0·05, **P<0·01.
† Obesity is determined for those who belong to EOSS stage 2 or higher.
‡ Obesity is considered to exist when BMI≥30·0 kg/m2.
§ Obesity is considered to exist when WHtR is >0·53 and >0·49 for men and women, respectively.
║ Obesity is considered to exist when %BF is >25 and >32 % for men and women, respectively.
¶ Obesity is considered to exist when WC is >90 and >85 cm for men and women, respectively.
The results for WHtR also revealed that the probability of conformity was 0·57 times less likely for men than for women, 0·69 times less likely for married than for single/non-married people, and less likely for the more educated (0·75 and 0·78 times less likely for high-school graduates and for those with a college diploma or a higher educational qualification, respectively) than for those with a qualification lower than a high-school education. The lower likelihood of conformity among older individuals was statistically significant only for adults younger than 60 years (by 0·84 times for individuals in their 30s, 0·73 times for those in their 40s and 0·74 times for those in their 50s) than for individuals in their 20s (model B of Table 5).
When %BF was used, the probability of conformity was 0·70 times lower for men than for of women, but 1·16 and 1·19 times higher for white-collar and non-employed individuals, respectively, than for blue-collar individuals. With regard to the likelihood of conformity of WC, the results were similar to those of %BF; it was 0·75 times lower for men than for women and lower for older individuals (0·84 times lower for those in their 30s, 0·62 times lower for those in their 40s, 0·47 times lower for those in their 50s, 0·45 times lower for those in their 60s, 0·46 times lower for those in their 70s and 0·26 times lower for those aged 80 years or above) than for individuals in their 20s. However, it was 1·12 times higher for white-collar workers than for blue-collar workers (models C and D of Table 5).
Discussion
The present study aimed to compare the consistency of obesity measurement as determined by four indirect indices including BMI, WHtR, WC and %BF, which have been frequently used in the literature, with the EOSS, a composite measurement system reflecting internal health status with regard to obesity. Overall, sensitivity was statistically significantly lower than specificity, which implies a high proportion of false negatives among individuals who are unhealthy owing to obesity or a low proportion of true negatives among negatives. This also implies that a high proportion of people were determined to be non-obese by an indirect index despite being unhealthy as a result of obesity, whereas a low proportion of people were unhealthy owing to obesity-related diseases despite being determined to be non-obese by an indirect index. The findings of the current study show that WHtR has the highest sensitivity, whereas BMI has the lowest. Therefore, WHtR is the most useful in terms of its potential to maximize identification of individuals at risk for obesity-related health issues. Simultaneously, a majority of these individuals are actually likely to be unhealthy as a result of diseases related to obesity when classified as obese based on their BMI.
It is difficult to directly compare the present results with those of others because no previous study has attempted to assess the actual predictability of indirect obesity indicators based on EOSS. However, studies on obesity-related diseases that utilized indirect obesity indicators have shown that WHtR can best predict the risk of diabetes among indirect indicators such as BMI, WC and WHtR( Reference Son, Kim and Park 8 ). In addition, another study showed that WHtR was superior to BMI in predicting coronary artery disease( Reference Sabah, Chowdhury and Khan 7 , Reference Page, Rexrode and Hu 27 ).
Logistic regression analysis on conformity showed that predictions based on BMI were better among individuals with higher educational qualifications than among those who had less than a high-school level of education. This finding can be attributed to the higher likelihood of individuals with lower education having a blue-collar job that involves physical activities( Reference Stephen 28 – Reference Gadar and Abony 30 ), which results in a high muscle mass. Based on WHtR, the prediction rate was better in those who did not graduate from high school because such individuals usually have low household income and are unable to consume high-quality food. This may cause central obesity( Reference Bryant and Greent 24 , Reference Berber, Gomez-Santos and Fanghanel 25 ). WC was better able to predict obesity for white-collar workers than for blue-collar workers because the former often have higher WC owing to having long-term sedentary occupations( Reference An 31 ). Our findings show that the predictability of the indirect indices becomes lower, particularly for BMI and WC, in older groups. However, ageing itself is a well-known risk factor for chronic diseases related to obesity and risk factors other than obesity may coexist as people age( Reference Wang 32 – Reference Hauer, Ruigrok and Algra 35 ).
The present study’s findings need to be interpreted with caution given that some disease measurements were based on self-reported information. Obtaining information from cross-sectional studies also limits the interpretation of the results, given that assumptions regarding the precedence of indirect obesity measurement to diseases related to obesity are not warranted in the current study. Regardless, the study has the advantage of using a nationally representative data set that also collected most of the information on obesity and health status related to obesity from real measures such as blood tests rather than relying on using self-reported data. We also comparatively assessed multiple indices for obesity measurement in terms of their potential to identify individuals at risk for obesity-related diseases. The current study is also the first to apply the EOSS, the composite index to assess obesity to account for health status.
Conclusions
Accurately identifying those who are at risk for health issues due to obesity is crucial given the seriousness of obesity as a risk factor for various chronic diseases, as well as for mortality. The present study’s assessments have shown that WHtR is likely to be a useful index for obesity measurement in terms of correctly identifying individuals at risk for health issues due to obesity. Individual demographic factors, particularly sex, also need to be considered in selecting the most appropriate measurement of obesity.
Acknowledgements
Financial support: Research support from the Korea National Research Foundation (grant number 2017R1A2B4003373) is gratefully acknowledged. The content is solely the responsibility of the authors and does not necessarily represent the official view of the Korea National Research Foundation. The Korea National Research Foundation had no involvement in the preparation and submission of this manuscript. Conflict of interest: The authors declare that they have no competing interests. Authorship: J.M. and E.H. conceived the paper. J.M. and E.H. carried out the analyses. J.M. drafted the manuscript. K.Y.J., T.H.K. and E.H. substantially revised the manuscript. All authors discussed the results and contributed to the final manuscript. Ethics of human subject participation: Not applicable.


