





Food insecurity (FI) is a global concern, as highlighted by the UN’s Sustainable Development Goal 2 (SDG 2) which aims to end hunger and ensure universal access to safe, nutritious and sufficient food by 2030(1). Despite ongoing international efforts, the issue of FI has worsened since 2015, exacerbated by a complex interplay of factors, including the COVID-19 pandemic(2). In 2023, an estimated 28·9 % of the global population – 2·33 billion people – were moderately or severely food insecure(3).
While FI remains a widespread challenge, its prevalence varies across regions and demographic groups. Previous studies have pointed out that certain groups are disproportionally affected by FI, including households with children and individuals with low incomes or those who are unemployed(Reference Smith, Bertmann and Pinard4,Reference Bastian, Parks and Yaroch5) . More recently, FI has emerged as a significant concern among students enrolled in post-secondary institutions(Reference Bruening, Argo and Payne-Sturges6–Reference Loofbourrow and Scherr14). Compared with the general population, university students appear to be at a considerably higher risk, with prevalence estimates consistently indicating that a substantial share of this group is affected. A systematic review by Bruening et al. (Reference Bruening, Argo and Payne-Sturges6) reported an average FI prevalence of 42·0 % (range 12·5–84·0 %), based largely on studies employing the USDA’s ten-item Adult Food Security Module. These findings have been reinforced by a more recent systematic review and meta-analysis by McKay et al. (Reference McKay, Olajide and Melleuish7), which estimated that 42·2 % of students experience FI. While prevalence estimates vary widely across contexts (11·8–98·0 %), the evidence underscores the scale of the problem.
The impacts of FI on students are wide-ranging. Behaviours such as skipping meals or reducing portion sizes are often indicators of FI, reflecting the strategies students adopt when food access is limited. In turn, FI has broader consequences for academic outcomes, including missed classes and dropped courses(Reference Itani, Mattar and Kharroubi15–Reference Smith, Story and Hobbs17). Besides academic success, FI also impacts mental health outcomes as shown among others by Itani et al. (Reference Itani, Mattar and Kharroubi15). They show that in Lebanon a substantial proportion of students experience FI, which is strongly linked to poorer mental health and well-being, underscoring the need for targeted public health interventions. Previous studies have also investigated which factors increase the likelihood of being food insecure among students. These studies show that those from ethnic minority backgrounds and undergraduate programmes, who rely on scholarships or student loans for support(Reference Gaines, Robb and Knol18), as well as those coming from a household with low educational level (measured via parental educational)(Reference Itani, Mattar and Kharroubi15), are more likely to be affected.
While research on FI among university students has grown, particularly in regions like the USA, studies from Europe remain limited(Reference Kötzsche, Teuber and Jordan11,Reference Bauch, Torheim and Almendingen19–Reference Witkowiak, Idris and Sato22) , highlighting a critical gap in the literature. Nevertheless, there is direct as well as indirect evidence that FI and its attendant consequences are present in European universities. While insights can be drawn from the more extensive US literature, the lack of European-specific evidence underscores why this study is critical: to generate contextually relevant data that can inform policy responses tailored to the European higher education setting(Reference Gundersen23).
In this context, the research project titled ‘Food Insecurity among European University Students during the COVID-19 Pandemic’ (FINESCOP) seeks to address this research gap by conducting a comparative analysis of FI among university students across nine European countries. This study employs the Food Insecurity Experience Scale (FIES) to measure FI, which enables the calculation of cross-country comparable prevalence rates(Reference Ballard, Kepple and Cafiero24,Reference Cafiero, Viviani and Nord25) . By shedding light on the extent of FI within this population, this study aims to provide insights into regional differences in the prevalence of FI and the associated factors with FI. Understanding FI among this group is crucial for developing targeted interventions that ensure all students have reliable access to adequate food, thereby supporting their academic success and overall well-being(Reference Kötzsche, Arroyo-Izaga and Heil26).
Methods
Study design and participant recruitment
This is a cross-sectional research in which nine European universities participated, each located in a different European country (from the north to the south and from the west to the east): University of Iceland (Iceland), Oslo Metropolitan University (OsloMet) (Norway), University of Eastern Finland (UEF) (Finland), Justus Liebig University (JLU) Giessen (Germany), Medical University of Silesia (Poland), Polytechnic Institute of Bragança (IPB) (Portugal), University of the Basque Country (EHU) (Spain), Università Cattolica del Sacro Cuore (Italy) and Ege University (Türkiye). All participating universities are public, except for the one in Italy, which is private. To be eligible to participate in the study, respondents had to be at least 18 years old, enrolled as either undergraduate (e.g. bachelor’s) or postgraduate (e.g. master’s and PhD) students at the universities participating in FINESCOP and have access to the Internet, as they were required to complete an online questionnaire. Furthermore, they could be of any nationality. No student was excluded, following the example of previous studies(Reference Owens, Brito-Silva and Kirkland27). The survey was conducted between 1 November 2021 and 17 May 2022, with the exception of the Italian university, which collected data between 14 March 2022 and 19 June 2023 (see online supplementary material, Supplemental Table 1).
Questionnaire
The FINESCOP project team utilised a questionnaire comprising seventy questionnaire items, developed collaboratively by researchers from all participating universities (for detailed methodology, see González-Pérez et al. (Reference González-Pérez, García-Iruretagoyena and Martinez-Perez9) and Cortez-Ribeiro et al. (Reference Cortez-Ribeiro, Ferro-Lebres and Arroyo-Izaga28)). The questionnaire was developed in English and was designed to be completed in approximately 20 min on a computer or mobile device. Except for the FIES, the other tools that had not been previously validated in languages other than English were translated into the local languages using the parallel translation/double translation method(Reference Tsang, Royse and Terkawi29). The questionnaire was made available in both English and the respective local languages, with the exception of the Norwegian institution. At OsloMet, the questionnaire was administered exclusively in English in order to accommodate international students and in recognition of the high level of English proficiency among Norwegian students.
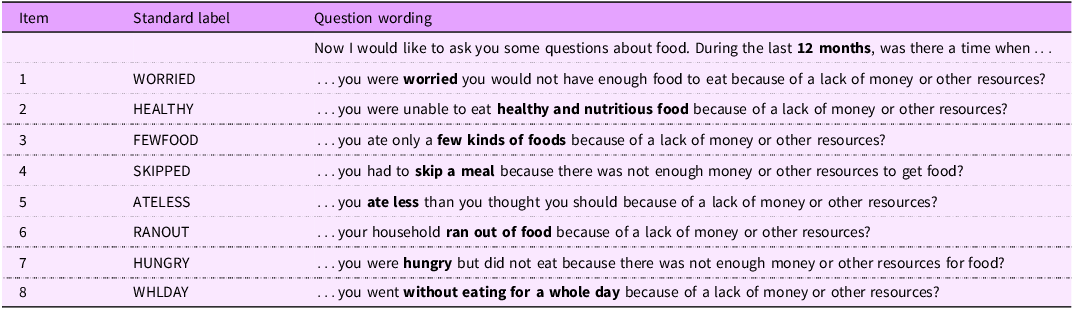
In the present paper, we show results about demographic variables (gender, age and place of birth), socio-economic variables (participation in food assistance programmes or other type of food assistance, having student loans and parents’ highest educational level), educational variables (level of studies and international student status) and FI. The primary instrument to assess FI was the FIES, an established tool validated in various settings and different languages. The FIES consists of eight items that assess the respondent’s experiences of limited access to food over the past 12 months (Table 1). Participants could answer with either ‘Yes’, ‘No’, ‘Don’t know’ or ‘Don’t want to answer’ to each item(Reference Ballard, Kepple and Cafiero24).
English version of the Food Insecurity Experience Scale (FIES)(Reference Ballard, Kepple and Cafiero24)

Data collection and sample
Each university implemented a web-based survey using either SoSci Survey, Qualtrics, Nettskjema, Webropol, Microsoft Forms or Google Forms, making it accessible to all students with Internet access who were enrolled at the respective institution (see online supplementary material, Supplemental Table 1). Recruitment strategies included a combination of campus-wide announcements, targeted emails, posts on social media platforms and promotional efforts at campus informational booths to maximise student participation. Additionally, some universities incentivised participation by offering gift card raffles.
To ensure data protection and anonymity, no personal data were collected during the survey. The individual databases from each university were combined into a single, comprehensive dataset. All closed answers were coded the same way in all applications of the participating universities to facilitate the subsequent combined analysis. The data were then reviewed and cleaned to ensure that entries were correct and internally consistent. This database cleaning was carried out using the methodology described by Bonillo Martín(Reference Bonillo Martín30). During this process, four participants were excluded for not meeting the inclusion criterion of being 18 years of age or older.
Statistical analysis
Data analysis was conducted using R version 4.2.1 (2022-06-23). Statistical validation is a critical step in ensuring data quality. Following the FIES analysis procedure recommended by FAO(31), we applied the Rasch model to the FIES response data to determine its alignment with the model’s underlying assumptions. Cases with missing responses (‘Don’t know’ and/or ‘Don’t want to answer’) and cases with an extreme raw score of 0 or 8 were excluded from the analysis. The raw score is the sum of the eight FIES items, with ‘yes’ coded as one point and ‘no’ as zero points. As recommended in FAO guidelines, extreme scores were not retained for statistical validation because they provide no information for estimating item severity in the Rasch model and may distort model fit(Reference Cafiero, Viviani and Nord25,31) . Only complete, non-extreme cases were retained for statistical validation, which should include at least 100 cases to ensure confidence in the results; a provisional validation is possible for datasets containing 100–299 complete, non-extreme cases(31).
Three key metrics were considered to evaluate data quality: item infit and outfit statistics and Rasch reliability. First, we examined infit values, where a range of 0·7–1·3 indicated an adequate fit to the Rasch model(Reference Cafiero, Viviani and Nord25). Values between 1·3 and 1·5, though slightly outside this range, were still considered usable but were flagged for closer scrutiny in future surveys as suggested by Cafiero et al. (Reference Cafiero, Nord and Viviani32). Outfit statistics, which were sensitive to cases with unexpected response patterns, were used to identify outliers, with values above 2 indicating potential misfit. Finally, Rasch reliability was assessed, with values above 0·7 deemed acceptable(31).
To produce globally comparable FI prevalence rates, we equated the data to the FIES global standard scale using the FIES App (https://fies.shinyapps.io/ExtendedApp/, last accessed: 21.11.2024). All complete cases were used to obtain prevalence rates (Table 2). For each country, we initially considered all items as common. We then systematically omitted one item at a time, starting with the item that exceeded the set tolerance level of 0·35 the most (considered ‘unique’)(Reference Cafiero, Nord and Viviani32). This process continued until all items were within the set tolerance(Reference Onori, Viviani, Brutti, Brentari, Chiodi and Wit33).
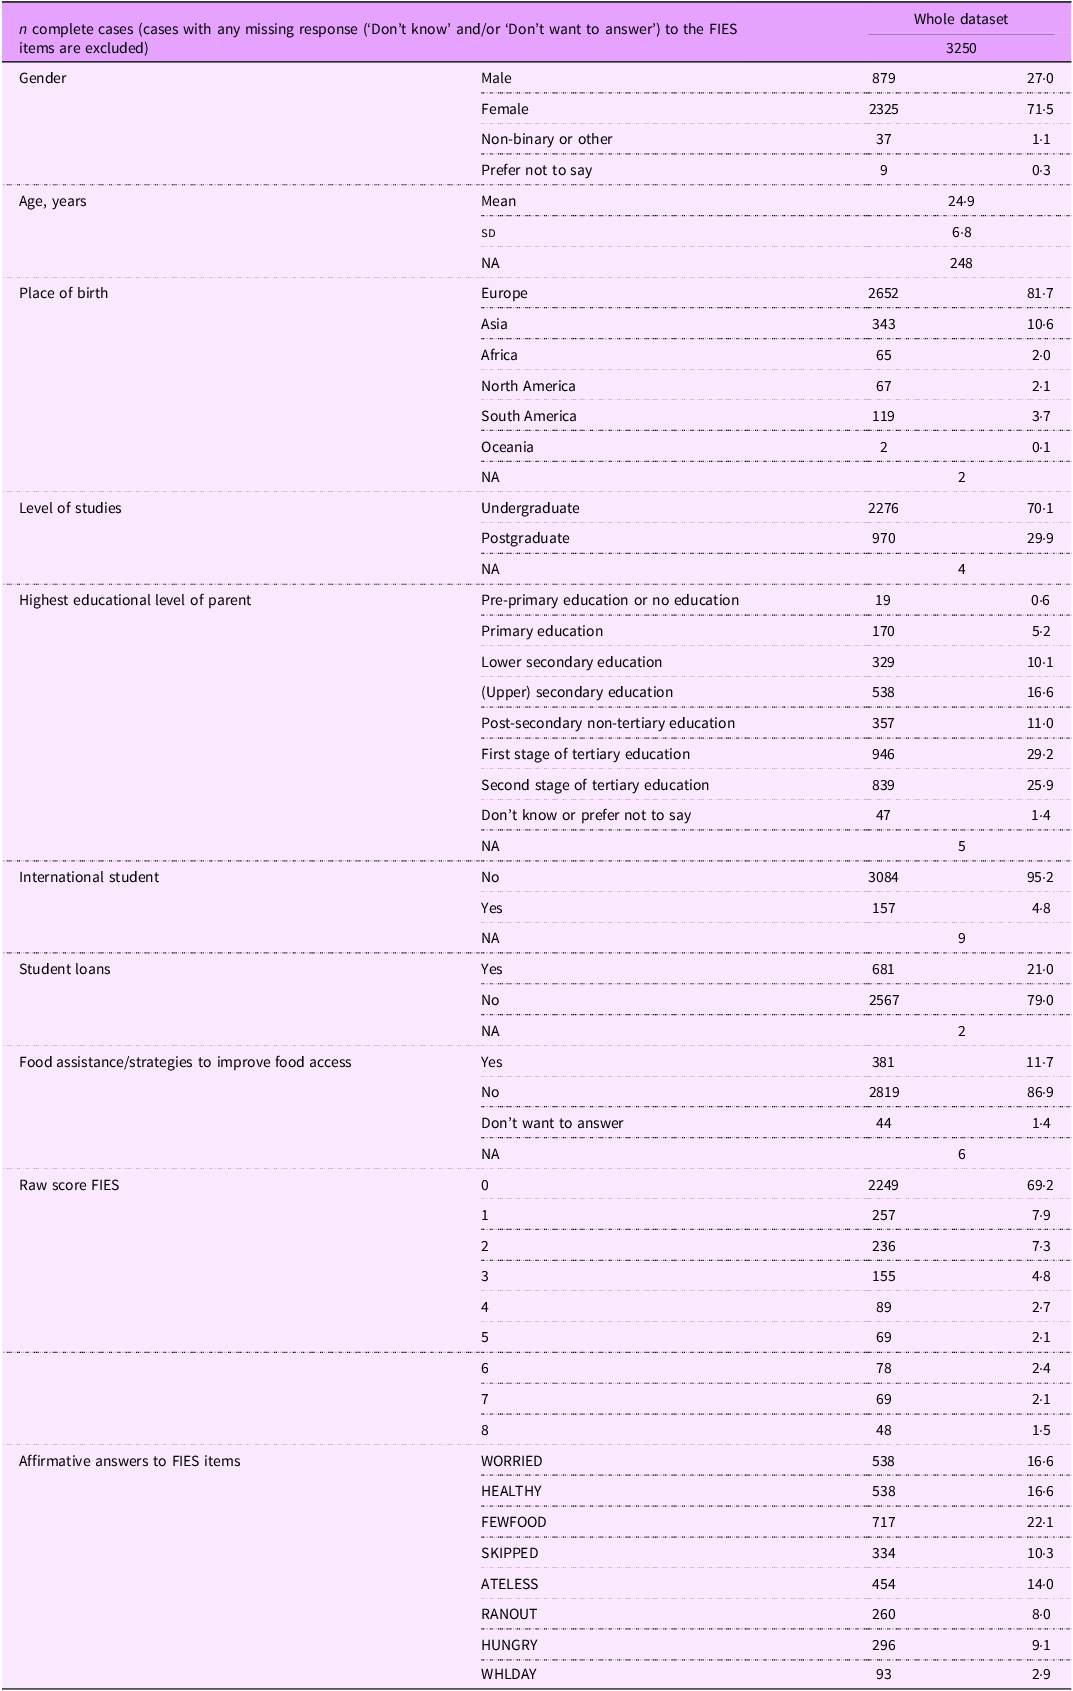
Participant’s demographic, socio-economic and educational characteristics and additional FIES information for complete cases of the whole dataset
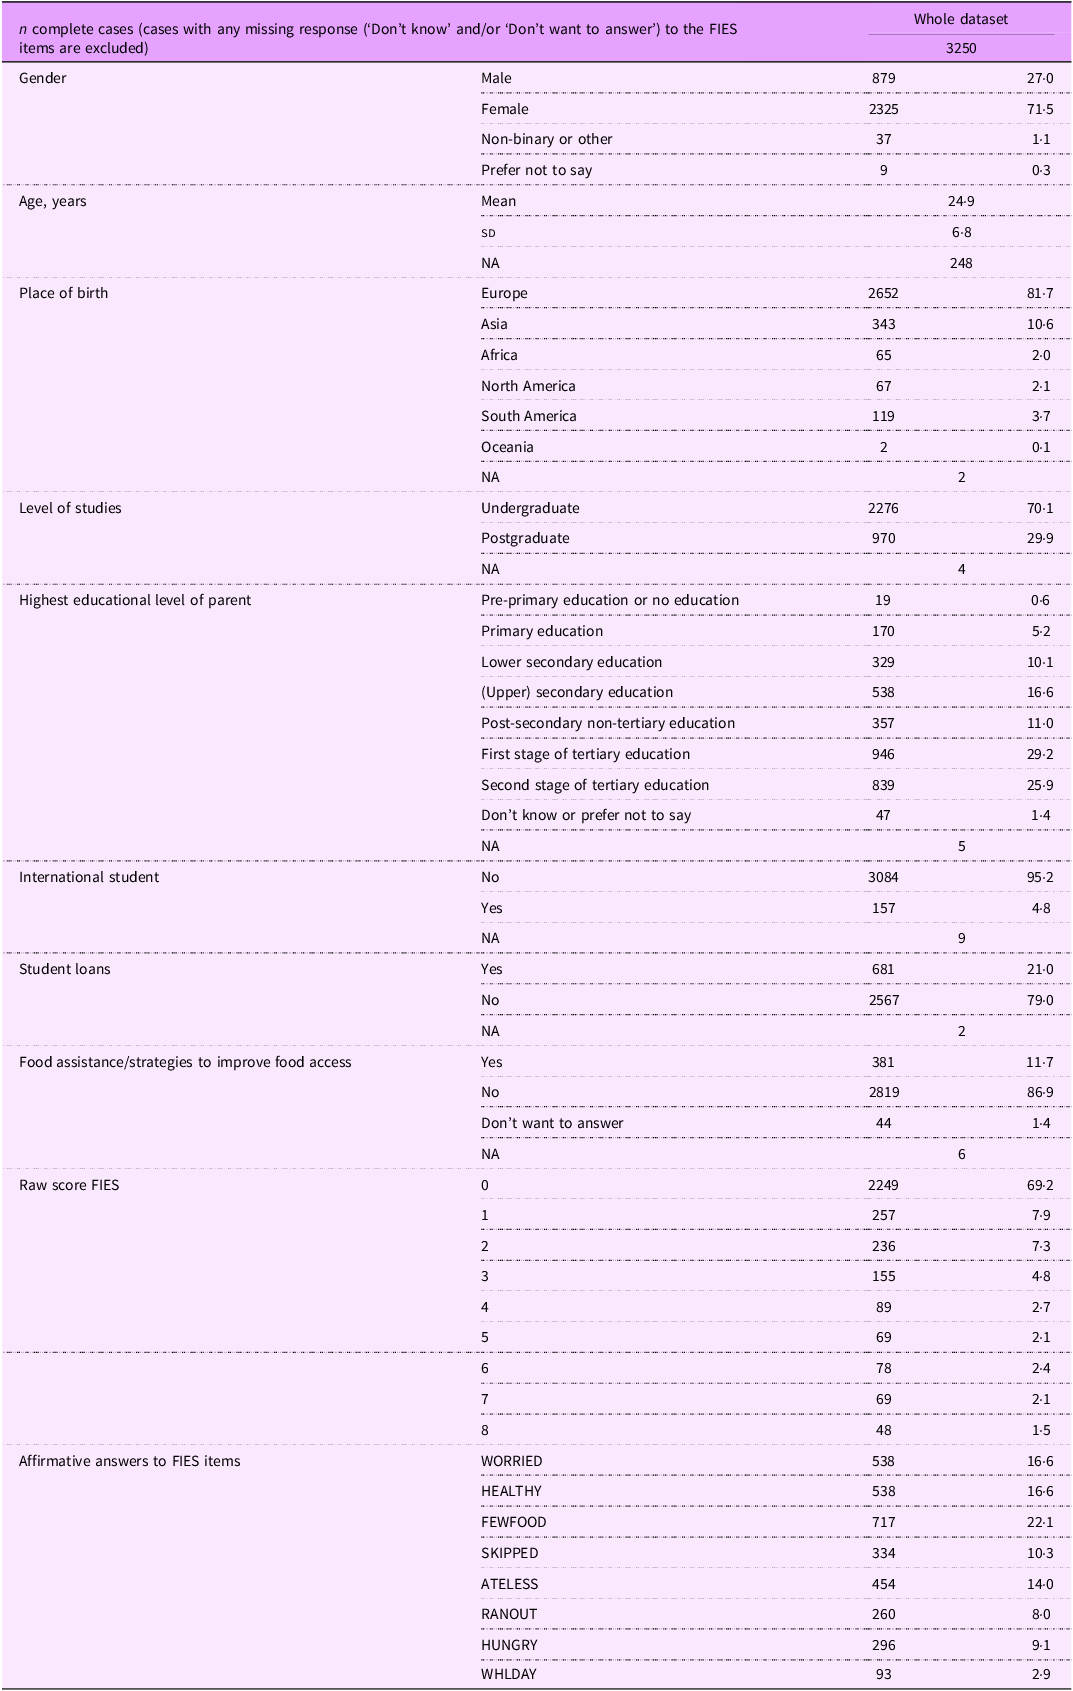
FIES, Food Insecurity Experience Scale; NA, not available.
When uploading the Finnish and Italian datasets, the FIES App returned the error: ‘Error: An error has occurred. Check your logs or contact the app author for clarification.’ To resolve this issue, we consulted with the FAO team, who advised that combining datasets with the lowest number of complete, non-extreme cases would allow the equating procedure to proceed. Following this guidance, we combined the three datasets with the lowest number of complete, non-extreme cases (Norway – OsloMet, Finland – UEF and Italy – Università Cattolica del Sacro Cuore) for the equating procedure.
To analyse the factors being associated with FI across multiple countries, logistic regression was applied. FI was represented as a binary variable, with two thresholds used to capture varying levels of FI: Threshold 1: A raw score of 1 or higher, indicating any level of FI, compared to a score of 0. Threshold 2: A raw score of 4 or higher compared to scores of 0–3, distinguishing moderate or severe FI (FImod + sev) from food-secure or mildly food-insecure conditions. To address potential multicollinearity in the model, we evaluated the generalised variance inflation factor (GVIF) raised to the power of 1/(2 × DF), where DF denotes degrees of freedom. Following the approach of several publications(Reference Harris34,Reference Yin, Guo and Zhu35) , we applied the rule that GVIF1/(2 × DF) value exceeding 2 indicates the possible presence of multicollinearity.
The logistic regression models were used to identify factors associated with FI. The models included demographic (gender, age and place of birth), socio-economic (participation in food assistance programmes or other type of food assistance, having student loans and parents’ highest educational level) and educational variables (level of studies and international student status)(Reference Kötzsche, Teuber and Jordan11). Associations were estimated while controlling for fixed effects to adjust for contextual differences between countries.
Results
Table 2 presents descriptive statistics for the overall dataset, including all participating universities, while results stratified by university can be found in online supplementary material, Supplemental Table 2. Across all universities, most respondents were female, and undergraduate students outnumbered postgraduate students. The overall mean age was 24·9 ± 6·8 years. Regarding the distribution of affirmative answers to each FIES item, the item FEWFOOD was reported most often among respondents across all countries, with the exception of Portugal, where the item WORRIED was answered more frequently with ‘Yes’. Not eating for a whole day (WHLDAY) was chosen the least in eight out of the nine countries.
Statistical validation
After excluding cases with missing responses (‘Don’t know’ and/or ‘Don’t want to answer’) to any of the FIES items, as well as cases with an extreme raw score of 0 or 8, the number of complete, non-extreme cases across the nine participating countries ranged from 39 to 184 (see online supplementary material, Supplemental Table 2). OsloMet (Norway), UEF (Finland), EHU (Spain) and Università Cattolica del Sacro Cuore (Italy) had less than 100 complete, non-extreme cases, which was insufficient for a robust statistical validation. The other countries had between 100 and 299 complete, non-extreme cases, which allowed a provisional statistical validation.
Item infit and outfit statistics
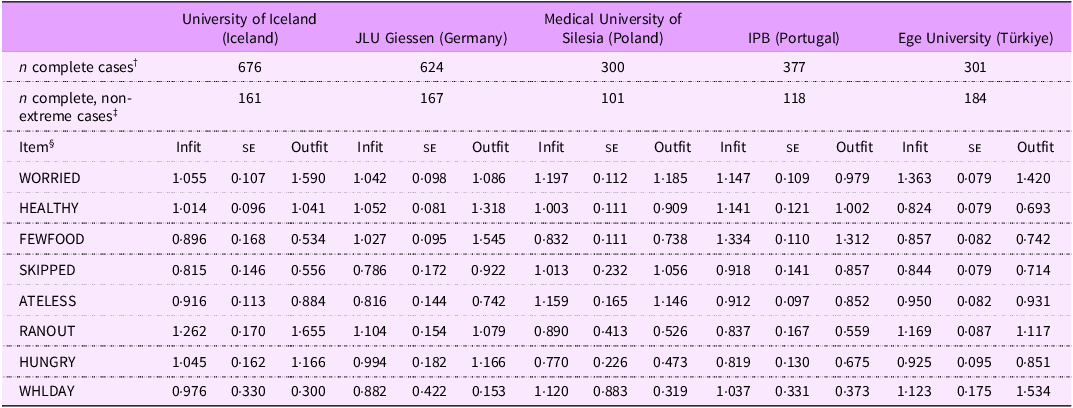
As shown in Table 3, the majority of the infit values fell within the acceptable range of 0·7–1·3. Only two items had infit values slightly above 1·3, yet still below 1·5. All outfit statistics were below the threshold of 2.
Item infit and outfit statistics for five datasets in the FINESCOP project *
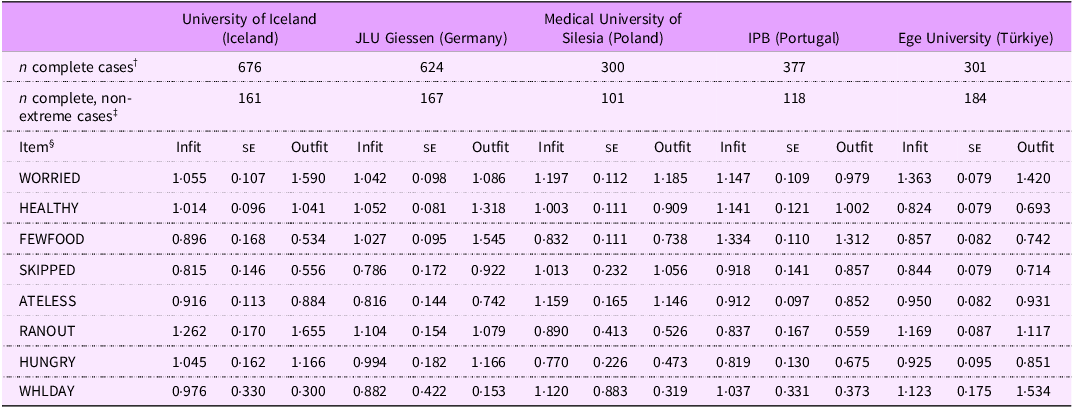
FINESCOP, Food Insecurity among European University Students during the COVID-19 Pandemic; JLU, Justus Liebig University; IPB, Polytechnic Institute of Bragança; FIES, Food Insecurity Experience Scale.
* Datasets from Oslo Metropolitan University (Norway; n complete cases: 181; n complete, non-extreme cases: 55), the University of Eastern Finland (Finland; n complete cases: 110; n complete, non-extreme cases: 39), the University of the Basque Country (Spain; n complete cases: 391; n complete, non-extreme cases: 82) and Università Cattolica del Sacro Cuore (Italy; n complete cases: 290; n complete, non-extreme cases: 46) were excluded, following guidelines, as they contained less than 100 complete, non-extreme cases and were therefore too small to provide reliable statistical validation.
† Cases with any missing response (‘Don’t know’ and/or ‘Don’t want to answer’) to the FIES items are excluded.
‡ Cases with any missing response (‘Don’t know’ and/or ‘Don’t want to answer’) to the FIES items and cases with an extreme raw score of 0 or 8 are excluded.
§ See Table 1 for the complete wording of the FIES questions, referring to a 12-month period.
Rasch reliability
Rasch reliability scores across all countries ranged between 0·7 and 0·8, as shown in Table 4. This indicates a good overall model fit, with the lowest reliability score being 0·71 and the highest 0·79. It should be remembered that values greater than 0·7 are considered acceptable(31).
Rasch reliability for five datasets in the FINESCOP project *

FINESCOP, Food Insecurity among European University Students during the COVID-19 Pandemic; JLU, Justus Liebig University; IPB, Polytechnic Institute of Bragança; FIES, Food Insecurity Experience Scale.
* Datasets from Oslo Metropolitan University (Norway; n complete cases: 181; n complete, non-extreme cases: 55), the University of Eastern Finland (Finland; n complete cases: 110; n complete, non-extreme cases: 39), the University of the Basque Country (Spain; n complete cases: 391; n complete, non-extreme cases: 82) and Università Cattolica del Sacro Cuore (Italy; n complete cases: 290; n complete, non-extreme cases: 46) were excluded, following guidelines, as they contained less than 100 complete, non-extreme cases and were therefore too small to provide reliable statistical validation.
† Cases with any missing response (‘Don’t know’ and/or ‘Don’t want to answer’) to the FIES items are excluded.
‡ Cases with any missing response (‘Don’t know’ and/or ‘Don’t want to answer’) to the FIES items and cases with an extreme raw score of 0 or 8 are excluded.
Equating procedure
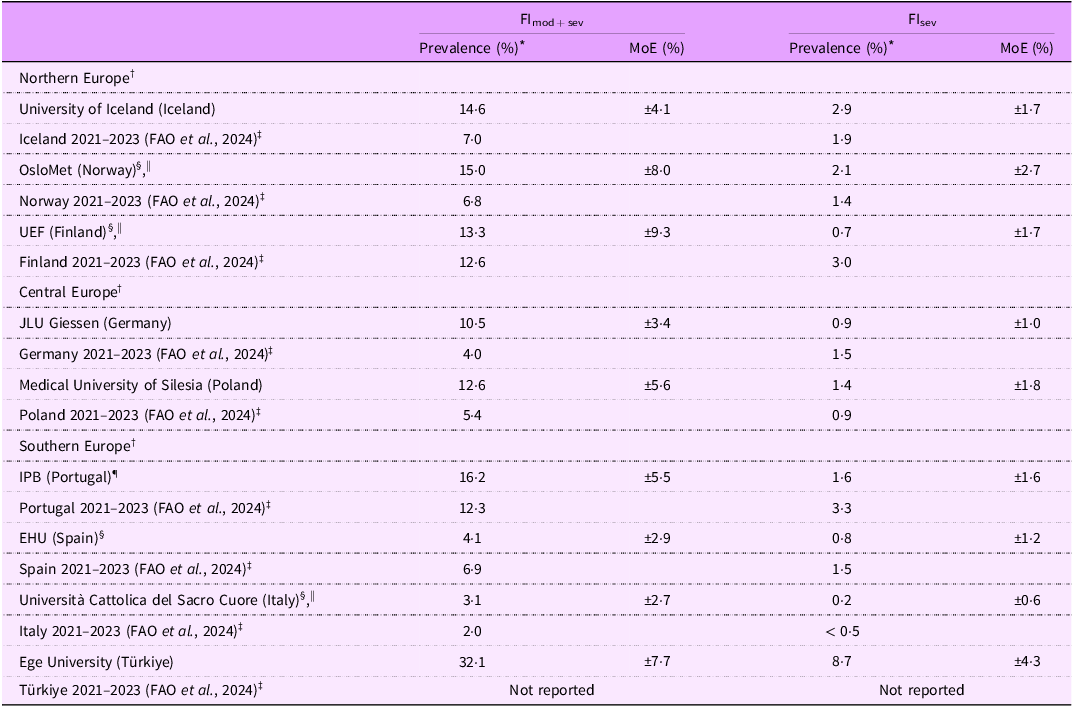
The equating procedure was conducted separately for each country, and Table 5 provides a comprehensive overview of the calculated prevalence rates (FImod + sev and FIsev) for the nine countries involved in the FINESCOP project. While cases with extreme raw scores were excluded for statistical validation, they were included when calculating FI prevalence estimates(31). Due to the low number of complete, non-extreme cases, the datasets from Norway (OsloMet), Finland (UEF) and Italy (Università Cattolica del Sacro Cuore) were combined for equating. Two items – WORRIED and HUNGRY – were considered unique, resulting in the following prevalence rates:
-
• Norway (OsloMet): FImod + sev 15·0 %, FIsev 2·1%
-
• Finland (UEF): FImod + sev 13·3 %, FIsev 0·7 %
-
• Italy (Università Cattolica del Sacro Cuore): FImod + sev 3·1 %, FIsev 0·2 %
Prevalence of moderate or severe (FImod + sev) and severe food insecurity (FIsev) among university students in the FINESCOP project compared to national averages of the total population (2021–2023(3))

FImod + sev, moderate or severe food insecurity; FIsev, severe food insecurity; FINESCOP, Food Insecurity among European University Students during the COVID-19 Pandemic; MoE, margin of error at 90 % confidence; OsloMet, Oslo Metropolitan University; UEF, University of Eastern Finland; JLU, Justus Liebig University; IPB, Polytechnic Institute of Bragança; EHU, University of the Basque Country.
* Prevalence is the estimated percentage of university students/individuals who are food insecure.
† European regions, by Ständiger Ausschuss für geographische Namen (StAGN).
‡ Three-year averages for total population; source: FAO, IFAD, UNICEF, WFP and WHO (2024). The State of Food Security and Nutrition in the World 2024. Financing to end hunger, food insecurity and malnutrition in all its forms. Rome, FAO. https://doi.org/10.4060/cd1254en.
§ The datasets had less than 100 complete, non-extreme cases, insufficient to provide reliable statistical validation. The estimates presented should be revised in the future, when more valid cases are available.
|| The datasets from Norway, Finland and Italy were combined for the equating procedure.
¶ The equating procedure led to four unique and four common items. Since at least five common items are obligatory, we compared different equating scenarios and decided to keep a set of five common items, even though one item’s severity was slightly above the set tolerance level. We consider the prevalence rates as valid, since the alternative combination of items generated essentially similar prevalence rates.
Other countries were equated individually:
-
• Iceland (University of Iceland): WORRIED unique; FImod + sev 14·6 %, FIsev 2·9 %, correlation of 98·1 % between the common items
-
• Germany (JLU Giessen): WORRIED and ATELESS unique; FImod + sev 10·5 %, FIsev 0·9 %, correlation of 99·0 % between the common items
-
• Poland (Medical University of Silesia): HUNGRY, RANOUT and WORRIED unique; FImod + sev 12·6 %, FIsev 1·4 %, correlation of 99·6 % between the common items
-
• Portugal (IPB): Initially, four items – FEWFOOD, HEALTHY, HUNGRY and ATELESS – were identified as unique, leaving only four common items. Since the minimum requirement is at least five common items, we evaluated alternative sets of items for equating. We ultimately decided to retain ATELESS as a common item, as the absolute difference before omitting it was 0·37, only slightly above the threshold of 0·35. The prevalence rates were comparable whether ATELESS was considered common or unique: 16·2 % v. 14·4 % for FImod + sev and 1·6 % v. 1·6 % for FIsev. The correlation between the common items was 97·6 %.
-
• Spain (EHU): ATELESS, HUNGRY and FEWFOOD unique; FImod + sev 4·1 %, FIsev 0·8 %, correlation of 98·1 % between the common items
-
• Türkiye (Ege University): SKIPPED, RANOUT and HUNGRY unique, FImod + sev 32·1 %, FIsev 8·7 %, correlation of 99·3 % between the common items
Adjusted thresholds of FI on the latent trait for moderate or severe and severe FI are presented separately for each country in online supplementary material, Supplemental Table 2.
Factors associated with food insecurity
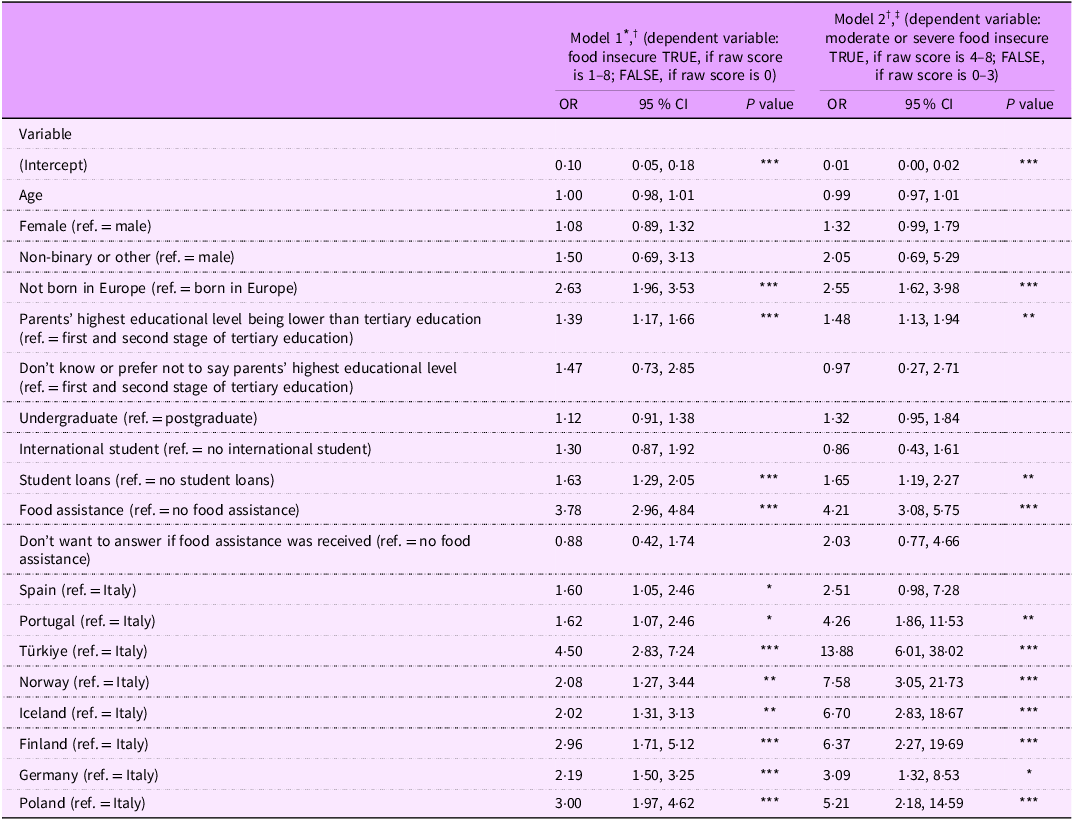
The logistic regression results show that compared to those born in Europe, individuals born outside of Europe are statistically significantly associated with a higher likelihood of FI in model 1 and 2. In addition, having parents with an educational attainment below the tertiary level (reference: first and second stage of tertiary education), reliance on student loans (reference: no student loans) and receiving food assistance (reference: no food assistance) were all significantly associated with higher odds of FI in both models (Table 6). All GVIF1/(2 × DF) values were below 2, suggesting that the variables in the model were not highly correlated.
Results of a logistic regression analysis with food insecurity as a binary dependent variable (n 2977)

Table 6. Long description
A table with logistic regression results for factors associated with food insecurity. The table has 18 rows and 10 columns. Column headers are Variable, OR, 95% CI, P value for Model 1, OR, 95% CI, and P value for Model 2. Row labels include variables such as Age, Female, Non-binary or other, Not born in Europe, Parents' highest educational level being lower than tertiary education, Don't know or prefer not to say parents' highest educational level, Undergraduate, International student, Student loans, Food assistance, Don't want to answer if food assistance was received, and country-specific references. Each row provides the odds ratio (OR), 95% confidence interval (CI), and P value for each variable in both models. Notable trends include higher odds of food insecurity for individuals not born in Europe, those with parents having lower educational levels, those relying on student loans, and those receiving food assistance.
Significance codes: ***P < 0·001, **P < 0·01, *P < 0·05.
* Cox & Snell R2: 0·136; Nagelkerke R2: 0·192. Model 1 satisfied the Omnibus Test of Model Coefficients (P < 0·001).
† 273 observations were excluded due to missing answers.
‡ Cox & Snell R2: 0·111; Nagelkerke R2: 0·226. Model 2 satisfied the Omnibus Test of Model Coefficients (P < 0·001).
Discussion and conclusions
The FINESCOP study offers valuable insights into the prevalence and nature of FI among university students in nine European countries during the COVID-19 pandemic. The findings highlight significant variation in FI levels across countries, underscoring both shared challenges and unique, country-specific issues.
The study reveals that FI is a pressing concern among university students, with notable disparities across the participating countries. For instance, the prevalence of FImod + sev ranged from 3·1 % at an Italian university to 32·1 % at a Turkish university, suggesting that regional factors, such as economic conditions, social welfare policies and cost of living, significantly impact students’ access to food. These findings align with previous research indicating that FI is a complex issue shaped by a combination of personal, institutional and societal factors(Reference Loofbourrow and Scherr14,Reference Richards, Stokes and Banna36,Reference Savoie-Roskos, Hood and Hagedorn-Hatfield37) . It should also be noted that the analysis of FI rates by region showed the greatest disparity in said rates in southern Europe.
Comparing the calculated prevalence rates of FImod + sev in our sample of university students with the 3-year averages (2021–2023) reported for the overall population by FAO et al. (3), we observe differences that underscore the unique challenges faced by the student population (Table 5). In seven of the nine participating universities, the prevalence rates of FImod + sev were higher than those reported in the overall population. Among the universities studied, Ege University in Türkiye shows the highest prevalence rates for both FImod + sev and FIsev. Specifically, FImod + sev at Ege University is 32·1 %, and FIsev is 8·7 %, which are higher than the European 3-year averages (2021–2023) of 7·8 % for FImod + sev and 1·8 % for FIsev (3). It is important to note that although Türkiye is included in our study, it is geographically located mainly in Western Asia, where the estimated prevalences of FI (FImod + sev: 38·9 %, FIsev: 13·5 %; 3-year averages 2021–2023) are higher than in Europe(3). Unfortunately, the FAO et al. (3) report does not provide specific data for Türkiye, limiting our ability to directly compare these findings with more detailed regional statistics.
In Türkiye, several socio-economic factors likely contributed to the high FI rate among the student population between 2021 and 2022. During the most severe phase of the COVID-19 pandemic, restrictions led to a sharp increase in unemployment(Reference Yüksel38). Many students who relied on part-time employment, especially in the retail and service sectors, lost their primary source of income. At the same time, overall household income levels declined markedly(Reference Caglayan Akay, Dumludag and Bulbul39), further limiting access to adequate food for students and their families. Additionally, a high inflation rate and rising living costs, particularly housing expenses, forced students to allocate a larger share of their budgets to housing, often at the expense of food, an effect which was also reported in Australia(Reference Kent, Visentin and Peterson13). In any case, our Türkiye’s results were in line with the reported rates of FI among students presented from other low- and middle-income countries but also high-income countries, including Lebanon (39 %)(Reference Itani, Mattar and Kharroubi15), USA (average rate of 32·9 %)(Reference Bruening, Argo and Payne-Sturges6) or Australia (42 % in 2022 and 53 % in 2024)(Reference Kent, Visentin and Peterson13), respectively.
Except for Spain, universities in the other countries exhibit higher FImod + sev values compared to the overall population, indicating that university students in these countries may be particularly vulnerable to FImod + sev. In the case of FIsev, higher values compared to the overall population are observed only in the universities from Iceland, Norway and Poland (Table 5). These findings suggest that in these countries, certain structural or societal factors may exacerbate the severity of FI among students.
While FI has typically been described in terms of broad demographic groups, based on age, race/ethnicity, household composition and residential characteristics(Reference Coleman-Jensen, Rabbitt and Gregory40), these types of categorisations fail to consider subgroups of people whose experiences may not be widely shared, and consequently, their situation is rendered invisible. In this sense, university students typically have several circumstances that make them vulnerable to FI, such as limited financial resources, lower purchasing power, disconnection from social safety nets(Reference Whatnall, Hutchesson and Patterson12,Reference Kent, Visentin and Peterson13) , and specifically during the COVID-19 pandemic, increased cost of living(Reference Whatnall, Hutchesson and Patterson12,Reference Kent, Visentin and Peterson13,Reference Russell, Head and Wolfe-Enslow41) as well as poor food literacy, a lack of budgeting skills and limited resources for healthy food preparation(Reference Clifford, Anderson and Auld42). In addition, university students are faced with independence with varying degrees of resource support from their families. Students from families with less access to resources may have a higher likelihood of lifelong consequences when faced with FI during college compared with those with more family resources(Reference Gaines, Robb and Knol18).
In any case, the demographic shifts in higher education, particularly among non-traditional students, have challenged the assumptions of most students being financially supported by their parents, enrolling immediately after high school and not having dependents(Reference Landry, Gundersen and Eicher-Miller43,Reference Brozina, Johri and Chew44) . Non-traditional students are often defined by age (e.g. mature-aged students)(Reference Brozina, Johri and Chew44). However, other criteria that also define non-traditional students include delayed enrolment, financial independence, full-time/part-time employment during enrolment, not having received a standard high school diploma, first-generation status, commuter status and under-represented status(Reference Brozina, Johri and Chew44).
The logistic regression analysis provides important insights into factors that are associated with FI among university students across countries. By categorising FI into two thresholds – any FI and FImod + sev – the analysis captures varying degrees of FI and highlights key factors that are associated with students’ vulnerability. A key finding is that not being born in Europe is significantly associated with a higher likelihood of FI across both thresholds. Previous studies from the USA have similarly reported that the birthplace is a predictor of FI(Reference Joseph, Feiner and Leung45). The parallels between our findings and US-based research suggest that birthplace may represent a broader structural correlate of FI among university students, though the mechanisms (e.g. migration status, access to financial and social support) warrant further investigation.
Another important finding is that students who receive food assistance have higher odds of FI, compared to those not receiving food assistance. At first glance, this seemingly counterintuitive finding may indicate that food assistance programmes are either insufficient to fully meet students’ needs or that they primarily reach those already experiencing severe financial distress. This interpretation aligns with existing literature that points out the limitations of food assistance programmes, which may provide short-term relief but fail to address the root causes of FI(Reference LeBlanc, Kuhn and Blaylock46). Alternatively, the association might reflect reverse causality: students already experiencing FI are more likely to seek food assistance. This highlights the need for future research on the design, targeting and effectiveness of such programmes. It is worth noting that only one of the nine participating universities, specifically IPB (Portugal), had a food bank for the most vulnerable students during the COVID-19 pandemic. In addition, two of the participating countries had regular government assistance to cover food-related expenses. In Finland, all students were eligible for a meal subsidy, and in Spain, those who do not reside in the family home and meet certain economic and academic requirements could apply for academic scholarships that included living costs such as food expenses. Thus, at most participating universities, students who received food assistance did so through parents, family or friends, and, to a lesser extent, through public social security institutions, foundations, municipal services or organisations (results not shown).
Consistent with previous studies(Reference Laska, Lenk and Lust47), our analysis also shows an association between student loans and FI. Furthermore, parents’ highest level of education was associated with any FI and FImod + sev, which is also in line with existing literature. Specifically, lower parental educational attainment, such as a high school degree or less, has been associated with a higher risk of FI(Reference Laska, Lenk and Lust47–Reference Leung, Insolera and Cohen50). For example, Itani et al. (Reference Itani, Mattar and Kharroubi15) showed that students in Lebanon whose mothers had higher education levels were less likely to experience FI.
Limitations, strengths and future directions
The use of the FIES in this study allowed for a standardised assessment of FI across diverse cultural and economic contexts. However, the statistical validation process revealed some limitations. In some countries (e.g. Spain, Norway, Finland and Italy), the number of complete, non-extreme cases was insufficient for a robust statistical validation, limiting the generalisability of the findings for these countries. The estimates presented for these datasets should be interpreted with caution and be revised in future research when a larger number of valid cases is available. Furthermore, it should be noted that while the FIES is standardised, further methodological innovations are needed to capture transient, student-specific FI experiences, such as food skipping before exams, or dependence on informal aid.
On the other hand, the data were self-reported and may be affected by recall and social desirability biases, but validated measures likely limited misclassification effects. In addition, the exclusive use of an online survey may have introduced sampling bias by potentially excluding students without reliable Internet access or those less comfortable with digital tools. However, since most university communication today is conducted via email and other digital platforms, most students are likely to have had access to the survey, reducing – but not fully eliminating – the risk of exclusion.
Furthermore, the timing of the survey during the COVID-19 pandemic likely influenced the results. The pandemic may have exacerbated FI, limiting the generalisability of the findings to non-pandemic periods. Notably, the Italian university was the only one where the survey remained open until mid-2023, which may have also impacted the results.
Finally, the performance of specific FIES items varied across contexts. For instance, the item FEWFOOD in the Portuguese dataset (IPB) had an infit value of 1·334, and the item WORRIED in the Turkish dataset (Ege University) had an infit value of 1·363. While these values were still below 1·5, they indicate a need for further refinement of the scale to ensure it accurately captures FI in different cultural settings in future studies.
Despite these limitations, the overall reliability of the FIES was confirmed, with most countries demonstrating adequate item infit and outfit statistics, alongside Rasch reliability scores that met or exceeded the acceptable threshold. These results support the use of the FIES as a valid and reliable tool for measuring FI in university populations, although future studies should consider larger sample sizes and further refinement of the tool to enhance its applicability in diverse settings.
When discussing the generalisability of the findings, it is important to consider the following points. While the inclusion of multiple countries provides a broad understanding of FI across different European contexts, the extent to which these specific universities represent the broader student population in each country or Europe as a whole is uncertain. In particular, the inclusion of a private university from Italy may introduce biases related to socio-economic status, as private institutions often serve students from different socio-economic backgrounds compared to public universities. However, it is important to distinguish between the prevalence rates of FI and the results from the logistic regression analysis. Regarding prevalence rates, we might expect an underestimation in the Italian sample compared to public universities, likely due to differences in socio-economic status. For instance, the descriptive statistics show that only a very small share of students in the Italian sample reported having student loans, in contrast to students at other universities.
At the same time, our logistic regression estimates are not biased or affected by this difference. Because we include country fixed effects, any systematic differences unique to Italy – whether arising from national context or the private nature of the institution – are fully captured by the Italy dummy variable. This ensures that within-country associations (e.g. gender, student loans and parental education) are estimated net of national or institutional context. Therefore, the private status of the Italian university does not bias our estimated associations for individual-level predictors, which are identified within each country. It is important to note, however, that since Italy is represented by a single private institution in our sample, we cannot separately estimate the effects of public v. private status within Italy. It also highlights an interesting avenue for future research: examining how FI prevalence and its determinants differ between public and private higher education institutions across Europe.
Due to the voluntary nature of survey participation, potential biases, such as selection bias, might have occurred. Addressing these issues in future research will be crucial for improving the accuracy and comparability of FI estimates across Europe. Continued evaluation and improvement of the FIES items, along with longitudinal studies, will be essential for enhancing the reliability and validity of FI measurements across diverse European settings.
Conclusions
In conclusion, this study highlights the pressing issue of FI among European university students, with differences in prevalence rates across different countries. The findings underscore the need for targeted interventions and policy responses to address the underlying causes of FI and to support students in achieving their academic and personal goals. As the global community continues to work towards the UN’s SDG 2, which aims to ensure food security for all, it is crucial to focus on vulnerable populations like university students. Future research should prioritise longitudinal studies to monitor changes in FI over time and to evaluate the effectiveness of specific interventions designed to reduce FI among students.
Supplementary material
For supplementary material/s referred to in this article, please visit https://doi.org/10.1017/S1368980026102894
Acknowledgements
The authors thank the participants enrolled in this survey for their participation. In addition, they are grateful to all the researchers of the Food Insecurity among European University Students during the COVID-19 Pandemic (FINESCOP) project. A full list of all FINESCOP study investigators can be found in the online supplementary material, Supplemental Appendix (A.1).
Financial support
This research was supported by the Vice Rectorate of Scientific and Social Development and Transfer of the EHU, funded by the contract programme formalised with the Basque Government (code of the Campus Bizia Lab project: 21ARRO, 22ARRO and 23ARRO). BIOMICs Research Group is supported by the Basque Government (No. IT1633–22). CIMO (UIDB/00690/2020 and UIDP/00690/2020) and SusTEC (LA/P/0007/2020) are supported by Portuguese national funds through the Foundation for Science and Technology (FCT, Portugal) FCT/MCTES (PIDDAC). Open Access funding provided by the EHU.
Competing interests
There are no conflicts of interest.
Authorship
Credit: All authors: Conceptualisation, Data curation, Funding acquisition (where applicable), Investigation, and Writing – review and editing; additionally: M.K.: Formal analysis, Methodology, and Writing – original draft; L.E.T.: Project administration; M.A-I.: Project administration.
Ethics of human subject participation
This study was conducted according to the guidelines laid down in the Declaration of Helsinki, and all procedures involving research study participants were approved by the ethics committees from the EHU (Ethics Committee for Research Involving Human Subjects of the EHU M10_2021_185), one of the coordinating universities, as well as from local committees of some participating universities (Research Ethics Committee for Public Higher Education Institutions in Iceland; JLU Giessen, Faculty Medicine, AZ 172/21; and Ethics Committee – Fondazione Policlinico Universitario Agostino Gemelli IRCCS, ID 4438). At the rest of the participating universities, the viability of developing the project was verified but was deemed as not eligible for consideration by the Ethical Committee because no personal data of the participants were recorded. Written informed consent was obtained from all subjects.
During the preparation of this work, the authors used ChatGPT in order to improve the readability and language of the manuscript. After using this tool, the authors reviewed and edited the content as needed and take full responsibility for the content of the published article.
Data availability
Data will be made available on request.



 Open access

