

Public health interventions aimed at improving food security are more successful and sustainable when multiple levels of influence (i.e. policy, systems and environment) are targeted simultaneously( 1 ). Multilevel interventions are currently underway using the Social Ecological Model (SEM)( Reference McLeroy, Bibeau and Steckler 2 ), a systems model for behavioural change cited by the US Department of Agriculture (USDA) and US Department of Health and Human Services in the 2015–2020 Dietary Guidelines for Americans( 3 ). The Dietary Guidelines for Americans recognize that all levels of society, including individuals and families, health educators and professionals, communities, organizations, businesses and policy makers, contribute to the food and physical activity environments in which people eat, live, learn, play and shop for food( 1 , 3 ). Evaluation of how specific factors from multiple levels of the SEM relate to changes in food insecurity, the limited or uncertain access to adequate food( Reference Anderson 4 ), will inform public health interventions in a variety of contexts where socio-economic and food access inadequacy persists( Reference Carter, Dubois and Tremblay 5 ).
Environmental exposures previously investigated for their influence on food security include urban/rural county classification, the food environment, transportation networks, socio-economics and community assistance resources( Reference Carter, Dubois and Tremblay 5 , Reference Jablonski, McFadden and Colpaart 6 ). Greater disparities in food access existed in rural compared with urban communities( Reference Dean and Sharkey 7 ); local food environment factors such as food availability, access and relative cost of food were associated with diet quality( Reference Penney, Brown and Maguire 8 ) as well as food security status( Reference Kirkpatrick and Tarasuk 9 – Reference Mayer, Hillier and Bachhuber 11 ). Modifying the food environment may be an effective strategy to improve nutritional and food security status( Reference Booth, Sallis and Ritenbaugh 12 , Reference Frieden 13 ). In addition, participants’ knowledge of community resources in combination with food-resource management skills were significantly protective against food insecurity( Reference Olson, Anderson and Kiss 14 ). Efforts to reduce food insecurity via nutrition assistance differ by geographic location and individual access( 15 ).
The Supplemental Nutrition Assistance Program-Education (SNAP-Ed) is a US federal nutrition education programme directed through the USDA Food and Nutrition Service. SNAP-Ed delivers multilevel SEM interventions with the goal of improving diet and physical activity to the low-income population that qualifies for the primary US federal nutrition assistance programme, the Supplemental Nutrition Assistance Program (SNAP). The programme goals for SNAP-Ed complement the goals of SNAP to improve food security( 1 ). A combination of educational strategies accompanied by environmental supports is delivered by SNAP-Ed to assist low-resource individuals to make healthy choices on a limited budget in accordance with the Dietary Guidelines for Americans and to provide the skills and knowledge that end the cycle of food insecurity. SNAP-Ed programmes are administered in each state across the USA and are required to implement interventions at the individual level of the SEM. This level of nutrition education intervention typically consists of a curriculum of nutrition education lessons delivered to participants and is referred to as ‘direct SNAP-Ed’. In addition to direct SNAP-Ed, nutrition education must be directed to the target population through at least one other level of the SEM to meet US federal guidance.
SNAP-Ed interventions applied across various SEM levels may be diverse but ideally optimize reinforcement at each of these levels. Over the past few years there has been an increased focus on impacting the policy, systems and environmental (PSE) sectors through novel evidence-based interventions, along with continued programming to impact the individual level through direct SNAP-Ed( 1 ). However, evaluation of PSE impacts has been a challenge due to the inherent complexity and diversity of PSE approaches and outcomes. An evaluation framework to determine effective multisector strategies is a current opportunity.
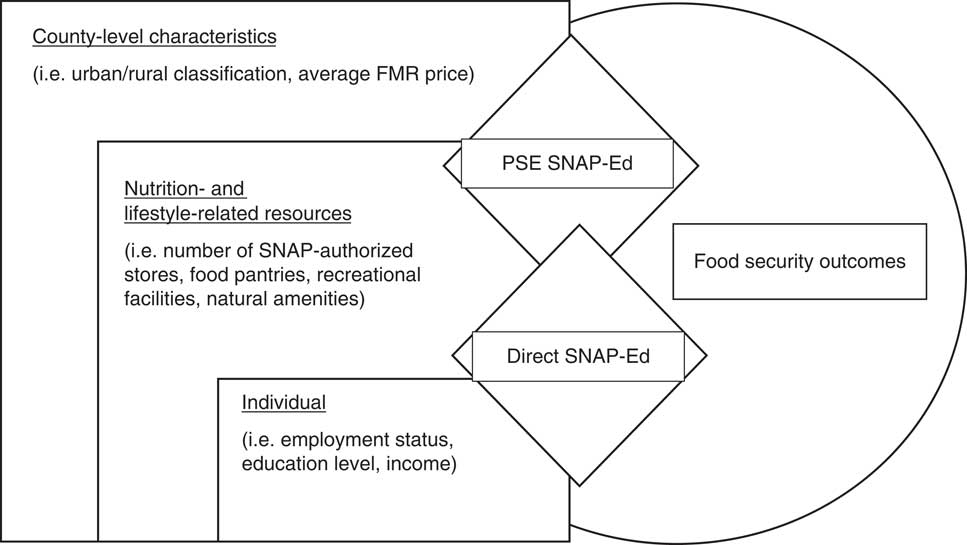
Figure 1 depicts the SEM framework used in the present study and illustrates the coordination of individual-level or direct SNAP-Ed and PSE SNAP-Ed interventions on the outcome of food security. The paraprofessionals who deliver individual-level SNAP-Ed create partnerships with community organizations such as food pantries and health clinics that offer resources or services at the environmental level to support skill-building and knowledge provided in the direct nutrition education lessons. Partnerships from the sectors of influence level may include local government, businesses, health-care agencies and Cooperative Extension. Policies implemented at this level influence the social and cultural norms and values level and encourage healthy living through improved access to healthy foods and physical activity. The SEM is the guiding framework for the exploratory study reported here, focusing on the interaction of SNAP-Ed at the individual level (represented by direct SNAP-Ed) and the environmental level.
A Social Ecological Model (SEM) for influencing food security outcomes through Supplemental Nutrition Assistance Program-Education (SNAP-Ed). Nutrition-related behaviours encouraged by direct SNAP-Ed consisting of nutrition and resource management education delivered at the individual level are supported by policy, systems and environmental (PSE) SNAP-Ed interventions at the environmental, sectors of influence and social and cultural norms levels of the SEM to improve food security outcomes in low-resource populations across the USA (FMR, fair market rental). (Adapted from https://snaped.fns.usda.gov/sites/default/files/uploads/SNAP-EdEvaluationFrameworkInterpretiveGuide.PDF)
Although the environment is recognized to play a key role in SNAP-Ed interventions, the influence of environmental factors such as urban/rural county classification, county characteristics and community resources on the efficacy of direct SNAP-Ed has not yet been evaluated. The higher prevalence of US food insecurity in non-metropolitan (rural) areas (15·4 %) compared with suburban (10·4 %) and principal cities of metropolitan (urban) areas (14·1 %) highlights the need to evaluate environmental influences on the success of SNAP-Ed interventions( Reference Coleman-Jensen, Rabbitt and Gregory 16 ). Fewer community resources in rural areas compared with urban areas to support and reinforce direct SNAP-Ed may make economizing food dollars and improving dietary intake more difficult. However, it is also possible that SNAP-Ed may be more impactful in rural locations where it is one of the few resources influencing dietary behaviour.
Poor nutrition and negative health outcomes associated with food insecurity, coupled with a 16·5 % national food insecurity prevalence among US households with children, demonstrate the urgency to increase the effectiveness of current food security interventions( Reference Coleman-Jensen, Rabbitt and Gregory 16 ). Populations most at risk include the low-income, single-parent households headed by women and households with children( Reference Coleman-Jensen, Rabbitt and Gregory 16 ). Food insecurity among children is particularly concerning due to the potential for long-lasting negative health and developmental outcomes( Reference Eicher-Miller, Mason and Weaver 17 – Reference Alaimo, Olson and Frongillo 21 ).
Results from two randomized and controlled SNAP-Ed interventions provide strong support for the ability of direct SNAP-Ed to reduce food insecurity. However, the potential contribution of environmental factors to the efficacy of direct SNAP-Ed was not considered in these foundational studies( Reference Eicher-Miller, Mason and Abbott 22 , Reference Rivera, Maulding and Abbott 23 ). A continuing need exists for studies with the capability to produce robust results that can be used to inform policy, funding and programming. The objective of the study presented here was to explore whether environmental factors (i.e. county-level characteristics and availability of nutrition- and lifestyle-related resources) were associated with improvement in household food security after a direct SNAP-Ed intervention, to lay a foundation for future research on the effect of environmental factors through direct SNAP-Ed interventions on food security.
Methods
All data analysed in the present exploratory study were secondary data. Food security score at the household level, measured using the eighteen-item US Household Food Security Survey Module( 24 ) with a 12-month reference period, from 328 eligible participants (control, n 163; intervention, n 165) was the dependent variable. Outcome data were obtained from a longitudinal randomized and controlled nutrition education study using direct SNAP-Ed as the intervention. The study was carried out from August 2013 through April 2015 in Indiana households with children. The CONSORT (Consolidated Standards of Reporting Trials) 2010 checklist and reporting procedures were followed for food security outcome data because of the randomized, controlled study design( Reference Rivera, Maulding and Abbott 23 ).
The intervention consisted of the first four lessons of the Indiana adult SNAP-Ed direct education curriculum, including: teaching concepts of how to use USDA MyPlate guidelines to design a nutrient-dense and balanced meal; how to use food labels to choose healthy foods; and the health benefits of breakfast, whole grains, fibre, fruits and vegetables. All lessons incorporated content on how to make healthy choices on a limited budget.
Participant characteristics (employment status, education level, income, etc.) and food security data were collected via survey at baseline and 1 year after the intervention. The detailed methodology is described elsewhere( Reference Rivera, Maulding and Abbott 23 ). County-level environmental data were analysed as an independent variable in the current study and were obtained from publicly available sources from years 2012 to 2016. Data sets matching exact years of the SNAP-Ed study period were not available( 25 – 29 ).
Environmental factors
County-level characteristics
Urban/rural county classification was assigned as a two-level categorical variable (1=urban, 2=rural) using classifications provided by the US Office of Management and Budget from the 2000 US Census Bureau Current Lists of Metropolitan and Micropolitan Statistical Area and Delineations( 25 ). A total of thirty-seven Indiana counties were included: seventeen urban and twenty rural. Data from the 2015 index of natural amenities was used for analysis. The index of natural amenities constructed by the USDA Economic Research Service’s Food Environment Atlas provides a ranked score from 1 to 6 to categorize a county’s natural areas with varied topography (1=lowest and 6=highest amenity rank)( 26 ). Average fair market rental (FMR) price, the amount of money that a given US property would command if it were available for lease, was classified as a continuous variable and included the average 2015 FMR price based on a two-bedroom home in each county. These data were obtained from the US Department of Housing and Urban Development Fiscal Year 2015 Fair Market Rents Data Set( 27 ).
Nutrition- and lifestyle-related resources
US federal, state, community and non-governmental organizations provide nutrition- and lifestyle-related resources through strategies such as providing qualifying households with vouchers to purchase foods via the federal SNAP at local authorized stores; partnerships between community, state and federal organizations to supply foods to emergency food outlets; and federal, state and community efforts to create and maintain local recreational facilities. Metrics to quantify these resources were identified and are described here. The average monthly number of stores per county authorized to accept SNAP benefits in 2014 was obtained from the USDA Food and Nutrition Service in March 2016 and included supermarkets, grocery and convenience stores, superstores and supercentres, warehouse club stores and specialized food stores( 28 ). The number of food pantries per county was obtained from the Indiana Emergency Food Resource Network Database in April 2016( 29 ). The number of recreational facilities per county was obtained from the USDA Economic Research Service’s Food Environment Atlas and defined by the NAICS (North American Industry Classification System) code 713940 as establishments primarily engaged in recreational fitness and sports activities( 26 ). Nutrition- and lifestyle-related resources were classified as continuous variables.
Data analysis
Chi-square and t-test analyses were used to compare the distributions of participant characteristics and environmental factors (including county-level characteristics and nutrition- and lifestyle-related resources described above) among the intervention and the control groups (data not shown) to evaluate the success of the participant household-level randomization. Most counties had a mix of participants from both treatment groups, except three counties with only control group participants and two counties with only intervention group participants. Chi-square tests and t tests were also used to compare urban and rural participant households (Table 1) by the other environmental factors to determine whether access to these resources was different for urban and rural households. Separate linear mixed-effect regression models using SAS PROC MIXED determined the association of each environmental factor with improvement in food security from baseline compared with 1 year after the intervention period between the direct SNAP-Ed intervention and the control groups (Table 2). This method accommodated the independent covariates of treatment group (a two-level categorical variable classifying the control and intervention groups) and time (a two-level categorical variable classifying the baseline and 1-year follow-up time periods) and the random covariate of participant inclusion, while testing the interactions of each of the environmental factor covariates with treatment group and controlling for participant and household characteristics. These potential confounders were identified when their distributions varied among the treatment and control groups in the baseline χ 2 and t tests. Model structures were compared using the Bayesian Information Criterion to select the best model in terms of fit and simplicity. Model assumptions were checked by plotting predicted means against residuals through Q-Q plots and histograms. Scatterplots of intervention and control group baseline and follow-up measures (Fig. 2) were created using SAS PROC GPLOT to visualize the potential association of each environmental factor with food security score over the 1-year follow-up period within each treatment group. The intervention and control groups are represented by the regression lines in the scatterplots (Fig. 2). Interactions indicated by divergent regression lines represent a differential potential influence of the environmental factor between the treatment groups on food security score. Sensitivity analyses were performed to investigate the impact of extreme upper-range observations for variables characterizing the number of food pantries and the number of SNAP-authorized stores. Since evidence of an interaction remained after removing the extreme observations, all data points were retained (Fig. 2). Results were considered significant when P≤0·05. Post hoc statistical power analyses were calculated for each interaction of interest in the current pilot study using SAS PROC GLMPOWER and indicated that the probability to detect a difference of 1 unit on the food security scale due to the interaction of each investigated environmental factor by treatment group was 33 % for each model at the set significance level of α=0·05. All statistical analyses were performed using the statistical software package SAS version 9.4 and scatterplots were created using R Studio 1.0.153.
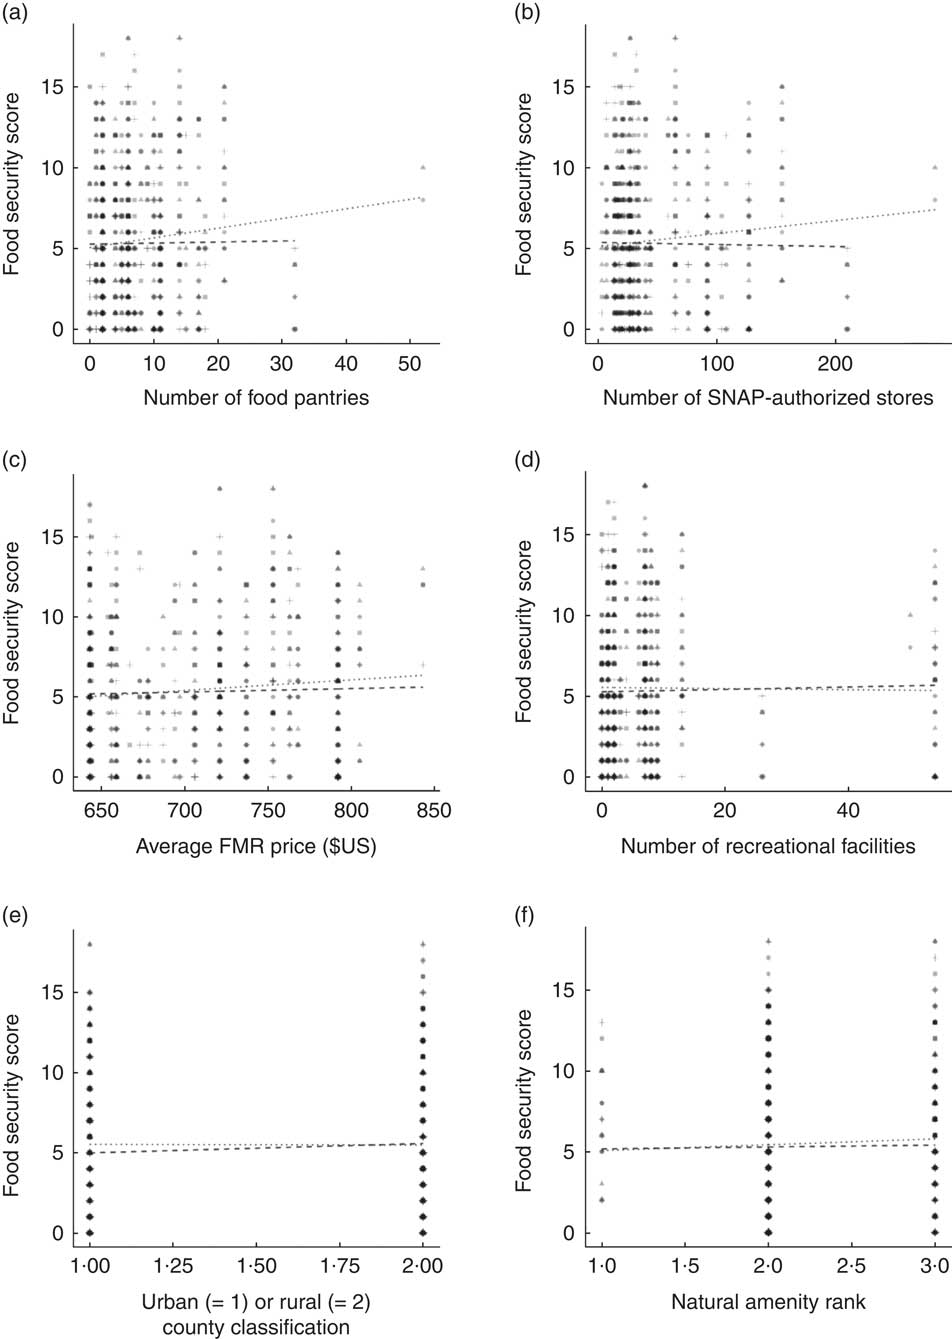
Scatterplots of food security score and environmental factors by treatment group. Scatterplots depict the relationship of the direct Supplemental Nutrition Assistance Program-Education (SNAP-Ed) intervention compared with the control group with the number of food pantries per county (a), the number of Supplemental Nutrition Assistance Program (SNAP)-authorized stores per county (b), the average fair market rental (FMR) price per county (c), the number of recreational facilities per county (d), urban or rural county classification (e) and the natural amenity rank of each county (f): ![]() , control time 1;
, control time 1; ![]() , control time 2;
, control time 2; ![]() , intervention time 1;
, intervention time 1; ![]() , intervention time 2. Extreme observations were removed in a sensitivity analysis for the analyses in (a) and (b) and since evidence of an interaction remained, all observations were retained. The y-axis represents mean household food security score. The x-axis represents the environmental factor noted in the x-axis title. The regression lines represent the association between the environmental factor and food security score within the control group (· · · · ·) and the intervention group (– – – – –); ‘time 1’ is the baseline assessment and ‘time 2’ is the 1-year follow-up assessment time point. The density of overlapping data points in the scatterplots is represented by the darkness of shapes. Divergent regression lines, or lines with different slopes that intersect at some point, represent a differential potential influence of the environmental factor on food security between the two treatment groups. A difference in slopes of regression lines indicates an interaction between the treatment group and the environmental variable of interest on the food security outcome. A food security score closer to 0 is associated with food security while a food security score approaching 18 is associated with lower food security
, intervention time 2. Extreme observations were removed in a sensitivity analysis for the analyses in (a) and (b) and since evidence of an interaction remained, all observations were retained. The y-axis represents mean household food security score. The x-axis represents the environmental factor noted in the x-axis title. The regression lines represent the association between the environmental factor and food security score within the control group (· · · · ·) and the intervention group (– – – – –); ‘time 1’ is the baseline assessment and ‘time 2’ is the 1-year follow-up assessment time point. The density of overlapping data points in the scatterplots is represented by the darkness of shapes. Divergent regression lines, or lines with different slopes that intersect at some point, represent a differential potential influence of the environmental factor on food security between the two treatment groups. A difference in slopes of regression lines indicates an interaction between the treatment group and the environmental variable of interest on the food security outcome. A food security score closer to 0 is associated with food security while a food security score approaching 18 is associated with lower food security
Comparisons (t tests, χ 2 tests) of county-level environmental factors by urban or rural county classification among counties in Indiana, USA with study participants, 2012–2016
SNAP, Supplemental Nutrition Assistance Program; FMR, fair market rental.
*Statistically significant (P≤0·05).
† Percentages do not always add to 100 due to rounding.
Type 3 tests of fixed effects in mixed multiple linear regression models of the association between county-level environmental factors and the change in household food security score in the direct Supplemental Nutrition Assistance Program-Education (SNAP-Ed) intervention group compared with control group participants from baseline to 1-year follow-up in Indiana, USA, 2012–2016
LS, least squares; SNAP, Supplemental Nutrition Assistance Program; FMR, fair market rental.
† All models were adjusted for household employment. Effects tested in the interaction with treatment group were county-level (n 37), and the household food security outcome was individual-level. Treatment was administered at the individual level (n 328). Differences in mean food security score are presented from the interaction of treatment group and time and differences in differences were calculated by 1-year follow-up subtracted from baseline.
‡ Natural amenity rank=3 was the reference group.
Results
The χ 2 and two-sample t-test comparisons of the distribution of environmental factors between treatment groups revealed that only the average FMR for a two-bedroom house was differentially distributed between treatment groups (data not shown). Comparisons by urban or rural county classification (Table 1) revealed significant differences for all environmental factors except number of food pantries, meaning that urban and rural counties included in the study had a similar mean number of food pantries regardless of urban or rural county classification. Urban counties had a significantly greater number of SNAP-authorized stores and recreational facilities, higher average FMR prices and higher natural amenity rank compared with rural counties. The χ 2 comparisons among baseline participant characteristics between treatment groups indicated that household employment and household nutrition assistance programme participation differed (data not shown). These comparisons are presented elsewhere along with results showing a statistically significant twofold long-term increase in mean household food security of the intervention group compared with the control group from baseline to 1-year follow-up after a direct SNAP-Ed intervention( Reference Rivera, Maulding and Abbott 23 ) (data not shown). Results from linear mixed regression modelling (Table 2) show that there was not sufficient statistical evidence to suggest that any of the environmental factors were significantly associated with improvement in mean food security score for the intervention group compared with the control group from baseline to 1-year follow-up among Indiana direct SNAP-Ed participant households with children. Further examination of the relationships of environmental factors that were present for households receiving the direct SNAP-Ed intervention or not regarding food security over the 1-year study period revealed little potential for urban or rural county status, natural amenities or the number of recreational facilities to be associated with the efficacy of the direct SNAP-Ed intervention (Fig. 2). However, the number of food pantries and SNAP-authorized stores along with FMR price tend to be inversely related to food security when present in the environment where direct SNAP-Ed interventions are delivered. Food security score improved in the intervention group as the number of food pantries and SNAP-authorized stores increased (Fig. 2(a) and (b)). The intervention group retained improved food security compared with the control group as FMR price increased (Fig. 2(c)).
Discussion
The present exploratory study was designed to investigate how researchers may begin to assess the relationship between environmental factors and individual-level nutrition education interventions. No significant associations were observed between the environmental factors investigated when taken with the direct SNAP-Ed intervention and the resulting improvement in food security among participants. Although the current exploratory study may not have had sufficient power to detect a significant statistical difference, the study methodology and results contribute a valuable foundation for future research.
Environmental factors have been an important consideration of US federal agencies in recent years, particularly urban/rural county classification. Nationally, food insecurity is more prevalent in rural areas compared with urban areas( Reference Mabli 30 ), yet the results of the present study provide no evidence that SNAP-Ed works differentially in rural compared with urban counties to improve food security (Table 2) despite significant differences in environmental factors between urban and rural counties (Table 1). The lack of a relationship between urban/rural county status and efficacy of direct SNAP-Ed (Fig. 2(e)) provides little evidence for a potential relationship between these factors to be discovered even in future, appropriately powered studies. The findings are similar to a report which found that SNAP participation significantly increased food security over a 6-month period non-differentially between rural and urban environments( Reference Mabli 30 ), suggesting that both SNAP and SNAP-Ed may have similar efficacy in rural and urban environments to improve food security over a long-term period.
The number of SNAP-authorized stores in a county where direct SNAP-Ed is delivered was not related to programme efficacy in the present study but should be further investigated with power to detect statistical significance. A non-significant interaction (Fig. 2(b)) indicates a trend of improved food security in the direct SNAP-Ed treatment group relative to the control group when more SNAP-authorized stores were present. The number of SNAP-authorized stores in a county encompassed a variety of types of local food outlets that accept SNAP benefits; more stores may provide more opportunities for low-income participants of direct SNAP-Ed to practise the nutrition education they received from the programme and improve healthy purchasing on a limited budget. Other factors such as distance to these stores, access to transportation and affordability may also influence the relationship of the number of SNAP-authorized stores with direct SNAP-Ed efficacy to improve food security. For example, proximity to a food outlet as well as stores that sell affordable and healthy foods was associated with increased self-reported fruit and vegetable intake and diet quality( Reference Dean and Sharkey 7 , Reference Lucan 31 ). It is plausible that access to affordable foods would have an association with the efficacy of direct SNAP-Ed. If the recommended food is out of reach due to financial constraints, there may be an upper limit beyond which improved environmental food access (i.e. the presence of suitable locally available foods) cannot improve food security( Reference Mayer, Hillier and Bachhuber 11 ). Therefore, future research should investigate the food environment related to food security including availability of affordable high-quality foods. These aspects of the food environment may have the potential to influence direct SNAP-Ed, particularly since food resource management, as well as identifying healthful foods using MyPlate and food labels, is a core part of the SNAP-Ed curriculum( 1 ).
A significant association between the number of food pantries per county where direct SNAP-Ed is delivered and participant improvement in food security (Table 2) was also not observed. The number of food pantries was the only county-level environmental factor that was not significantly differently distributed between urban and rural county settings (Table 1). Improvements in food security in both types of county settings after a direct SNAP-Ed intervention, and limited nutrition- and lifestyle-related resources in rural areas, suggest that food pantries in rural county settings may be especially influential to improve food security. Two Canadian studies failed to show that food pantry participation improved food security status( Reference Tarasuk and Beaton 32 , Reference Loopstra and Tarasuk 33 ), but the studies did not include a nutrition education intervention or take into account rural or urban environments. The scatterplot (Fig. 2(a)) revealed a non-significant trend that food security score may improve in the treatment group that received SNAP-Ed as the number of food pantries increased. The food assistance offered through food pantries may be impactful to food insecurity, however difficult to detect because of the very low food secure subgroup for whom this resource is likely to be most beneficial. Households may use food pantries only when food security is very low because food pantries are considered a last resort. Since the majority of the study population was marginally food secure( Reference Rivera, Maulding and Abbott 23 ), food pantries may not represent a significant supporting environmental resource of most participants receiving direct SNAP-Ed.
The number of recreational facilities and natural amenity ranking were hypothesized to support the decision to participate in physical activity, promote healthy lifestyles and, thus, improve food security when present with the direct SNAP-Ed intervention. The scatterplots (Fig. 2(d) and (f)) show no indication that the number of recreational facilities or natural amenity score in a county supports direct SNAP-Ed to improve food security. Recreational facilities and recreational opportunities through natural amenities were less directly related to SNAP-Ed and food security compared with other environmental resources. Questions remain regarding the role that recreational opportunities may play in the food environment. Natural amenities may provide lower-cost opportunities for physical activity, be more family friendly and promote an overall mindset of health in the community. Lack of a significant association of natural amenity rank with food security improvement might have been related to the study setting; the Indiana counties that were included received similar USDA Natural Amenity Index scores, and therefore few differences were observed in natural amenities between counties. Very little is known about the recreation of food-insecure families or how recreation may or may not change after direct SNAP-Ed participation.
Average FMR price was considered to have a potential impact on food security because paying higher housing prices may deplete resources that might have been appropriated for food, thus potentially reducing food security. Urban counties had a higher average FMR price compared with rural counties (Table 1), and the scatterplot (Fig. 2(c)) shows a direct relationship between increasing rental price and reduced food security regardless of treatment group. SNAP-Ed may be helpful to families living in both urban and rural county settings to increase their resource management skills to purchase healthy foods on a limited budget. However, SNAP-Ed improved food security in both urban and rural county settings despite differences in average FMR.
Results from the present study indicate that direct SNAP-Ed improves food security across a variety of environments, including rural counties with fewer of the supporting nutrition-related resources as compared with more affluent urban counties (Table 1). Unique aspects of SNAP-Ed may help explain this finding. Indiana SNAP-Ed paraprofessionals live in close proximity to the areas where they provide direct nutrition education, enabling them to tailor the curriculum and apply the nutrition and food-resource management education in their community context, and helping clients to navigate unique combinations of environmental resources. Additionally, Indiana SNAP-Ed paraprofessionals may collaborate with community organizations to improve the food and physical activity environments among low-income populations. The central roles of SNAP-Ed paraprofessionals include providing participants with nutrition information, such as shopping tips and recipes to economize food dollars and accommodate healthy choices on a limited budget; food safety education to enhance use of all food resources, avoid waste and maintain health; and information to optimize the use of local health-promoting resources such as natural amenities (i.e. walking trails). Direct SNAP-Ed delivered by paraprofessionals was shown to play a significant role in access to and utilization of food resources to improve food security regardless of community resources. Hence the relationship of the environment to the efficacy of direct SNAP-Ed is complex and likely interacts with the relationship of the SNAP-Ed paraprofessional with the participant.
A major strength of the present study is that household food security outcomes were derived from a longitudinal randomized and controlled intervention study. Furthermore, the longitudinal 1-year follow-up period is consistent with the Western Region’s SNAP-Ed evaluation framework( Reference Riesenberg 34 ), which recommends a 1-year minimum follow-up period in order to assess changes in outcome measures from multilevel SNAP-Ed approaches. Food security outcomes were measured in households with children, where food insecurity is known to be pervasive, validating SNAP-Ed interventions among a priority population at risk of food insecurity and related poor nutrition and negative health consequences. A second advantage is that the surveillance period of the environmental data was close to or covered the time period of the household food security outcome measurements( Reference Rivera, Maulding and Abbott 23 ). The environmental factors investigated were classified at the county level, where Indiana direct SNAP-Ed is implemented. Study results can be directly applied to inform and tailor best SNAP-Ed practices. Examples of such applications may be strengthening SNAP-Ed partnerships with food pantries in all counties and especially rural counties. Results (Table 1) indicated food pantries were one of the few environmental factors with non-differential reach in rural counties that also showed a potential relationship with SNAP-Ed efficacy. Direct SNAP-Ed recruitment and links to additional resources among food pantry clients may be a strategy to tailor SNAP-Ed to support improvements in food security for rural clients.
Environmental-factor data by county may be considered a limitation of the study due to defined environmental borders that may not fully reflect the available resources. Rural and urban environments are not confined to county lines, and individuals may utilize nutrition-related resources in counties other than where they received SNAP-Ed. The analysis may not truly reflect how the number and type of resources within a county impact the food security of study households with children. Limitations of investigating environmental factors include not directly measuring the factor, potential for missing data and the inability to account for all interactions and influences, including the indirect impact of the environmental factors, on the outcome.
The study providing food security outcome data was sufficiently powered; however, the research question and hypothesis in the current study require separate power needs. Future investigation of PSE factors on the efficacy of SNAP-Ed may require a sizeable study sample. An estimated sample size of 2240 was calculated post hoc to achieve 80 % power for the present study. Such a large sample size may not be financially feasible for a SNAP-Ed intervention or without collaboration across several states. Further state-wide evaluation data comparing regions with or without SNAP-Ed may be useful in such an endeavour. In addition to sample size, variation in the factors investigated across study units is important. For example, the scatterplot showing the influence of the number of food pantries in a county indicates a spread of zero to twenty food pantries for most participants; however, two outliers were apparent. A future study investigating a wider range in the number of food pantries may increase the likelihood to detect a difference in food security. Similarly, investigation of the availability of affordable nutrient-dense foods from a variety of different types of food outlets would advance knowledge. Intervention studies with a control or comparison group in addition to a long-term follow-up period will provide the strongest evidence.
Public health implications
The current findings demonstrate the impact and resiliency of SNAP-Ed to effect change across differing rural and urban environments. Expansion of direct SNAP-Ed in rural areas will enhance reach to a population at high risk for food insecurity and reduce the disparity of lower food security in rural areas. With an increased programmatic focus on PSE SNAP-Ed interventions, direct SNAP-Ed resources may be at risk of downsizing. Increasing collaborative efforts at local, state, regional and national levels through PSE interventions may promote a long-term positive SNAP-Ed impact and reach, and also support positive outcomes of direct SNAP-Ed; however, investment in direct SNAP-Ed should not be threatened due to its proven effectiveness. Further interdisciplinary investigation into PSE factors of the SEM are also warranted to better understand the relationship between environmental characteristics, SNAP-Ed PSE interventions, direct SNAP-Ed, and their impact on dietary behaviour and food security outcomes.
Acknowledgements
Acknowledgements: Authors thank Dr Bruce A. Craig, director of the Purdue Statistical Consulting Service, for contributing his expertise and time to this project. Financial support: This study was funded by grants from the North Central Nutrition Education Center of Excellence and the University of Kentucky Center for Poverty Research (UKCPR) through funding by the USDA Food and Nutrition Service (contract number AG-3198-S-12-0044). The opinions and conclusions expressed herein are solely those of the authors and should not be construed as representing the opinions or policies of the UKCPR or any agency of the Federal Government. The North Central Nutrition Education Center of Excellence and the UKCPR had no role in the design, analysis or writing of this article. Conflict of interest: None. Authorship: R.L.R., J.D. and H.A.E.-M. led in writing the content with substantial contributions from D.A.S., S.M.N.-R. and J.D. Q.W. and R.L.R. led the statistical analysis. R.L.R., M.K.M. and H.A.E.-M. led in the conceptualization and design of the project and interpretation of the data. All authors contributed to revising and approving the final manuscript. Ethics of human subject participation: This study was conducted according to the guidelines laid down in the Declaration of Helsinki and all procedures involving human subjects/patients were approved by the Purdue University Human Research Protection Program Institutional Review Board. Written informed consent was obtained from all subjects.


