

Primary school years (ages 6–11 years) have repeatedly been shown to be a critical period for the development of overweight and obesity( Reference von Kries, Reulen and Bayer 1 , Reference Nader, O'Brien and Houts 2 ). For example, the development of overweight in UK children is greatest between ages 7 and 11 years compared with those between ages 3 and 7 or 11 and 15 years( Reference Hughes, Sherriff and Lawlor 3 ). This might result from a significantly lower remission of both overweight and excess skinfold thickness during the primary school period than during the preschool period( Reference von Kries, Reulen and Bayer 1 ). Identification of factors driving this phenomenon is thus of public health relevance.
In addition to changes in both daily routine and physical activity of children, changes in nutritional behaviour have been discussed as an important factor for the development of overweight in primary school years. However, to date, prospective observational studies in children have identified only a few associations between foods or eating behaviours and subsequent changes in BMI( Reference Must, Barish and Bandini 4 , Reference Newby 5 ). This may reflect a focus on single nutrients( Reference Kranz, Brauchla and Slavin 6 , Reference Maffeis, Schutz and Grezzani 7 ) or single foods, e.g. sugar-sweetened beverages( Reference Must, Barish and Bandini 4 , Reference Ludwig, Peterson and Gortmaker 8 ). By contrast, dietary pattern analyses allow us to gain insights into the joint effects of multiple dietary components in the complex development of overweight( Reference Newby 5 ).
Until now, only a few studies( Reference Wosje, Khoury and Claytor 9 – Reference Cutler, Flood and Hannan 12 ) have analysed the prospective relationship between dietary patterns and weight status in children. For example, dietary patterns at age 7 years – but not at age 5 years – are predictive of fat mass at age 9 years among UK children( Reference Johnson, Mander and Jones 11 ). However, other studies( Reference Ritchie, Spector and Stevens 10 , Reference Cutler, Flood and Hannan 12 ) could not find consistent associations between dietary patterns and later body composition. This could in part be related to the fact that dietary patterns are not as entrenched as in adults( Reference Wall, Thompson and Robinson 13 ) and may be subject to changes during childhood( Reference Zive, Berry and Sallis 14 – Reference Bertheke Post, de Vente and Kemper 16 ). Hence, capturing changes in diet over the critical period of primary school may be of importance, since they may themselves be relevant to the development of body composition during this period.
Therefore, the aims of the present longitudinal study were to identify and describe dietary patterns at the beginning of the primary school period (ages 6 and 7 years) as well as patterns of dietary changes during the course of primary school (between ages 6 and 7 and ages 10 and 11 years) and to examine their relevance to changes in body composition during the primary school period. For this purpose, we used two different analytical approaches. The first approach was the principal component analysis (PCA), which was carried out to obtain dietary patterns explaining maximal variation in food intake, which were then regressed on changes in BMI and fat mass index (FMI) during primary school years. This approach has been widely used in the literature( Reference Song, Park and Paik 17 – Reference Craig, McNeill and Macdiarmid 19 ), but unfortunately the PCA does not necessarily yield dietary patterns that are predictors of health-related outcomes( Reference Hoffmann, Schulze and Schienkiewitz 20 ). Therefore, as the second approach, reduced rank regression (RRR) was employed. RRR is commonly applied to a set of intermediary response variables that are known to link diet to the outcome of interest; that is, this approach is not as purely explorative as PCA( Reference Hoffmann, Schulze and Schienkiewitz 20 ). However, in the Dortmund Nutritional and Longitudinally Designed (DONALD) Study, blood samples are collected only from adult participants, and current scientific evidence does not substantiate strong associations between specific nutrients and body composition development, which would make them obvious choices as intermediary variables. Therefore, in the present study, RRR was used to directly extract dietary patterns explaining maximal variation in changes in BMI and FMI between ages 6 and 7 years and ages 10 and 11 years; that is, we used this method in a purely explorative way.
Methods
Study population
The DONALD Study is an ongoing, open cohort study conducted in Dortmund, Germany. Details of the study protocol have been published elsewhere( Reference Kroke, Manz and Kersting 21 ). Briefly, since 1985, detailed information concerning diet, development, growth and metabolism between infancy and adulthood has been collected. Every year, thirty-five to forty infants of Caucasian descent are newly recruited from the city of Dortmund and surrounding communities and first examined at the age of 3 months. Each child returns for three more visits in the first year, two in the second year and then annually until early adulthood. The non-invasive examinations include the completion of a 3 d weighed dietary record, anthropometric measurements, interviews on lifestyle and a medical examination. The study was approved by the Ethics Committee of the University of Bonn, and all examinations are performed with parental written consent. Due to the open cohort design, several children are not yet 11 years of age and were thus not eligible for the present study.
The inclusion criteria of the present study were as follows:
-
(1) complete 3 d weighed dietary records at four time points, i.e. at ages 6, 7, 10 and 11 years (n 405 of n 560 who had provided only one of two possible 3 d dietary records at ages 6 or 7 and 10 or 11 years);
-
(2) term (37–42 week) singletons with a birth weight >2500 g and anthropometric measurements (weight, height and skinfold thicknesses) at ages 6, 7, 10 and 11 years (n 378);
-
(3) information on parental education and breast-feeding (n 371).
Hence, the subcohort analysed in the present study included 371 children (48·5 % females) with a total of 1484 anthropometric measurements and 3 d weighed dietary records collected between 1985 and 2012.
Nutritional assessment
Dietary intake was assessed using 3 d weighed dietary records. Parents, in part assisted by their child, weighed and recorded all foods and beverages consumed by their child (including leftovers) to the nearest 1 g over three consecutive days. Semi-quantitative recording with household measures (e.g. number of spoons or pieces) was allowed when exact weighing was not possible. Information on recipes or the types and brands of food items was also requested. At the end of the 3 d record period, a dietitian visited the family and checked the record for completeness and accuracy. The 3 d weighed dietary records have been shown to have acceptable validity in younger DONALD participants( Reference Bokhof, Gunther and Berg-Beckhoff 22 ). The dietary records were analysed using the continuously updated in-house nutrient database LEBTAB( Reference Sichert-Hellert, Kersting and Chahda 23 ), which incorporates information from standard nutrient tables, product labels or recipe simulation based on the labelled ingredients and nutrients. All recorded foods and beverages were assigned to one of the forty-three food groups taking into account relevant nutritional components (e.g. fat content or whole grain) and frequencies of food consumption (Supplementary Table S1, available online). To better describe habitual dietary intake at the beginning and at the end of the primary school period, mean intake levels of food groups (g/d) and energy intake (kcal) were estimated from two 3 d dietary records, i.e. at ages 6 and 7 years (beginning of the primary school period) and at ages 10 and 11 years (end of the primary school period), respectively. For this, mean intake levels from each 3 d dietary record were standardised by age (each year separately) and sex (mean = 0, sd= 1) and averaged before analyses.
Anthropometric measurements
The weight and height of children dressed in only underwear and barefoot were measured at each visit according to standard procedures. From the age of 2 years onwards, standing height was measured to the nearest 0·1 cm using a digital stadiometer. Weight was measured to the nearest 0·1 kg with an electronic scale (753 E; Seca). Skinfold thicknesses were measured on the right side of the body at the bicipital, tricipital, subscapular and suprailiac sites to the nearest 0·1 mm with a Holtain calliper.
Sex- and age-independent BMI (kg/m2) standard deviation scores were calculated using the German sex- and age-specific BMI percentile curves of the German Health Interview and Examination Survey for Children and Adolescents (KiGGS)( Reference Rosario, Kurth and Stolzenberg 24 ). Overweight was defined according to the International Obesity Task Force BMI cut-offs for children, which correspond to an adult BMI of 25 kg/m2( Reference Cole, Bellizzi and Flegal 25 ). Body fat percentage was calculated using the Deurenberg equations( Reference Deurenberg, Pieters and Hautvast 26 ), and excess body fat was defined according to McCarthy et al. ( Reference McCarthy, Cole and Fry 27 ) with the use of the 85th sex- and age-specific percentile of body fat percentage. Body fat percentage has recently been criticised as inadequately reflecting body size-adjusted adiposity( Reference Cole, Fewtrell and Prentice 28 ); thus, FMI (fat mass/m2; fat mass = weight × body fat percentage) and fat-free mass index (fat-free mass/m2; fat-free mass = weight − fat mass)( Reference Maynard, Wisemandle and Roche 29 ) were used as measures of body composition in the present study.
To better describe the children's body composition at the beginning and at the end of the primary school period, all calculations are based on the mean of the anthropometric measurements at ages 6 and 7 and at ages 10 and 11 years, respectively. The change in body composition during primary school years was calculated as the difference between BMI and FMI at ages 10 and 11 years and ages 6 and 7 years.
Potentially confounding factors
On their child's inclusion into the study, parents were interviewed about familial characteristics (i.e. parental education) and were weighed and measured using the same equipment used for the children. Information on the child's birth characteristics was abstracted from the ‘Mutterpass’, a standardised document given to all the pregnant women in Germany. The dietitians enquired about the duration of full breast-feeding (no solid foods and no liquids other than breast milk, tea or water) during the first visits until complementary feeding was initiated.
Statistical methods
Statistical Analysis Systems (SAS) procedures (version 9.13; SAS Institute, Inc.) were used for data analysis. A P value < 0·05 was considered to be statistically significant. Since the derived patterns were quite similar for boys and girls and the analysis indicated no significant interactions between sex and the association of the respective dietary patterns with changes in body composition during the primary school period, data obtained from girls and boys were pooled for analysis.
Differences in characteristics at the beginning and at the end of the primary school period were tested using Kruskal–Wallis tests for continuous variables and χ2 tests for categorical variables.
The association of (1) dietary patterns at the beginning of the primary school period and (2) patterns of dietary changes over the course of primary school with the change in body composition during the primary school period was analysed using two different empirical methods, PCA and RRR. The PCA uses one set of variables (predictors, i.e. food groups) and results in a combination of foods that explains as much predictor variation as possible( Reference Hoffmann, Schulze and Schienkiewitz 20 , Reference Schulze, Hoffmann and Kroke 30 ). In addition, RRR was carried out, which aims to construct linear combinations of variables (predictors, i.e. dietary pattern) that belong to one set of predictors by maximising the explained variation in another set of variables (responses, i.e. changes in body composition)( Reference Hoffmann, Schulze and Schienkiewitz 20 ).
Principal component analysis
PCA were conducted using the PROC FACTOR procedure in SAS. In the first PCA, dietary patterns at the beginning of the primary school period (PCA baseline pattern) were identified. In the second PCA, patterns of dietary changes between the end and the beginning of the primary school period were identified (PCA change pattern). For this purpose, data on changes in the intake levels of all the forty-three food groups were obtained (log-transformed standardised intake levels at ages 10 and 11 years minus log-transformed standardised intake levels at ages 6 and 7 years). To identify the number of baseline and change patterns to be retained, the following criteria were used: eigenvalues exceeding 1 (based on the rationale that each component should explain more variance than a single original variable in the dataset) and the scree plot (a graphical presentation of the eigenvalues, which indicated a break between the second and third eigenvalues for both the baseline and change patterns in this analysis)( Reference Schulze, Hoffmann and Kroke 30 , Reference Hatcher 31 ). Therefore, two patterns were retained in both the baseline and change pattern analyses. After a varimax rotation with the a priori selection of the number of two factors to be retained (by adding the nfact = 2 option), food groups with relevant factor loadings, i.e. loadings ≥ |0·4|, were considered as contributing to a pattern. For each pattern, more than three food groups could be retained, which is considered an adequate number for good interpretability( Reference Hatcher 31 ). According to the approach of simplified pattern variables, the individual PCA factor scores were based solely on the sum of the unweighted standardised food intakes (g/d) that loaded high at the respective pattern( Reference Schulze, Hoffmann and Kroke 32 ).
Reduced rank regression
Similarly, two RRR analyses were conducted using the PROC PLS procedure in SAS with the option method = RRR( Reference Hoffmann, Schulze and Schienkiewitz 20 ). For the first RRR, log-transformed standardised intake levels of food groups at the beginning of the primary school period were used as predictor variables. The response variables were the changes in BMI and FMI between the end and the beginning of the primary school period adjusted each for baseline BMI and FMI at the beginning of the primary school period, respectively, applying the residual method( Reference Willett 33 ) (RRR baseline factors). For the second RRR, changes in food group intakes between the end and the beginning of the primary school period were the predictor variables and the changes in BMI and FMI at the end and at the beginning of the primary school period adjusted for baseline body composition were the response variables (RRR change factors). The number of factors extracted from the predictor variables is always equal to the number of response variables, i.e. two factors were identified by each RRR. However, since the second baseline and change patterns, respectively, explained < 1 % in outcome variation, only the first were retained for analyses. All food groups with a factor loading ≥ |0·2| were included. As for the PCA, the individual RRR factor scores were calculated according to the approach of simplified pattern variables( Reference Schulze, Hoffmann and Kroke 32 ).
Regression models with principal component analysis factors
Subsequently, PCA factors were used as independent predictor variables in multivariable linear regression models (PROC GLM) with the changes in BMI and FMI at the end and between the beginning of the primary school period adjusted each for baseline BMI or FMI at the beginning of the primary school period, respectively (applying the residual method)( Reference Willett 33 ), as the dependent outcomes. The P values for a linear trend refer to models with continuous pattern scores as independent variables. To obtain intuitive values for presentation and to better illustrate the effect sizes, adjusted outcome means were calculated by tertiles of PCA. To achieve this, each value was back-transformed sex specifically by adding the expected change in body composition for a person with a mean baseline body composition (BMI or FMI, respectively)( Reference Willett 33 ).
Regression models with reduced rank regression factors
By definition, RRR patterns will be predictive of changes in BMI and FMI during primary school years, i.e. the variables for which they were derived. For this reason, we refrain from discussing this matter of course (i.e. unadjusted values) as a main result. Nonetheless, it is interesting to (1) illustrate the effect sizes of the predicted changes and (2) investigate whether the obtained patterns are still predictive after adjustment for potential confounders. Therefore, adjusted differences in BMI and FMI are illustrated by tertiles of RRR factors. Again, least-squares means correspond to back-transformed values (i.e. adding the expected sex-specific change in body composition for a person with a mean baseline body composition)( Reference Willett 33 ), and the P values for a linear trend refer to models with continuous pattern scores as independent variables.
Analysis of covariates
We considered the following covariates to be potentially confounding the association between dietary patterns and changes in body composition: sex; gestational age; birth weight ( < 3000 g); ever fully breast-fed (>2 weeks); high parental educational status ( ≥ 12 years of schooling); maternal overweight (BMI ≥ 25 kg/m2). Variables were initially examined separately and included in the fully adjusted model only if they modified regression coefficients of the pattern scores in the unadjusted models by ≥ 10 %. To ensure comparability between the models, we included all the variables that met the ≥ 10 % criteria in any of the four models investigating the relationship between a dietary pattern and FMI and then used the same covariates in models with BMI as the outcome.
Conditional analysis
In addition, we carried out a conditional analysis (additionally including changes in energy intake during the primary school period adjusted for baseline energy intake with the residual method) so as to assess whether the observed associations are partly attributable to changes in energy intake.
Verification of the linear regression modelling assumptions indicated that these were met for the analysed longitudinal data.
Results
Sex, early life and familial characteristics of the sample are given in Table 1. The study included 180 (48·5 %) girls and 191 (51·5 %) boys. Table 2 summarises the dietary intake and anthropometric characteristics of the participants stratified by the beginning and the end of the primary school period. As expected, energy intake levels, BMI, FMI and fat-free mass index increased during primary school years. While the BMI standard deviation scores did not differ significantly, the percentage of overweight and overfatness increased over the 4-year period.
Sex, early life and familial characteristics of 371 participants (Frequencies, medians and interquartile ranges (Q1–Q3))
* Full breast-feeding >2 weeks.
† BMI ≥ 25 kg/m2.
‡ At least 12 years of education.
Dietary intake and anthropometric characteristics of 371 participants at the beginning (6 and 7 years) and the end (10 and 11 years) of the primary school period* (Frequencies, medians and interquartile ranges (Q1–Q3))
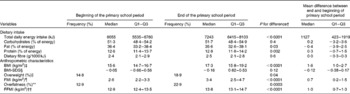
SDS, standard deviation score; FMI, fat mass index; FFMI, fat-free mass index.
* Obtained at ages 6 and 7 years and ages 10 and 11 years, respectively.
† Significant differences between the groups tested using the Kruskal–Wallis tests for continuous variables and the χ2 tests for categorical variables.
‡ Weight/height2 (kg/m2).
§ Calculated using the German sex- and age-specific BMI percentile curves of the German Health Interview and Examination Survey for Children and Adolescents (KiGGS)( Reference Rosario, Kurth and Stolzenberg 24 ).
∥ Derived from the sex- and age-specific cut-offs proposed by the International Obesity Task Force, which correspond to an adult BMI cut-off of 25 kg/m2( Reference Cole, Bellizzi and Flegal 25 ).
¶ Fat mass/height2 (kg/m2).
** Defined according to McCarthy et al. ( Reference McCarthy, Cole and Fry 27 ).
†† Fat-free mass/height2 (kg/m2).
The factors obtained by the PCA and RRR are given in Table 3. The food groups characterising PCA baseline pattern 1 (‘healthy’) could be summarised as health conscious, while dough and potatoes dominated PCA baseline pattern 2 (‘pancake & potatoes’). The PCA change pattern 1 is best described as dominated by increases in the consumption of convenience foods and eggs, while PCA change pattern 2 reflected a change in diet towards a traditional pattern. The RRR patterns contained more and disjointed food groups than the PCA patterns and are more difficult to summarise. The RRR pattern 1 was labelled ‘unfavourable carbohydrate sources’, characterised by a high intake of white bread and a low intake of whole-grain bread and cereals. Adherence to RRR pattern 1 was associated with a lower intake of protein (percentage of energy intake) and fibre. Energy intake and intake of other macronutrients exhibited no association with adherence to the pattern (data not shown). The RRR change pattern 1, ‘increase in the consumption of processed savoury foods’, was characterised by increasing intakes of foods such as savoury snacks, sausages, cheese and dressings. For RRR change pattern 1, adherence to the pattern was unrelated to changes in energy or macronutrient intakes (data not shown).
Included food groups and explained variance in the principal component analysis (PCA) and reduced rank regression (RRR) patterns
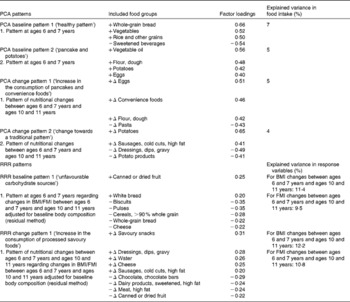
FMI, fat mass index; − /+, the loading of the food group in the pattern; Δ, the change in food group intake during the primary school years (i.e. intake at ages 10 and 11 years minus intake at ages 6 and 7 years); − Δ, decrease in consumption during primary school years; +Δ, increase in consumption during primary school years.
No significant associations were found between PCA baseline or change patterns and changes in BMI or FMI during the primary school period (Table 4), irrespective of adjustment for potential confounders.
Associations of principal component analysis (PCA) baseline patterns and PCA change patterns with change in body composition during the primary school period (Mean values and 95% confidence intervals)
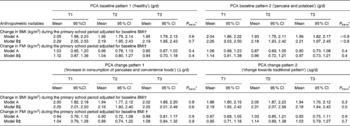
T, tertile; FMI, fat mass index.
* Based on multiple linear regression models with dietary pattern scores as continuous variables.
† Adjustment for baseline body composition (BMI or FMI, respectively) with the residual method. To obtain intuitive values, the expected change in body composition for a person with mean baseline body composition (BMI or FMI, respectively) was added. Model was further adjusted for sex.
‡ Adjusted for factors in model A and for maternal overweight, high paternal education, gestational age, birth weight category and ever fully breast-fed (n 369).
Fig. 1 shows that the RRR baseline pattern and the RRR change pattern were still related to changes in BMI and FMI during the primary school period, i.e. to the response variables for which they were derived after adjustment for potential confounders. For the RRR baseline and change patterns, changes in BMI and FMI during the primary school period were highest in the upper tertiles. Compared with subjects in the lowest tertile, those in the highest tertile of the RRR baseline pattern had a 21 % higher increase in BMI and those in the highest tertile of the RRR change pattern had a 34 % higher increase in BMI. The corresponding differences in FMI were +60 and +74 %, respectively. Of note, these differences were even more pronounced in unadjusted models (differences in BMI between tertile (T) T1 and T3:+26 % for the RRR baseline pattern and +39 % for the RRR change pattern; differences in FMI: +67 % for the RRR baseline pattern and +80 % for the RRR change pattern).
Associations of reduced rank regression (RRR) baseline pattern (‘unfavourable carbohydrate sources’) (a, c) and RRR change pattern (‘increase in the consumption of processed savoury foods’) (b, d) with change in body composition during primary school years. Values are least-squares means with their 95 % CI. The patterns were adjusted for baseline body composition (BMI or fat mass index (FMI), respectively) using the residual method. To obtain intuitive values, the expected change in body composition for a person with mean baseline body composition (BMI or FMI, respectively) was added. The patterns were also adjusted for sex, maternal overweight, high paternal education, gestational age, birth weight category and full breast-feeding (n 369). P values for a linear trend based on multiple linear regression models with dietary pattern scores as continuous variables. T, tertile.
The associations observed for both the PCA and RRR patterns were not affected by inclusion of change in energy intake during the primary school period as a potential pathway variable (conditional model, data not shown).
Discussion
The present study provides new prospective evidence suggesting the relevance of dietary patterns during the primary school period identified by RRR to the development of body composition during this period. Patterns characterised by (1) a higher intake of unfavourable carbohydrate sources at the beginning of the primary school period and (2) an increase in the consumption of processed savoury foods during primary school years were found to be associated with higher increases in BMI and FMI. To our knowledge, this is the first study to consider patterns of both changes in diet and changes in body composition during the potentially critical period of primary school. Patterns identified by the PCA were interpretable, but not prospectively associated with the development of BMI and FMI.
In the present study, the dietary patterns extracted with the PCA accounted for only 4–7 % of the total variance in food intake. This low explained variance is in line with the findings of other studies( Reference McNaughton, Ball and Mishra 18 , Reference Craig, McNeill and Macdiarmid 19 , Reference Richter, Heidemann and Schulze 34 , Reference Northstone and Emmett 35 ), and components obtained with a PCA generally tend to account for only a small amount of the total variance in food intake in a dataset. Thus, other factors that account for a remarkable proportion of the variation between the children might exist within the dataset, though explaining less of the variance( Reference Michels and Schulze 36 ). Furthermore, in the present study, PCA baseline and change factors were not related to changes in body composition during primary school years. Similarly, among US adolescents, Cutler et al. ( Reference Cutler, Flood and Hannan 12 ) derived both a fruit and a vegetable pattern in adolescents by means of a PCA. Higher adherence to the vegetable pattern was found to be associated with a lower risk of later overweight/obese status and higher adherence to the fruit pattern with a higher risk, but only before adjustment for baseline weight status. Generally, PCA is hampered by both a tendency to yield factors accounting for only a small amount of the total variance in food intake in a dataset( Reference Michels and Schulze 36 ) and the fact that the extracted patterns may not include the parts of dietary behaviour that are relevant to later health outcomes, e.g. body composition( Reference Cutler, Flood and Hannan 12 ).
Therefore, we deliberately chose RRR as the second statistical approach, since RRR explicitly aims to derive predictors that explain maximal variation in response variables( Reference Hoffmann, Schulze and Schienkiewitz 20 ). Hence, RRR dietary patterns are more pertinent to the outcome than PCA patterns( Reference Johnson, Mander and Jones 11 ). In line with this, the RRR prospective and change factors in the present study were found to be strongly related to the development of BMI and FMI during the primary school period, i.e. the response variables that the patterns were constructed for, even after adjustment for potential confounders. However, it should also be mentioned at this point that RRR dietary patterns usually account for only a small amount of variation in food group intake( Reference Hoffmann, Schulze and Schienkiewitz 20 ) and are often hard to interpret.
In the present study, higher adherence to a pattern dominated by unfavourable carbohydrate sources at the beginning of the primary school period was prospectively associated with a higher increase in BMI and FMI during primary school years. This is in line with other studies among adult cohorts( Reference Schulze, Fung and Manson 37 , Reference Schulz, Nothlings and Hoffmann 38 ). For example, Schulze et al. ( Reference Schulze, Fung and Manson 37 ) described that strong adherence to a Western pattern (derived by PCA) characterised, among others, by a high intake of refined grains, sweets and desserts was associated with a greater weight gain in women. Similarly, Schulz et al. ( Reference Schulz, Nothlings and Hoffmann 38 ) identified a dietary pattern of high consumption of, among others, whole-grain bread, grain flakes/cereals, fruit and vegetables by means of RRR to be predictive of a lower weight gain.
Of note, we also found a novel association between a pattern characterised by an increase in the consumption of processed savoury foods (savoury snacks, sausages, cheese and dressings) during primary school years and concurrent unfavourable developments in BMI and FMI. The protein leverage hypothesis proposes that a dominant appetite for protein in combination with a decrease in the ratio of protein:carbohydrates and fat in the diet is related to excess energy intake and the risk of obesity( Reference Simpson and Raubenheimer 39 ). Gosby et al. ( Reference Gosby, Conigrave and Lau 40 ) showed that increasing the percentages of carbohydrates and fat compared with protein in the diet among lean adults resulted in a higher total energy intake, predominantly from savoury snacks. Since the percentage of protein in the diet of our sample was rather low at the beginning and the end of the primary school period, a higher demand for savoury protein sources might also be possible.
We presumed that including change in energy intake during the primary school period as a potential pathway variable would render the associations insignificant, since energy intake has repeatedly been discussed to contribute to the overweight risk( Reference Bleich, Ku and Wang 41 , Reference Skinner, Steiner and Perrin 42 ). However, this assumption was not verified. This might be because the 3 d weighed dietary records used in the present study are not as appropriate as 7 d weighed dietary records to describe energy intake( Reference Bingham 43 ). Alternatively, our finding may reflect the phenomenon of under-reporting of socially undesired foods( Reference Craig, McNeill and Macdiarmid 19 , Reference Heitmann and Lissner 44 ) and thus energy intake among children with higher BMI and FMI. In fact, in our sample, the ratio of energy intake:BMR( Reference Schofield 45 ) at the beginning of the primary school period was significantly lower among children with higher BMI or FMI (data not shown).
Some limitations and strengths of the present study need to be mentioned. Due to the elaborate design of the DONALD Study, the participants of the present study are characterised by a relatively high socio-economic and educational status, resulting in a comparably homogeneous sample with a moderate number of overweight children. However, non-representativeness is less relevant to the present longitudinal analysis. Some additional selection bias may have been introduced by the fact that we restricted the analysis to those who provided two 3 d dietary both at the beginning and at the end of the primary school period; however, characterisation of habitual dietary intake in school-aged children requires more than one 3 d dietary record( Reference Erkkola, Kyttälä and Takkinen 46 ).
Furthermore, reliable information on physical activity or sedentary behaviour, two potential confounders of the associations between dietary patterns and body fatness, was not available. We merely disposed a crude measure of physical activity at the age of 5 years derived from parental questionnaires, which was, however, only available for 339 participants of the present study. When we repeated our analyses with further adjustment for physical activity in this subgroup, we obtained results essentially comparable to those of our main analyses. Another potential limitation is the use of a 3 d weighed dietary record rather than a FFQ, which might be superior in terms of extracting dietary patterns, since it captures consumption over a longer term. However, dietary records are less dependent on the assumptions of standard portion sizes and foods representing a food group item( Reference Johnson, Mander and Jones 11 ). Nonetheless, compared with those in other studies using a FFQ( Reference Cutler, Flood and Hannan 12 , Reference Wall, Thompson and Robinson 13 , Reference Craig, McNeill and Macdiarmid 19 , Reference Northstone and Emmett 35 ), the dietary patterns derived in our sample from 3 d weighed dietary records were less straightforward. Although we directly assigned each food item to a food group, our approach was based on ingredients; that is, we were not able to estimate patterns based on dishes or foods consumed in combination. Ritchie et al. ( Reference Ritchie, Spector and Stevens 10 ) proposed to transform discrete foods and ingredients from the dietary record back to combined foods, e.g. to avoid coding small servings of vegetables and condiments in a hamburger separately from the meat and bun. However, comparisons of dietary patterns derived by FFQ and dietary records revealed Pearson's correlation coefficients of about 0·5( Reference van Dam, Rimm and Willett 47 , Reference Hu, Rimm and Smith-Warner 48 ), pointing to a moderate agreement.
Finally, general limitations of pattern analyses include that both the procedures of PCA and RRR involve several subjective decisions, ranging from the assignment of foods to food groups to the choice of the number of factors to be extracted, the choice of the approach of rotation and the decision which factors are relevant( Reference Wosje, Khoury and Claytor 9 , Reference Craig, McNeill and Macdiarmid 19 , Reference Martinez, Marshall and Sechrest 49 ). To minimise subjectivity, two authors consulted and came to an agreement on how to group foods, how many food groups are to be retained and which factors are to be considered relevant before conducting the analyses. Additionally, PCA and RRR are data specific and may not be reproducible in populations with different dietary habits( Reference Wosje, Khoury and Claytor 9 , Reference Schulze, Hoffmann and Kroke 30 ). To reduce population dependency of the dietary patterns, we used the simplified pattern approach( Reference Schulze, Hoffmann and Kroke 32 ). Furthermore, the PCA patterns explain only a small part of total variance in food intake in our sample, which is, however, comparable to that in other dietary pattern studies. Finally, as has been already outlined above, we did not follow the standard RRR analytical approach using intermediate variables for the extraction of patterns( Reference Hoffmann, Schulze and Schienkiewitz 20 ). Most other studies( Reference Johnson, Mander and Jones 11 , Reference Hoffmann, Schulze and Schienkiewitz 20 , Reference DiBello, Kraft and McGarvey 50 ) conducted the RRR with nutrients or biomarkers as intermediate variables; however, similar to us, Wosje et al. ( Reference Wosje, Khoury and Claytor 9 ) extracted patterns directly explaining variation in their outcome of interest. An alternative approach would have been to extract patterns for half of the study sample and relate these patterns to the outcome in the other half. However, our sample size was too small for such a split-sample approach.
The present study also has several strengths including its prospective nature covering a period of approximately 4 years with regular assessments of detailed dietary and anthropometric data and thus our ability to describe changes in diet and growth and finally the various early life and socio-economic confounders. Dietary intake data both at the beginning and at the end of the primary school period were based on two assessments, so as to obtain an estimate of the habitual dietary intake at the respective time points. Furthermore, we were able to investigate the change in dietary intake over a 4-year period for every participant. Another strength was that we considered FMI as a more sensitive measurement of obesity in addition to BMI. FMI was estimated from skinfold thickness measurements, a method known to be susceptible to measurement error( Reference Eisenmann, Heelan and Welk 51 ); however, the personnel involved in the present study is trained regularly and, thus, intra-observer variability and inter-observer variability are notably reduced( Reference Kroke, Manz and Kersting 21 ).
In conclusion, we could identify dietary patterns predictive of changes in body composition during primary school years using the RRR analysis. Our data suggest that dietary patterns characterised by unfavourable carbohydrate sources at the beginning of the primary school period and patterns dominated by an increase in the consumption of processed savoury foods during primary school years are adversely related to the development of body composition during primary school years. Corroboration of these findings in other cohort studies, preferably prospective studies using a FFQ, is necessary.
Supplementary material
To view supplementary material for this article, please visit http://dx.doi.org/10.1017/S0007114513004017
Acknowledgements
The authors thank all the children and their families who participated in the DONALD Study. They also thank the staff of the DONALD Study for carrying out the anthropometric measurements and administering the questionnaires.
The present study was supported by the Kompetenznetz Adipositas (Competence Network Obesity) funded by the Federal Ministry of Education and Research (FKZ: 01GI1121A). The DONALD Study is supported by the Ministry of Innovation, Science, Research and Technology of North Rhine Westphalia, Germany.
The authors' contributions are as follows: A. E. B. and K. D. conceived the project and formulated the research questions; K. D. was responsible for data management, carried out the statistical analyses and drafted the manuscript; A. L. B. G., M. B. S. and M. S. gave input on the performance of the statistical analyses; A. L. B. G., M. B. S., M. S. and J. H. provided critical input on the interpretation of the results and on earlier versions of the manuscript; A. E. B. supervised the study. All authors contributed to the interpretation of the data and revision of the manuscript.
None of the authors has any conflicts of interest to declare.


