1. Introduction
Precipitation on the high Antarctic plateau is very low. Assuming that little of it re-evaporates (Reference Van den BroekeVan den Broeke, 1997; Reference FrezzottiFrezzotti and others, 2004), surface mass-balance (SMB) reports from field measurements (e.g. as compiled by Reference Vaughan, Bamber, Giovinetto, Russell and CooperVaughan and others, 1999) suggest that precipitation is mostly less than 100 mma–1 and in many places less than 50 mma–1. Due to cold temperature and low humidity, a significant fraction of precipitation probably occurs while the sky is clear (Reference BromwichBromwich, 1988; Reference Bromwich, Guo, Bai and ChenBromwich and others, 2004). Such precipitation is often referred to as ‘diamond dust’. Like any form of precipitation, diamond dust results from condensation of atmospheric vapor into hydrometeors which settle to the surface. However, it has been suggested that because local conditions are unique, the ability of meteorological or climate models to reproduce diamond dust, and thus, to a significant extent, precipitation and SMB, on the plateau may be low. This conclusion is supported by reports that several high-resolution state-of-the-art models yield much lower snow accumulation than suggested by in situ measurements on the plateau (Reference Bromwich, Guo, Bai and ChenBromwich and others, 2004; Reference Van de Berg, van den Broeke, Reijmer and van MeijgaardVan de Berg and others, 2006; Krinner and others, 2007).
However, not all in situ measurements are equally reliable. A range of methods have been used to estimate accumulation, using stakes, cores, pits and various tracers of either annual (stratigraphy) or well-dated snow or ice layers. Considering the size of the ice sheet, the number of such measurements available is small and there are large gaps in the spatial coverage (e.g. fig. 4 of Reference Vaughan, Bamber, Giovinetto, Russell and CooperVaughan and others, 1999, a publication henceforth referred as V99). Consequently, none of the reports can be readily discounted, whether or not they meet quality and confidence criteria. Moreover, experience of measurement techniques and of the characteristic Antarctic environment is required to develop sensible criteria to sort out the data. Such experience is not typically available in the community that uses the data to verify climate models. The most recent maps of the mean Antarctic SMB (Reference Arthern, Winebrenner and VaughanArthern and others, 2006) and those most widely referred to in the recent literature (Reference Vaughan, Bamber, Giovinetto, Russell and CooperVaughan and others, 1999; Reference Giovinetto and ZwallyGiovinetto and Zwally, 2000) are the result of a formidable effort, using the international literature and archives, to compile as many in situ observations as possible, but no quality control and filtering of these observations have been performed. Any bias in the maps that results from inaccurate observations may result in falsely systematic differences between the model and the maps, which may in turn be erroneously attributed to shortcomings in the model.
Here, we present evidence that, at least in the East Wilkes and Victoria Land (EWVL; 90–180° E) sector of Antarctica, processing available in situ SMB data through quality-control filters may result in a significantly different evaluation of the ability of climate models to reproduce precipitation and SMB on the high Antarctic plateau.
2. East Wilkes and Victoria Land Surface Mass Balance
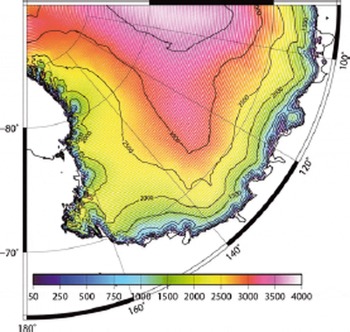
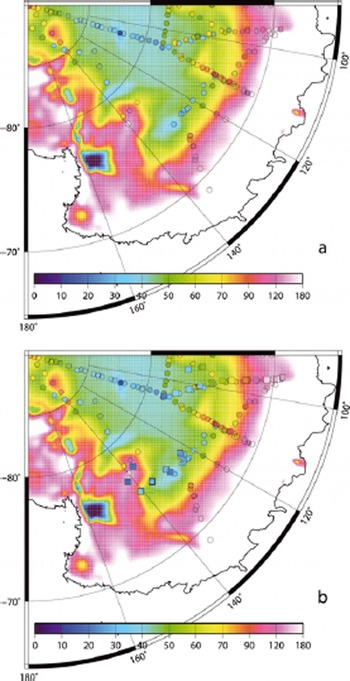
Figure 1 shows the EWVL sector of Antarctica and the corresponding surface elevation; much of it is part of the high Antarctic plateau above 2500 m. Figure 2a shows the mean SMB of this sector. The background is V99’s SMB map based on scattered in situ reports and satellite microwave data as a support for spatial interpolation (the same background is shown in Figs 2a and b and 3). The location and values of the in situ reports actually used by V99 are also shown (Fig. 2a). One step in the interpolation process carried out by V99 is the minimization of the mean deviation between the in situ reports and a continuous function of the microwave emissivity of snow as seen by satellites. As a result, even at sites of field reports, the agreement between V99 and the reports is not perfect. Yet the field data clearly exert a strong constraint on the regional SMB distribution, introducing large alterations and distortions to an otherwise relatively smooth background field. Some of the distortions result from a very limited number of field reports in otherwise data-devoid regions. Where data density is high, there may be significant differences between observations at neighboring sites which are averaged out in the interpolation process.
The EWVL sector of Antarctica and surface elevation (m).

Mean SMB above 2500 ma.s.l. from V99 (background), from individual reports from various sources as referenced and used in V99 (circles in (a) and (b)), and from additional and recent field campaigns, the results of which were not used by V99 (squares in (b)). Unit: mma–1w.e.

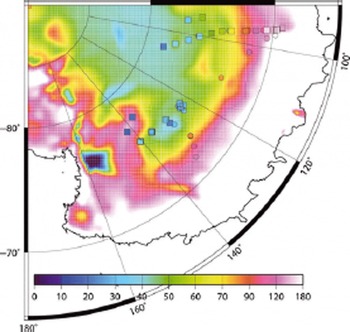
Quality-control filtered in situ SMB data (circles: used by V99; squares: new SMB data) above 2500ma.s.l., with V99 in background. Unit: mma–1w.e.

Since V99, field campaigns have been carried out to obtain additional field data in this sector of Antarctica (e.g. Reference Ekaykin, V., Lipenkov, Barkov, Petit and Masson-DelmotteEkaykin and others, 2002; Reference FrezzottiFrezzotti and others, 2004). New reports, as well as a few older reports which have been overseen in the building of the V99 interpolated map, are shown in Figure 2b (squares). Some of the additional observations help to fill gaps in data-sparse regions. In most cases, the additional data do not confirm the interpolation carried out from the main dataset, and suggest that the SMB is actually smaller than previously evaluated This is particularly clear just south of 75° S in the 135–140° E sector.
However, some of the new data come relatively close to the sites of older observations. In a number of cases, the new data do not confirm the older data (particularly near 77° S, 140° E), with a clear tendency for the recent observations to yield smaller SMB values. Thus, although improved interpolation as proposed, for example, by Reference Arthern, Winebrenner and VaughanArthern and others (2006) might enhance and refine our knowledge of the Antarctic SMB, a major source of uncertainty appears to lie in the in situ reports, and no improved interpolation technique is likely to reduce this.
There are various reasons why newer in situ SMB data can disagree with older data, including the possibility that different reports can be differently affected by spatial and temporal variability. However, the discrepancies presented above mostly tend toward lower SMB values and are thus not randomly distributed. It turns out that the additional data mostly result from either of two SMB measurement techniques: stake networks with reasonably long records or radioactivity-dated snow/ice cores. Reference MagandMagand and others (2007) argue that these are the most reliable methods to assess SMB averages over several years, the basis of building a mean SMB map. In fact, Reference MagandMagand and others (2007) suggest that a much better observational dataset of SMB measurements would be obtained by discarding measurements that do not fit quality-control criteria based on (1) an up-to-date review and quality rating of the various
SMB measurement methods, and (2) essential information (location, dates of measurements, time period covered by the SMB values, primary data sources) related to each SMB datum. An improved dataset is thus obtained at the cost of a strong reduction in sample size and spatial coverage. However, it can be argued, and the results discussed above and shown in Figure 2 appear to confirm, that assembling as many SMB data as possible can be misleading unless measurement quality is consistently up to scratch. If older reports overestimate the actual SMB, due to, for example, biases in some of the measurement techniques used (Reference BullBull, 1971; Reference Picciotto, Crozaz, De Breuck and CraryPicciotto and others, 1971), then such conclusions as a systematic overestimation of the plateau accumulation by recent meteorological and climate models are unwarranted.
3. Data Filtering and Impact On Model Evaluation
Criteria for quality-control filtering of in situ SMB reports have recently been reviewed by Reference MagandMagand and others (2007). These authors provide an up-to-date review of the various field methods for estimating local SMB and establish a quality rating of the various methods (Table 1). This is used to decide whether to reject some of the SMB reports available in the literature and build a dataset that is more reliable than a mere assemblage of all available reports. For example, SMB measurement by snow stratigraphy is based on identification of annual layers in the dry-snow facies in the accumulation zones of the ice sheets. Numerous criteria for the identification of annual layers have been established for dry-snow facies in Greenland and Antarctica, and they yielded a large number of net accumulation values during the 1950s and 1960s. However, in the central region of the East Antarctic plateau, these criteria are difficult to apply and the observed SMB derived from pit stratigraphy alone involves personal and subjective interpretation, usually leading to unreliable estimates. This problem originates from the low and variable annual precipitation in the central plateau and from the strong metamorphism of the upper snow and firn layers, resulting in partial or sometimes total obliteration of the annual layering. It has also been reported that this technique may not be reliable in areas of very high snowfall, near the coast. Reference MagandMagand and others (2007) thus rate stratigraphy-based SMB determinations as an unreliable method (Table 1).
Reliability and applicability conditions of SMB field measurement methods. A = reliable; B = conditionally reliable; C = unreliable; / = not applicable. See Reference MagandMagand and others (2007) for details

Processing available data through such filtering results, in the EWVL sector, in the dataset shown in Figure 3 (the V99 interpolated SMB map is reproduced as background). There is a dramatic reduction in the number of observations compared to Figure 2, as the filter discards most of the older data. These older data were obtained using methods known to be of limited reliability, particularly in the lower-accumulation regions, for example visual or mechanical stratigraphic evaluation of snow layers and attribution to seasons (see previous paragraph; Table 1). Some reports even result from the digitalization of old graphs, with no information on how the original data were obtained and how interpolation was carried out (Reference MagandMagand and others, 2007). Most of the data that satisfy the quality criteria and make it into the filtered dataset fall on the low SMB side compared to V99.
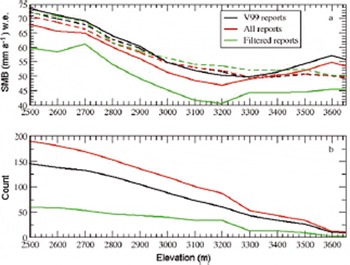
This is confirmed by Figure 4a (solid curves) which shows the cumulative distribution of the averaged SMB with respect to elevation, for the original dataset used by V99; the complete dataset using all available reports including those unused by V99; and the dataset containing only data that pass Reference MagandMagand and others’ (2007) quality-control filter. The cumulative averaged SMB for elevation E is the average of all SMB reports from sites above elevation E. Figure 4b also shows the number of reports used to compute the averaged SMB.
(a) Cumulative averaged SMB as a function of elevation; and (b) corresponding number of reports. Solid curves are from actual SMB reports; dashed curves are for V99 interpolated values at sites of the reports (see section 3). Blue: SMB reports used by V99; red: all reports including recent ones not used by V99; green: quality-controlled reports only.

For any elevation range above 2500 m, the averaged SMB is significantly less with the quality-controlled data than with all available reports or with the reports used by V99. Data filtering both strongly reduces the number of reports (Fig. 4b) and significantly modifies their spatial distribution (Fig. 3 compared to Fig. 2b). To verify that changing the spatial distribution of the reports is not likely to account for a lower mean accumulation in the filtered dataset, we sample V99’s map at the sites of actual reports (reports used in V99, all reports or filtered reports) and calculate the mean V99-map-based cumulative SMB (Fig. 4a, dashed curves) in the same way the real reports were processed (Fig. 4a, solid curves). Obviously, the number of reports (Fig. 4b) is the same for the real reports and the V99-map-based samples. Unlike the real reports, the V99-map-based cumulative altitudinal distribution of the SMB is almost insensitive to data sampling. Thus, much of the reduction of the estimate of the mean plateau SMB after filtering is a result of data quality control: better data suggest lower accumulation than previously evaluated. As a corollary, it seems that older data using unwarranted measurement methods are biased towards an overestimation of the SMB.
Reference Bromwich, Guo, Bai and ChenBromwich and others (2004) report that both with the Polar MM5 mesoscale meteorological model and with a dynamic retrieval method to evaluate precipitation from the analyzed thermodynamic structure of the atmosphere, the SMB over the high Antarctic plateau is underestimated by 30–50% compared to observations. In that case, the V99 map is used as the reference observation. To avoid using interpolated data, Reference Van de Berg, van den Broeke, Reijmer and van MeijgaardVan de Berg and others (2006) compare results from the RACMO2/ANT mesoscale model (Regional Atmospheric Climate Model version 2) directly with the available field reports, augmenting the dataset used by V99 with more recent reports. They also find that the model largely underestimates the SMB, by 25% at 2500 ma.s.l. up to 70% at 4000ma.s.l. Reference Bromwich, Guo, Bai and ChenBromwich and others (2004) report that preceding studies (including Reference Genthon and KrinnerGenthon and Krinner (2001) confronting several atmospheric general circulation models) have also found that high-resolution climate models and meteorological analyses tend to underestimate the Antarctic plateau accumulation. This is further confirmed by the recent re-evaluation of the Laboratoire de Météorologie Dynamique–Zoom (LMDZ) stretched-grid atmospheric general circulation model (Reference Krinner, Magand, Simmonds, Genthon and DufresneKrinner and others, 2007). In Reference Bromwich, Guo, Bai and ChenBromwich and others (2004), Reference Van de Berg, van den Broeke, Reijmer and van MeijgaardVan de Berg and others (2006) and Reference Krinner, Magand, Simmonds, Genthon and DufresneKrinner and others (2007), model resolution is high over Antarctica (∽40–60 km), and, unlike in coastal regions, unresolved features on the relatively smooth Antarctic plateau are unlikely to contribute to model biases. On the other hand, in Reference Bromwich, Guo, Bai and ChenBromwich and others (2004) and Reference Van de Berg, van den Broeke, Reijmer and van MeijgaardVan de Berg and others (2006) the reference-field SMB data have not been quality-controlled. The only exception is Reference Krinner, Magand, Simmonds, Genthon and DufresneKrinner and others (2007) where model results are mainly compared with a selection of field reports (V99 and ‘new’ field SMB reports) stated to be ‘reliable’ (their fig. 4c). In the latter case, there is no evidence that modeled SMB is consistently less than the observations on the high plateau.
Both Reference Bromwich, Guo, Bai and ChenBromwich and others (2004) and Reference Van de Berg, van den Broeke, Reijmer and van MeijgaardVan de Berg and others (2006) blame poor representation in the models of the physical processes that lead to precipitation on the high Antarctic plateau. Reference Van de Berg, van den Broeke, Reijmer and van MeijgaardVan de Berg and others (2006) suggest that the removal of boundary-layer cloud ice is the source of precipitation on the plateau and is not yet adequately parameterized in models. Reference Bromwich, Guo, Bai and ChenBromwich and others (2004) suggest that much of the plateau accumulation results from continuous clear-sky precipitation with no organized synoptic-scale process, while precipitation in the MM5 model is episodic. Reference Krinner and GenthonKrinner and Genthon (1997) also found in the LMDZ model that a large fraction of total precipitation on the plateau is associated with a limited number of synoptic events.
It may well be that clear-sky precipitation processes are not adequately accounted for in meteorological and climate models, considering that most such models are initially developed and carefully validated with lower latitudes in mind, and that theory and observation to develop specific parameterization for the remote Antarctic are lacking. However, it appears that a systematic underestimation of plateau precipitation by models partially reflects an actual overestimation by the available field reports. Figure 4 shows that averaged SMB for the quality-controlled data is ∽75–85% of that for the raw data. This typically accounts for 40–100% of the data–model differences reported by, for example, Reference Bromwich, Guo, Bai and ChenBromwich and others (2004) and Reference Van de Berg, van den Broeke, Reijmer and van MeijgaardVan de Berg and others (2006).
4. Conclusions
More than 2000 in situ reports of Antarctic accumulation have been made and compiled in various datasets (e.g. Reference Vaughan, Bamber, Giovinetto, Russell and CooperVaughan and others, 1999). This is insufficient to provide adequate spatial coverage at the scale of Antarctica, and more field measurements including new field techniques (e.g. ground-penetrating radar (Reference FrezzottiFrezzotti and others, 2005)) as well as an improved use of satellites and statistical processing of data (Reference Arthern, Winebrenner and VaughanArthern and others, 2006) are necessary to increase our knowledge and understanding of the mass balance of the ice sheet. However, it is also necessary to sift through the available SMB reports and discard those that are insufficiently reliable. On the EWVL plateau, filtering in situ SMB data through expert-based quality-control criteria results in a significantly smaller averaged SMB estimate. This indicates that discarded data had on average a positive bias.
An important consequence is that using less numerous but more reliable, quality-controlled, data to verify and validate meteorological and climate models can result in a different appreciation of model performances. Considering that Antarctic circulation, hydrology and climate are complex and very different from those in the rest of the world, models are prone to errors and one should not expect that previously identified model–data discrepancies (e.g. Reference Genthon and KrinnerGenthon and Krinner 2001) can be entirely attributed to the data. However, better data might notably modify the magnitude of particular model deficiencies, and the seriousness attached to them, and their interpretation. Specifically, although models may not properly simulate diamond dust on the Antarctic plateau, it is likely that the impact on the simulation of the plateau SMB is significantly less than previously estimated, due to inaccurate reference in situ data. As a consequence, such considerations as the balance between clear-sky and synoptic precipitation on the plateau may need to be revised (Reference MassomMassom and others, 2003). Confirmation and extension of the present findings through quality-control processing available data outside the EWVL region is necessary. However, such processing is highly time-consuming and must be carried out by experts. Meanwhile, it is also crucial that more data using quality-controlled methods are obtained, for example as part of the International Trans-Antarctic Scientific Expedition (ITASE) (http://www2.umaine.edu/itase/index.html) project.
Acknowledgements
This research is supported by the Institut National des Sciences de l’Univers (INSU, France) program LEFE-CHARMANT. Comments and suggestions by D. Bromwich, S. Takahashi and K. Fujita helped to improve this paper.