


1. Introduction
Humanoid robots are of interest in current research due to their potential for assisting humans in daily life activities and completing complex tasks in dangerous environments. The robot’s ability to mimic human motion, along with its multimodal communication skills, helps in performing tasks in collaboration with humans. Recent research on humanoid robots involves different fields such as hardware development [Reference Ficht and Behnke1–Reference Knabe5], artificial intelligence [Reference Viceconte, Camoriano, Romualdi, Ferigo, Dafarra, Traversaro, Oriolo, Rosasco and Pucci6, Reference Hopkins, Leonessa, Lattimer and Hong7], bipedal locomotion [Reference Nishiwaki, Kagami, Kuniyoshi, Inaba and Inoue8, Reference Hopkins, Griffin, Leonessa, Lattimer and Furukawa9], and teleoperation [Reference Dafarra, Darvish, Grieco, Milani, Pattacini, Rapetti, Romualdi, Salvi, Scalzo, Sorrentino, Tomé, Traversaro, Valli, Viceconte, Metta, Maggiali and Pucci10] which all require various of levels of interaction with the surrounding environment. These interdisciplinary research technologies provide an innovative approach, constantly shaping the growth of humanoid robotics. However, there are some challenges that still need to be addressed in the research of humanoids. Most of the current platforms are either still in the research phase and are commercially unavailable, or are too expensive to be used for research. Therefore, most humanoid research is found using only simulations or smaller robots in scaled-down environments. These results are not always suitable to translate into practical applications, due to the size and lack of realistic imitation of a real-world environment meant for humans.
Several existing platforms can be found in the literature starting from the world’s first full-scale anthropomorphic robot, WABOT-I (WAseda robot-1) developed in 1973 [Reference Takanishi11]. In 1996, the research on humanoid robots became remarkably popular with the introduction of P2, P3, and ASIMO developed by HONDA R&D Co., Ltd. [Reference Sakagami, Watanabe, Aoyama, Matsunaga, Higaki and Fujimura12]. In 2002, The Technical University of Munich developed Johnnie [Reference Loffler, Gienger and Pfeiffer13], and the University of Tokyo developed H6 [Reference Nishiwaki, Sugihara, Kagami, Kanehiro, Inaba and Inoue14] and H7 [Reference Nishiwaki, Kagami, Kuniyoshi, Inaba and Inoue8]. HRP-2P has been developed by the Japanese National Institute of Advanced Industrial Science and Technology and Kawada Industries, Inc [Reference Kaneko, Kanehiro, Kajita, Yokoyama, Akachi, Kawasaki, Ota and Isozumi15, Reference Fujiwara, Kanehiro, Kajita, Yokoi, Saito, Harada, Kaneko and Hirukawa16]. In 2005, a 41-degree of freedom (DOF) humanoid robot, KHR-2, was developed by Kim et al. from the Korea Advanced Institute of Science and Technology [Reference Kim, Park, Lee, Kim, kyu Cho and Oh17]. The research and development of humanoids have focused on understanding the safe interaction of robots with humans for assisting in a variety of tasks. Ficht and Behnke [Reference Ficht and Behnke1] and Saeedvand et al. [Reference Saeedvand, Jafari, Aghdasi and Baltes18] presented a review on the development of optimal design techniques as well as advantages and disadvantages of the technologies used in existing humanoids. Early robots were involved in the industrial and manufacturing units to perform tasks like welding, part assembly, etc., but more recent humanoids are used for a wider range of applications, especially along with helping people in day-to-day life. With technological advancement, humanoid robots are being widely used as social robots in the field of healthcare to assist in rehabilitation, therapy, autism [Reference Saleh, Hanapiah and Hashim19] as well as diabetics [Reference Lau, Chee, Chow, Wong, Cheng and Lau20], cancer and cerebral palsy [Reference Choudhury, Greene, Perumalla and Li21] patients. This spread of applications is due to the change in the economic paradigm from mass production to small quantity batch production by diverging the concept of people in the use of humanoids.
In 2015, the Defense Advanced Research Projects Agency (DARPA) generated massive interest in the field of humanoid robots by organizing the DARPA Robotics Challenge. The main aim of the challenge was to develop a semi-autonomous humanoid robot capable of performing disaster recovery tasks in dangerous, degraded, human-engineered environments. In this worldwide competition, 25 teams and their powerful humanoid robots attempted to perform eight tasks in actual disaster situations, that is, “Driving,” “Egress,” “Door,” “Valve,” “Wall,” “Surprise,” “Rubble,” and “Stairs” under a time constraint [Reference Krotkov, Hackett, Jackel, Perschbacher, Pippine, Strauss, Pratt and Orlowski22]. The popular humanoids evolved from this competition are WALK-MAN [Reference Negrello, Garabini, Catalano, Kryczka, Choi, Caldwell, Bicchi and Tsagarakis23], JAXON [Reference Kojima, Karasawa, Kozuki, Kuroiwa, Yukizaki, Iwaishi, Ishikawa, Koyama, Noda, Sugai, Nozawa, Kakiuchi, Okada and Inaba24], ESCHER [Reference Hopkins, Griffin, Leonessa, Lattimer and Furukawa9, Reference Knabe, Seminatore, Webb, Hopkins, Furukawa, Leonessa and Lattimer25], THORMANG [Reference Park, Cho, Choi and Park26], Hydra [Reference Ko, Kaminaga and Nakamura27], and the upgrade of standard platforms such as HRP-2 and HRP-2Kai [Reference Kaneko, Morisawa, Kajita, Nakaoka, Sakaguchi, Cisneros and Kanehiro28] or DRC-HUBO+ [Reference Jung, Lim, Bae, Lee, Joe and Oh29]. The hydraulically actuated humanoid robot, DRC-Atlas [Reference Ackerman30], by Boston Dynamics was used by teams without their own humanoid as a research platform. After the DRC, other advanced humanoid robots such as E2-DR [Reference Yoshiike, Kuroda, Ujino, Kaneko, Higuchi, Iwasaki, Kanemoto, Asatani and Koshiishi31], TALOS [Reference Stasse, Flayols, Budhiraja, Giraud-Esclasse, Carpentier, Mirabel, Prete, Souères, Mansard, Lamiraux, Laumond, Marchionni, Tome and Ferro32], Next-Atlas and HRP-5P [Reference Kaneko, Kaminaga, Sakaguchi, Kajita, Morisawa, Kumagai and Kanehiro2], TESLA Optimus Bot [33], LARMbot 2 [Reference Russo, Cafolla and Ceccarelli34], Agility Robotics Digit [35], iCub [Reference Viceconte, Camoriano, Romualdi, Ferigo, Dafarra, Traversaro, Oriolo, Rosasco and Pucci6, Reference Dafarra, Darvish, Grieco, Milani, Pattacini, Rapetti, Romualdi, Salvi, Scalzo, Sorrentino, Tomé, Traversaro, Valli, Viceconte, Metta, Maggiali and Pucci10], and Institute of Human and Machine Cognition (IHMC) Nadia [36] were released. In particular, the LARMbot 2 is an open-source humanoid robot with parallel actuators that primarily uses additive manufacturing for fabricating its structural components, but is only 0.4 m in height which significantly lowers the actuation constraints [Reference Russo, Cafolla and Ceccarelli34]. While these robots are capable of tremendous dynamic feats, many of them are either child sized with lower power to weight requirements or full-sized and weigh 65+ kg. As the weight of the humanoid robot increases, the dynamic capability decreases and the amount of untethered operation time (operating from battery storage) decreases. The famous dynamic robot Atlas, which is capable of running, jumping, and completing back flips, can only operate in these scenarios for minutes at a time. Even Digit, the lightest “full-sized” humanoid robot at 45 kg, can only operate from 1.5 to 3 h depending on the task [35]. Therefore, there is a need to lower the weight design of humanoid robots for industrial as well as research applications for more realistic run time scenarios. Hence, the research gap can be summarized as follows:
-
• Most humanoid robot platforms are higher weight (65+ kg), which limits the overall dynamic capabilities and operation time.
-
• High knowledge requirement and time investment for manufacturing and assembly of humanoid robots which typically contain dozens of small, complex mechanical linkages.
-
• A lack of readily available flexible, cost-effective, and open-source humanoid robotic platforms for bipedal developers and researchers.
The Terrestrial Robotics and Controls (TREC) Lab at Virginia Tech has a history of exploring and developing humanoid robots, the first generation of work beginning with the autonomous firefighting robot SAFFiR in 2013 [Reference Lahr, Orekhov, Lee and Hong3, Reference Lahr4]. The first and second generation of TREC humanoids, THOR [Reference Hopkins, Leonessa, Lattimer and Hong7, Reference Hopkins, Ressler, Lahr, Leonessa and Hong37] and ESCHER [Reference Hopkins, Griffin, Leonessa, Lattimer and Furukawa9, Reference Knabe, Seminatore, Webb, Hopkins, Furukawa, Leonessa and Lattimer25], were funded by the Office of Naval Research as a firefighting robot and participating in the DARPA competition in 2015. Previous generations of TREC humanoids utilized traditional machining techniques, making them expensive to fabricate and tedious to build. Thus, the third generation humanoid PANDORA (3D-Printed Autonomous humaNoid Developed for Open-source Research Applications) is designed using additive manufacturing methods to lower overall cost, raise power to weight ratio, and increase performance capabilities. Due to use of lighter structural pieces, the weight reduction of PANDORA is around 29% and 42% as compared to the earlier versions THOR [Reference Hopkins, Leonessa, Lattimer and Hong7, Reference Hopkins, Ressler, Lahr, Leonessa and Hong37] and ESCHER [Reference Hopkins, Griffin, Leonessa, Lattimer and Furukawa9, Reference Knabe, Seminatore, Webb, Hopkins, Furukawa, Leonessa and Lattimer25], respectively. Broadly speaking, PANDORA and Digit are the lightest robots in their height class at 45 kg, where PANDORA will be 0.3 m taller [35]. In this work, the design of the full body of PANDORA is presented with an emphasis on the development and analysis of the lower body of the robot. The main contributions of this work are highlighted as:
-
• The overall mass is estimated to be 45 kg with 22.5 kg in the lower body, which, to the authors’ knowledge, make PANDORA one of the lightest, full-sized humanoid robots in the world.
-
• The mechanical design of PANDORA is significantly simpler and less time consuming to build when compared to other humanoid robots which require expert machinists for fabrication and multiple individuals for assembly.
-
• A focus on an additive manufactured design enables design flexibility and rapid prototyping while also being cost-effective.
-
• The mechanical design CAD and other design details are available in the open-source TREC Public GitLab website ( https://gitlab.com/trec-lab ), which, to the author’s knowledge, is one of the only open-source full-sized humanoid robot.
In Section 2, the overview of the full-body design of PANDORA will be presented including DoFs, actuators, and other electronics along with the control architecture. The manufacturing method and material used for the fabrication of different parts of PANDORA are discussed in Section 3 along with its advantages over other traditional methods. In Section 4, the design and development of the lower body of PANDORA will be investigated including the three joint configuration as well as the three major structural parts. This section also includes the overall assembly of the lower body of the robot along with its maximum range of motion (ROM). In Section 5, the dynamic analysis is examined by simulating possible actuators forces for the lower body of PANDORA. Finally in Section 6, finite element analysis (FEA) is performed for the different structural parts of the lower body of PANDORA showing the induced stresses by standard loads, followed by conclusions and future scope of the present work in Section 7.
2. Overview of PANDORA
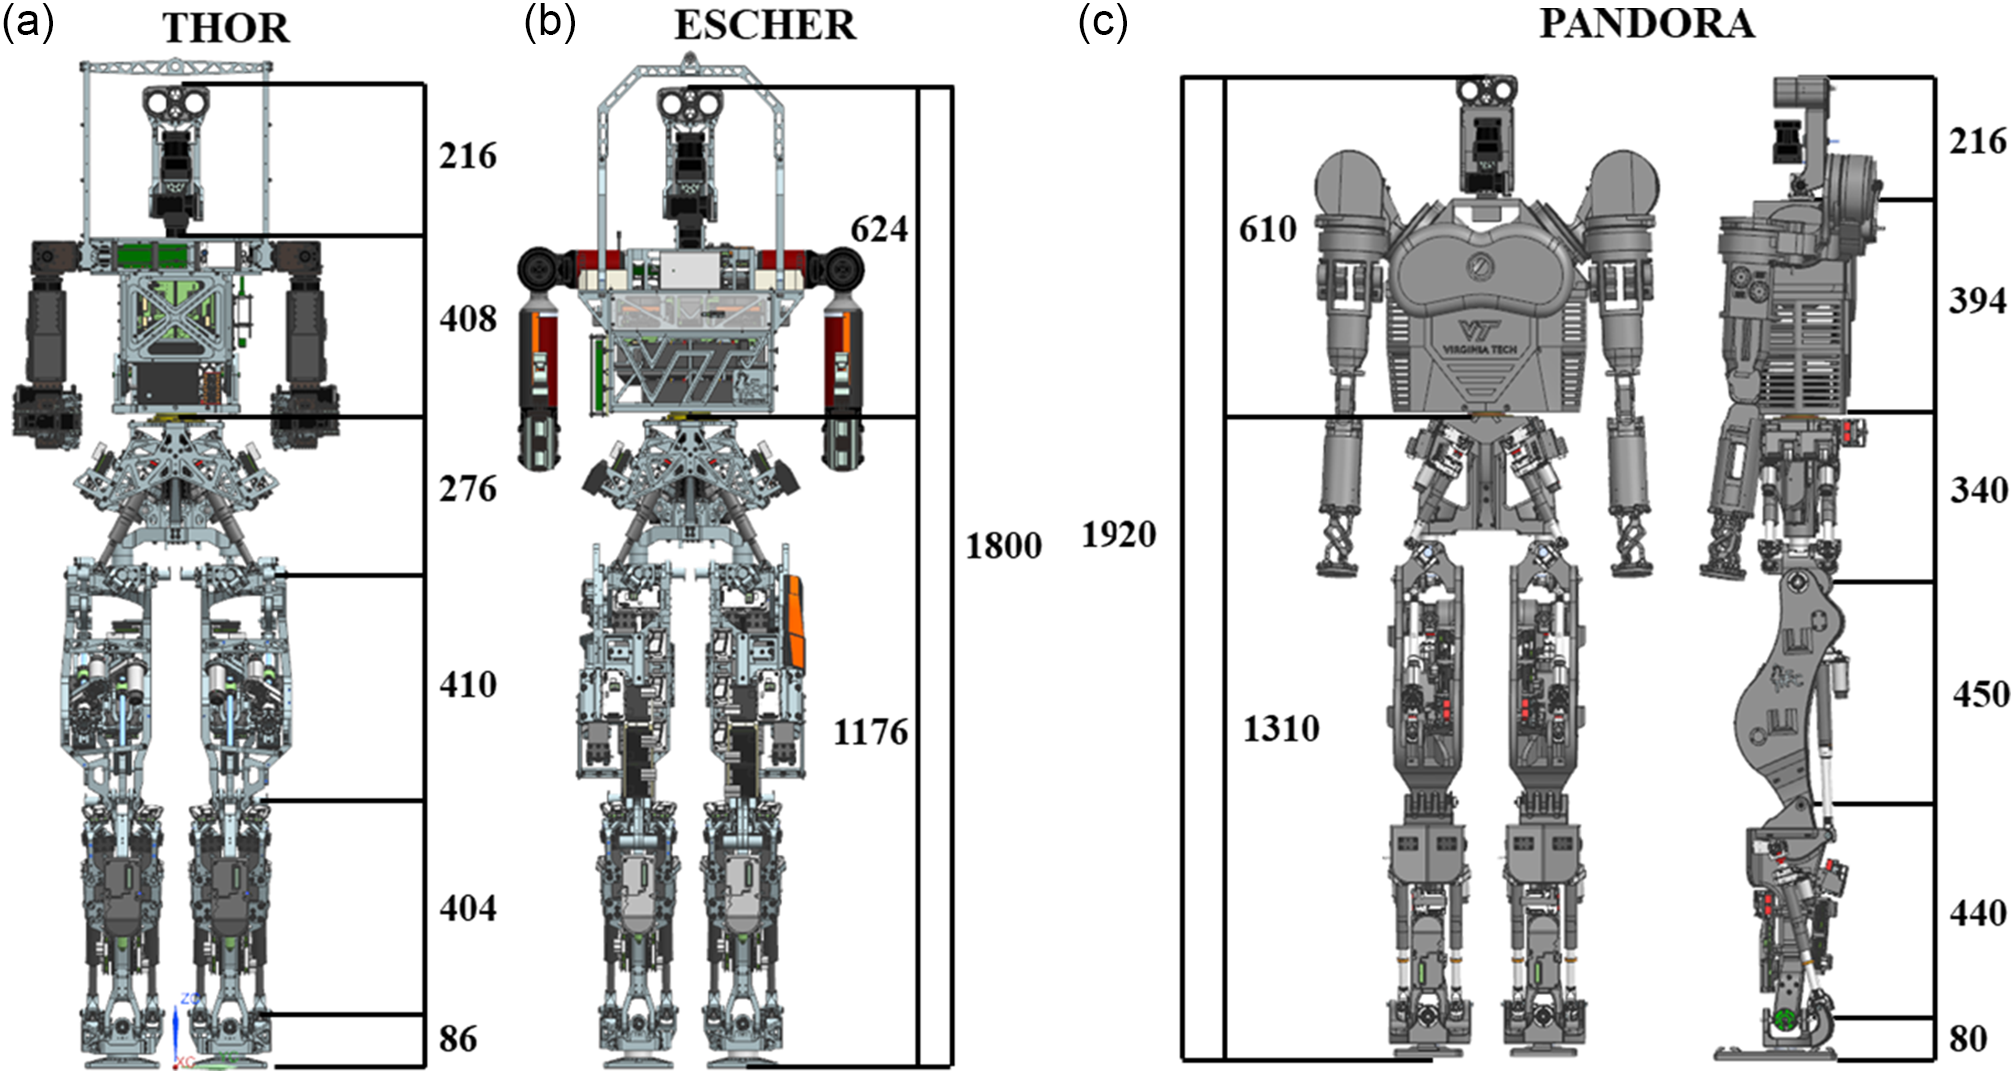
PANDORA is a full-scale, 3D-printed humanoid robot, shown in Fig. 1(c), with a design drawing inspiration from earlier versions of humanoids designed by the TREC Lab, THOR (Fig. 1(a)) and ESCHER (Fig. 1(b)). Compared to its predecessors, PANDORA has fewer components, since many structural elements are combined during the design process by utilizing additive manufacturing. Due to the advantage of additive manufacturing over traditional manufacturing methods, complex structures can be easily fabricated that are otherwise impossible to produce with traditional subtractive manufacturing methods. As a result, the lower body of PANDORA contains only 186 structural elements while THOR and ESCHER required 510 and 460 elements, respectively, which reduces the complexity of the assembly of the robot. Table I compares the height, mass, and DoFs of popular humanoids in literature, including those from TREC lab, with PANDORA for understanding the different levels of complexity.
Height, mass, and DoF comparison of humanoids.

Comparison of (a) THOR and (b) ESCHER with (c) PANDORA (scale is in mm).
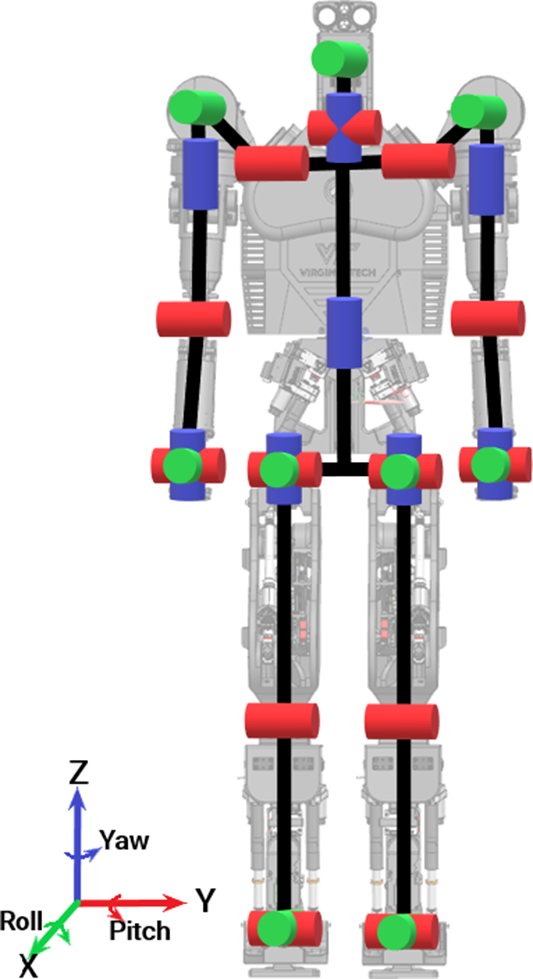
The robust design and use of additive manufacturing make PANDORA advantageous over other humanoids in terms of cost-effectiveness and high power-to-weight ratio. Utilization of 3D printing technology makes it easy to manufacture, assemble, and streamline modifications in case of a structural fault. Additive manufacturing has made it easy to design mounting holes for sensors, batteries, motor controllers, and computers directly into PANDORA’s chassis, rather than using complex mounting brackets and more screws. The main hardware components and overall specifications of PANDORA are summarized in Table II.
The frame of PANDORA is a series of complex parts that take full advantage of the layer-by-layer build process of additive manufacturing over subtractive manufacturing. While the 3D-printed structure is lightweight, it is designed to accommodate walking and perform dynamic motion while maintaining the same power output of its predecessors. There are at most four bolts holding any two major structural pieces together, allowing for reduced maintenance time, assembly time, and downtime of the robot. The same linear actuators which were developed in-house for THOR and ESCHER [Reference Knabe5, Reference Knabe, Seminatore, Webb, Hopkins, Furukawa, Leonessa and Lattimer25] have been used for actuating the PANDORA’s joints reducing the overall cost of the robot. In the following subsections, we discuss important design aspects of PANDORA including DoFs, actuators, robot electronics, and control architecture.
2.1. Degrees of freedom
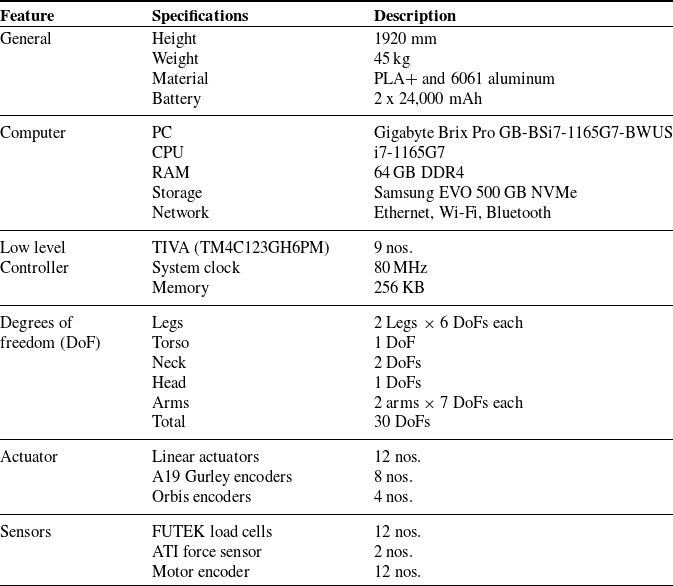
PANDORA has been developed with 30 DoFs to allow for mimicking various forms of human motion such as walking, handshaking, and running. The lower and upper body of PANDORA consists of 12 DoFs and 18 DoFs, respectively. For the lower body of PANDORA, each leg has six total DoFs: three DoFs in the hip with roll-pitch-yaw joints, one DoF in the knee with pitch joint only, and two DoFs in the ankle with roll-pitch joints. In the upper body, there are two DoFs in the neck with pitch-yaw joints, one DoF in the head with a roll joint, and one DoF in the torso with a yaw joint. Each arm has seven total DoFs: three DoFs shoulder with roll-pitch-yaw joints, one DoF elbow with pitch joint only, and three DoFs wrist with a roll-pitch-yaw joint. Fig. 2 shows the DoFs configuration of PANDORA with green, blue, and red colors in the joints for the roll, pitch, and yaw motions, respectively. The number of DoFs does not account for the manipulator at each arm due to the design allowing for the addition of any manipulator required to complete a given task.
Overall specifications of PANDORA.
2.2. Actuators
The joint specifications of PANDORA consider the constraints such as the maximum motor speed, the permissible maximum input rotational speed, and the efficiency of each transmission system. As displayed in Fig. 3, custom electromechanical linear actuators were designed in-house for THOR and ESCHER [Reference Knabe5, Reference Knabe, Seminatore, Webb, Hopkins, Furukawa, Leonessa and Lattimer25] and have been repurposed to actuate the lower body of PANDORA. These actuators are equipped with a Maxon brushless motor geared to a 1:3 ratio on a high-precision ball screw. The torque from the motor to the ball screw is transmitted using a reinforced belt. The linear actuators enable low-impedance control for each joint in the lower body using linear-to-rotary and parallel mechanisms. Each DoF in the lower body of PANDORA is actuated by one or two linear actuators arranged in a serial or parallel configuration. The universal joint at the top of the actuator provides two DoFs and the connecting rods are pinned to the bottom providing one or two DoFs depending on the limb joints. For example, the connecting rod from the actuator has two DoFs to the ankle joint due to the roll-pitch motion and one DoF to the knee joint due to only a pitch motion. Each actuator is equipped with a FUTEK load cell to give feedback to the controller of the output force.
DoF configuration of PANDORA.
Main components for linear series actuators which drive the joint motion of PANDORA.

2.3. Robot electronics
The linear actuators have a 48 V Maxon EC 4-pole 200 W brushless motor controlled using the Advanced Motion Controls AZBDC12A8 analog servo drive capable of 6 A continuous and 12 A peak current. The drive is controlled using a PWM and high/low direction input representing a current command output to the motor. The motor has a quadrature encoder suitable for measuring motor position and estimating motor velocity. The actuator uses a Futek LCM200 in-line load cell to measure the output force of the actuator up to 2225N in tension and compression. The joint positions are measured using two different absolute encoder models: the Gurley A19 (16 bits) and Orbis (14 bits) absolute encoder.
PANDORA uses a distributed control structure broken into a high-level controller and several low-level controllers. The low-level controller is responsible for collecting sensor data (1000 Hz), communicating sensor measurements with the high-level controller (500 Hz), checking safety conditions (1000 Hz), and executing commanded joint torques from the high-level controller (1000 Hz). The Texas Instruments Tiva ARM Cortex-M4F TM4C123GH6PM microcontroller with an 80 MHz clock speed is chosen for the low-level controller.
Each microcontroller is responsible for communicating with two sets of sensors and controlling two actuators, that is, two absolute encoders, two load cells, two quadrature encoders, and controlling two motors. Additionally, CAN communication is utilized to collect sensor feedback from the six-axis Force/Torque ATI (MINI45) transducers for measuring ground reaction forces and torques. An in-house shield is used to interface the sensors with the microcontroller. An AB&T EasyCAT Shield is used to communicate via EtherCAT (Ethernet for Control Automation Technology) with the high-level controller. Further details of the low-level controller design can be found in Herron et al. [Reference Herron, Fuge, Kogelis, Tremaroli, Kalita and Leonessa39] and Kogelis et al. [Reference Kogelis, Fuge, Herron, Kalita and Leonessa40].
The focus of the electronics used in PANDORA is to develop a low-cost platform that can reduce the complexity without compromising on performance. The high-level controller will be stored within PANDORA’s chest in a small computing unit with an Intel Core i7-1165G7 processor and the maximum possible operating frequency 3.2 GHz. The system will have 64 GB of RAM and 500 GB of solid state drive storage. Due to real-time thread execution requirements, the high-level controller runs the Ubuntu 20.04 Linux OS. With a goal of operating untethered, the robot will be limited to the onboard specifications, but these will be improved as necessary. If even more computational power is needed, there will be enough space inside the robot torso to fit a Mini-ITX board with a GPU.
2.4. Control architecture
PANDORA utilizes a distributed control strategy separating the high and low-level controllers to complete control strategies described in Welch et al. [Reference Welch, Runyon, Beiter, Herron, Kalita and Leonessa41]. The low-level controller is written in C, operating at the hardware abstraction layer. This programing requires extensive knowledge of the microcontroller’s hardware architecture, real-time execution capabilities, and memory management for effective implementation. Further details of the low-level software are described in Tremaroli et al. [Reference Tremaroli, Stelmack, Herron, Kalita and Leonessa42].
The high-level controller is written in Java using the TREC Robotics Software (TRS) designed by our laboratory and Open Robotics Software (ORS) designed by the IHMC. ORS contains the whole-body controller and additional legged locomotion algorithms for humanoids and exoskeletons and a simulation environment for rigid-body dynamics [43]. ORS contains an extensive list of additional tools for robotic applications such as perception interfacing, trajectory optimization, ROS communication, and manipulation planning. The TRS contains runtime starters and tools for interfacing with our robots in real time.
3. Manufacturing method
The design of PANDORA focuses on the utilization of additive manufacturing to create complex and rugged parts. The type of additive manufacturing used for fabricating the parts of PANDORA is fused filament fabrication (FFF) utilizing consumer-grade printers and filaments. FFF is the process of fusing each layer by the melting of thermoplastics. These thermoplastics range from ABS, PLA, PETG, Nylon, and many other filament types and combinations that can be infused with wood dust, carbon fiber, and glass fiber. In our development, a specific variant of PLA material called PLA+ is used for fabricating the parts of PANDORA. This variant holds extra additives that allow for better strain and stress elasticity along with material properties in comparison to normal PLA which is brittle with lower impact stress. ABS, another popular 3D printing material, is not recommended due to the safety concerns regarding small particles that are released due to the high print temperature of 210C while operating within an enclosed space such as a laboratory environment without proper ventilation [Reference Min, Li, Wang, Chen, Ma, Hu, Liu and Jiang44, Reference Zhang, Pardo, Rudich, Kaplan-Ashiri, Wong, Davis, Black and Weber45].
The choice of the 3D printing material is only the first step toward the advanced manufacturing of PANDORA since there needs to be equipment able to produce the parts for the robot at low cost and without sacrificing the integrity of the final parts. The parts are fabricated using a CREALITY 3D Printer (Model: CR-10S Pro) with a build volume of 300 $\times$
300
$\times$
300 $\times$
400 mm. The large bed size allows the printing of the larger parts of PANDORA, such as the waist or thigh, as a single piece, reducing the complexity in the design when considering part count compared to conventional aluminum robots. The CR-10S Pro costs about US$500, making it more affordable compared to other options with similar specifications. There are several options for the material on the CR-10S Pro printer that can be found at an affordable cost which makes it more advantageous compared to the other 3D printers with limited material availability. The general maintenance cost of this printer is around US$30 after printing all the large structural parts of PANDORA, equating to a total of 1500 h of print time. The longest 3D print of the 1500-h total print time is 336 h (14 days) for the waist; therefore, a new robot could be completed as quickly as in 14 days if multiple printers are used. The parts of the lower body of PANDORA are printed using ESUN PLA+ material at a cost of US$22 per 1 kg spool which provides a cost of US$220 for the whole lower body of the robot.
$\times$
400 mm. The large bed size allows the printing of the larger parts of PANDORA, such as the waist or thigh, as a single piece, reducing the complexity in the design when considering part count compared to conventional aluminum robots. The CR-10S Pro costs about US$500, making it more affordable compared to other options with similar specifications. There are several options for the material on the CR-10S Pro printer that can be found at an affordable cost which makes it more advantageous compared to the other 3D printers with limited material availability. The general maintenance cost of this printer is around US$30 after printing all the large structural parts of PANDORA, equating to a total of 1500 h of print time. The longest 3D print of the 1500-h total print time is 336 h (14 days) for the waist; therefore, a new robot could be completed as quickly as in 14 days if multiple printers are used. The parts of the lower body of PANDORA are printed using ESUN PLA+ material at a cost of US$22 per 1 kg spool which provides a cost of US$220 for the whole lower body of the robot.
Number of parts in the lower body of PANDORA, ESCHER, and THOR.

The largest advantage of this type of printer is the flexibility to use open-source slicing software such as Ultimaker Cura, which allows selection for the layer thickness, wall count, temperatures, infill types, support types, and densities. The print settings have been chosen for PANDORA after stress testing and impact testing of the parts. The infill used for the printing of the parts is the cubic infill ranging with an infill percentage between 25% and 30% with a minimum of a 4 wall thickness used throughout the parts. The breakable supports are a more economic option to soluble support material and can be further reduced by using custom supports or placing supports only where necessary. These breakable supports can then be further modified to have thin walls that are easier to break which reduces the waste of material and part cleaning time. The customizability within the Cura software allows for many adjustments that helps to conserve filament, reduce print time, and decrease cleaning time while making a strong finished product.
A major advantage of 3D printing over traditional manufacturing is that the part can be left unattended for much of the print, whereas traditional manufacturing of specialty parts such as those used in humanoid robots would need the attention of a machinist throughout the process. Through the use of additive manufacturing, there is a reduction of around 50% in the total number of parts needed to be assembled for PANDORA in comparison to its earlier metal versions THOR and ESCHER. Thanks to this advantage, the complexity of building PANDORA is reduced significantly, and it can be assembled quickly. A detailed comparison between PANDORA with its earlier versions, THOR and ESCHER, in terms of the number of parts in the lower body of the robots is shown in Table III.
4. Design of the lower body of PANDORA
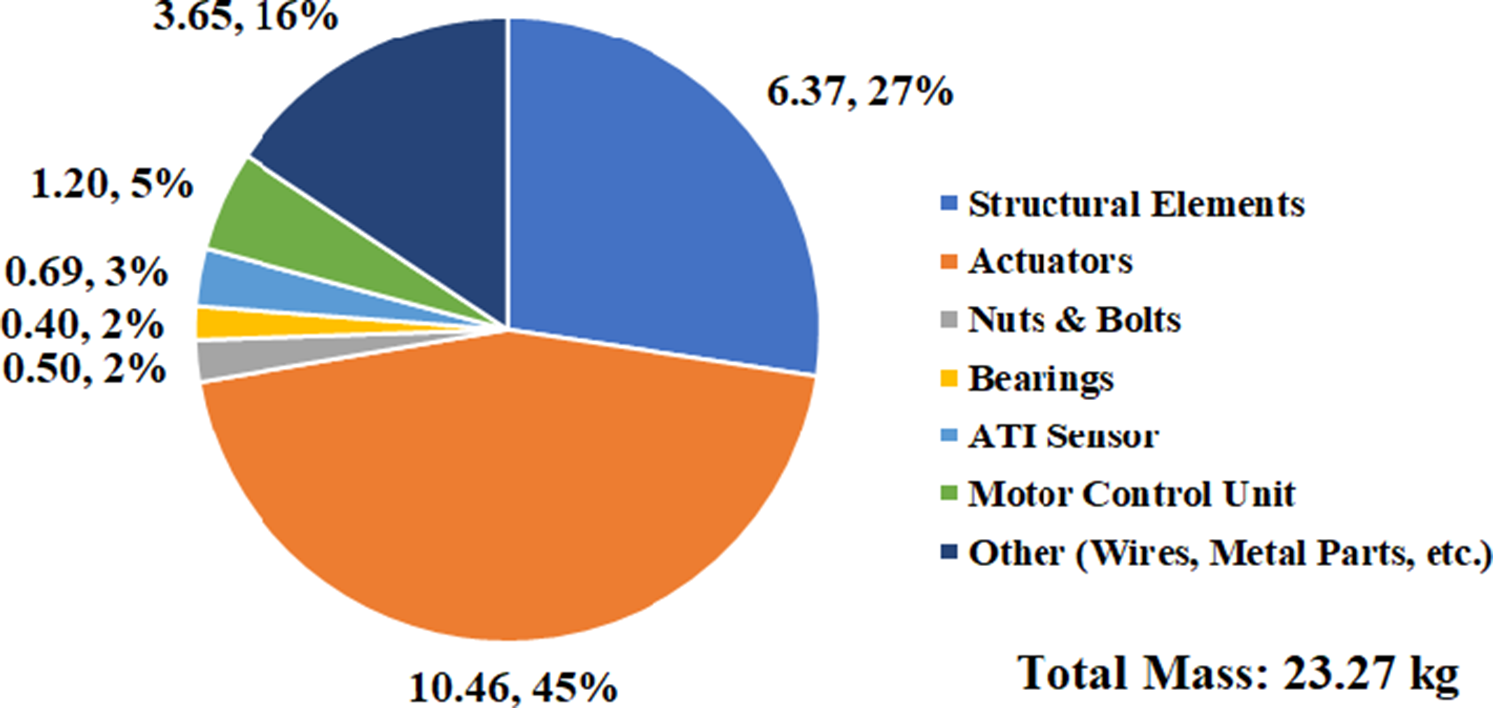
The total mass for the lower body of PANDORA has been measured to be 23.27 kg, where Fig. 4 displays the breakdown. An important note is that the structural (3D printed) components only amount to 6.40 kg (27% of total mass). The actuators amount to 10.46 kg (45% of the total mass) where an additional 3.65 kg (16% of total mass) is a combination of wires, additional metal components, and miscellaneous electronics. As discussed in [Reference Welch, Runyon, Beiter, Herron, Kalita and Leonessa41], a common approach for robot modeling is to use open-kinematic chains to utilize fast dynamic algorithms such as Featherstone for runtime operation. In this case, the actuators are significant dynamic elements in relation to the total overall mass because a majority of the structural elements are 3D-printed instead of aluminum, steel, or titanium. However, properly modeling the actuators into the dynamic equations would break the open-kinematic chain assumption. Thus, this mass distribution presents a significant modeling challenge which will be addressed in future work.
Mass (kg) distribution for the lower body of PANDORA.
This section primarily focuses on the design and fabrication of the 3D-printed (27% in Fig. 4) joints and structural parts of the lower body of an in-house developed humanoid, PANDORA. The inspiration for the lower body of PANDORA has been drawn from human locomotion mechanics to mimic the capabilities of the human lower body. The design consists of three main joints, hip, knee, and ankle, as well as three main structural parts, pelvis, thigh, and shin, creating a 12 DoFs lower body of PANDORA. The lower body design includes the study of kinematics, dynamics, maximum ROM, and a design focused on manufacturability and assembly. The design exhibits the flexibility to provide the highest ROM, reducing overall structural weight through additive manufacturing, and optimizing the overall structure through part reduction. The design configurations for various joints in addition to structural parts of the lower body of PANDORA are discussed in the following subsections.
4.1. Joint configuration
The three primary joints of the lower body of PANDORA have been designed to mimic human movement for achieving a similar ROM. These designs are integrated with a mixture of additive and subtractive manufacturing for reliable, smooth motion, and uniform tolerance throughout the three joints. In the following subsections, the design and configurations of hip, knee, and ankle joints have been explained which results in six DoFs in each leg of PANDORA.
4.1.1. Hip joint
The design of the hip joint is the most complicated one for PANDORA’s lower body. This joint allows for the addition of three encoders and three linear actuators as shown in Fig. 5 that provides three DoFs at the joint. An aluminum gimble has been attached to the hip joint as shown in Fig. 5(c) which is responsible for the smooth motion with two DoFs in the hip joint using four bearings. The design of the joint includes hard stops to prevent the actuators from operating past the limits of the part and actuator. The two actuators as shown in Fig 5(c) are mounted from the pelvis to the thigh bracket for controlling the yaw and roll motion. The pitch motion comes from a linear actuator mounted inside the thigh going to the thigh bracket (Fig 5(a)). The pitch motion is one of the most complicated to achieve because when the actuator retracts, the thigh moves forward and when the actuator extends, it pushes the thigh back.
Hip joint of PANDORA: (a) front view, (b) back view, (c) isometric view, and (d) actual part.

Hence, the selection of the correct linear actuator is crucial in terms of length and placement, to achieve the desired ROM for the pitch of the entire leg. The joint design introduces the use of threaded brass inserts that are melted into the plastic to prevent the screw holding the actuator from pulling the threaded insert through the part when torqued. Aluminum is used because the stresses that arise in the joint cause the meeting point between the thigh and the pelvis to rub against each other and if made of plastic, the two sides would gouge into each other. Each joint requires its own encoder and the design allows the two Gurley encoders (Fig. 5(a)) to be protected within the thigh bracket. This design transition to an actual build is shown in Fig. 5(d) showing the hip joint in detail using the thigh bracket to bring everything together.
4.1.2. Knee joint
Figure 6 shows the knee joint which is one DoF pin joint connecting the 3D printed thigh and shin together. There are three screws clamping the steel pin in Fig. 6(c) to the thigh side of the knee slightly compressing the 3D printed part onto the shaft to prevent slipping. The shaft passes through the brass bushings on the shin side of the knee. These brass bushings are melted into the shin side of the knee to create a straight, concentric joint that allows the knee to rotate smoothly with minimal friction. The design and intricate assembly of the knee joint guarantees a low friction rotation of two major parts, that is, the thigh and the shin. A built-in feature is the hard end-stop designed into the thigh side of the knee to prevent the actuator from overextending by increasing the friction exponentially as the knee pushes toward the maximum range. A specially designed indent on the back side of the thigh and upper knee allows the knee actuator to fold into the part to achieve a greater ROM as shown in Fig. 6(b) on the back side. The encoder utilized at this joint changes from a Gurley to an Orbis one (Fig. 6(a)), to ensure that if bumped the encoder will not be broken off. The actual knee in Fig. 6(d) demonstrates the clean joint of the knee with the multiple connecting points on the upper and lower half giving a tight fit with no flex or backlash in the design.
Knee joint of PANDORA: (a) front view, (b) back view, (c) isometric view, and (d) actual part.

4.1.3. Ankle joint
The ankle joint consists of roll and pitch motion with four main components: an aluminum joint, an ATI force sensor, a 3D printed ankle, and a 3D printed foot, as shown in Fig. 7. An aluminum bearing holder is used to achieve the tight fit between the connection of the shin and ankle gimble along with 3D printed parts. The bearing holder reduces the joint inconsistency caused by the layer lines of 3D printing thin wall cylinders and distributes the weight over a greater area when the full weight of the robot is transmitted through the foot. In addition, the bearing holder adds rigidity and strength to the parts while securely holding the bearings in a set location. The design transmits all the stresses from the two linear actuators (Fig. 7(a)) through the curved back pieces, and the entire weight of PANDORA through the center structure. The curved surfaces with mounted linear actuators have been designed with some compliance and flex under high loads. The curves in the 3D printed parts allow for better stress distribution throughout the part, where a corner would create stress concentration that leads to ultimate failure and lower forces. The electronics within the ankle use two encoders: an Orbis on the side (Fig. 7(c)) and a Gurley on the back. The ATI force sensor in Fig. 7(b) is fitted into a groove in the foot and ankle to hold it in place for accurate ground force reaction measurements. The actual design of PANDORA’s ankle joint shown in Fig. 7(d) having a mix of additive and subtractive parts creating a strong and high tolerance joint.
Ankle joint of PANDORA: (a) front view, (b) back view, (c) isometric view, and (d) actual part.

4.2. Structural configuration
The structural parts of the lower body of PANDORA primarily consist of three major components, pelvis, thigh, and shin, which are manufactured using a Creality CR-10 3D Printer. These are relatively large parts, extending up to 400 mm on their longest axis and taking over 9 days to print. Each part is designed in a way to fully utilize space to mount actuators, electronics, and calibration parts necessary for operating the joints and the overall robot. The details of these structural parts are explained in the following subsections.
4.2.1. Pelvis
Figure 8 shows the design of the pelvis which supports five different actuators for controlling five DoFs of PANDORA along with joint mounting and electronics. Four of the linear actuators (two per side) attach to the thigh bracket as shown in Fig. 8(a) which are responsible for the respective hip joint roll and yaw motions. The fifth actuator, a DYNAMIXEL H54-200-S500-R, is placed inside the pelvis of the robot and is responsible for the yaw motion of the torso. Additional hardware accommodated by the design of the waist includes an IMU, two Gurley encoders (Fig. 8(a)), two low-level controllers (Fig. 8(b)), and four motor controllers (Fig. 8(c)). The two Gurley encoders are utilized to give position information of the legs’ yaw motion. The pelvis is a single 3D-printed piece and connects to both legs with the help of the aluminum joint gimble and rotation plate of the hip joint mentioned in the previous section 4.1.1. The 3D printed orientation of the pelvis ensures that it remains in compression when the weight from the upper body of the robot travels through to the lower body. A feature that the additive design incorporates over the subtractive design is the utilization of calibration brackets as shown in Fig. 8(c). These calibration slots line up to a bracket that works with others along the body to lock out the joints to a “zero” position, allowing to calibrate all encoders simultaneously without using complex methods. The actual design of the pelvis is shown in Fig. 8(d) consisting of actuators and controllers.
Pelvis structure of PANDORA: (a) front view, (b) back view, (c) isometric view, and (d) actual part.

4.2.2. Thigh
The thigh has been designed with a curved structure shown in Fig. 9 to maximize the ROM for the pitch of the hip and knee joints. The curve of the thigh allows a larger ROM in comparison to a straight thigh design by increasing the contracting motion of the knee joint by 20 degrees. This design is advantageous due to a single 3D printed part being used for the full structure as compared to previous generations that used multiple smaller complex aluminum parts screwed together. The extra surface area in the design is utilized to distribute the varying loading conditions throughout the whole structure with no sharp corners to avoid stress concentrations.
Thigh structure of PANDORA: (a) front view, (b) back view, (c) isometric view, and (d) actual part.

The areas that hold the linear actuators use light compression adjusted brackets held by screws utilizing brass inserts melted into the plastic. The utilization of these types of smaller plastic inserts held in by compression creates replaceable parts within the larger body. The cyclical loading and unloading of the actuator causes the plastic to deform making it a necessity within the design to utilize smaller replaceable parts to prevent having to replace larger and longer print-time parts. The electronics for the knee joint actuator and the hip are attached inside the thigh employing slide rails (Fig. 9(c)) that have been printed directly into the thigh. These rails allow for hardware to be interchangeable for testing new control hardware or when the electronics need to be repaired since the board holder slides into place. Currently, these board holders have been designed to accommodate two motor controllers and one low-level controller as shown in Fig. 9(a). The thigh is designed to be easy to maintain with all parts being accessible with just the removal of four screws or utilizing the slide rails for attached electronics. The thigh also has calibration slots (Fig. 9(c)) that allow for two special brackets to work with the previously mentioned bracket in the pelvis for encoder calibration. The actual design in Fig. 9(d) is displayed showing all actuators attached and electronics utilizing the slide rails to connect to the structure.
4.2.3. Shin
Figure 10 depicts the shin design, which accommodates two linear actuators responsible for the two DoFs of the ankle joint, motor controllers, low-level controller, and ATI sensor board. The shin holds the ankle gimble as shown in Fig. 10(c) connected via two separate pieces bolted to the shin structure using the aluminum bearing holder to strengthen the connection point. On the back side of the shin, two motor controllers and a low-level controller are mounted as shown in Fig. 10(b). These controller boards are responsible for controlling the two actuators of the ankle and taking sensor data from various sensors within the shin. The front side of the shin in Fig. 10(a) consists of an ATI sensor board and Tiva with EtherCAT shield for collecting the sensor data from the ATI force/torque transducer, which is used to measure ground reaction force and torques attached to the foot of the robot. Mounting the front ATI sensor board along with the back low-level controller and motor controller benefits from a similar slide system (Fig. 10(c)) that the thigh uses to allow for changes in board design without the need of reprinting of the full shin. These slide rails allow for quick maintenance and modification of electronic components with no infringement on the main structure. The fabricated design in Fig. 10(d) shows the utilization of the slide rails for mounting the electronic boards on both the front and back of the shin along with the two actuators controlling the ankle motion.
Shin structure of PANDORA: (a) front view, (b) back view, (c) isometric view, and (d) actual part.

4.3. Assembly and ROM
The main advantage of PANDORA with respect to its predecessors THOR and ESCHER is the reduction in the total number of parts made possible by utilizing additive manufacturing. This approach results in an easier assembly and a reduction to the build time of PANDORA. This nature of PANDORA makes it unique and flexible among the other available humanoids with their complex structural design along with the requirement of expert manpower for assembly. PANDORA has an assembly time of 8 h with two researchers working with prepared 3D printed parts, this assembly time includes attaching actuators, electrical hardware, and a wiring harness set up for the lower body. The 3D-printed structural elements are prepared by removing the breakable support material and melting brass inserts into the appropriate holes. This 8-hour build time is accomplished leveraging the fact that there are no parts within PANDORA’s design that require more than four screws to attach and tabs for quickly lining up conjoining parts to streamline the assembly process.
The transition from the CAD design to the built lower body of PANDORA is shown in Fig. 11. The CAD design in Fig. 11(a) has been developed so that every bolt, insert, and nut are included in the design to act as a direct assembly guide for the actual robot. This design acts as a direct build guide for assembling PANDORA and maintains an accurate representation of the inertial properties of the real robot. The actual lower body in Fig. 11(b) is in use to develop high- and low-level control techniques for humanoid robots. Each sequential version of PANDORA has added upgrades for easier electronic access and replaceable parts due to wear. Each version has also added tighter tolerances to the design eliminating movement within the joints and cable routing for a finished look. The design is constantly evolving as new 3D printing and novel design optimization techniques are discovered.
PANDORA’s development has focused on achieving a wide ROM to ensure fluid operation within a human environment, where intersecting joints are utilized to emulate the ball and socket joints of humans. These two design constraints, that is, a wide ROM and intersecting joints, have led to the development of compact parts for the joints. The hip bracket is the best example of this design choice because there are three actuators and three pinned joints combined in this single, compact component. These design choices have led to the hip joint having a comparable ROM to that of humans described in [Reference Chaffin and Andersson46] and are displayed in Table IV.
Joint specifications of PANDORA in comparison with human body.

Lower body assembly of PANDORA with (a) CAD model and (b) built model.

Range of motion with CAD model.

The importance of this can be seen in Figs. 12 and 13 where the hip joint is completing a ROM tests pushing the joint to its limit. The second set of intersecting joints is in the ankle, which utilizes a two DoFs intersecting joint connecting the shin to the ankle. The knee is a one DoF joint but has a greater ROM than that of a human (Table IV), where the knee is able to fold up tightly. The range of joint motion is optimized to accommodate the constraints in the robot design and the workspace by considering the physical limits of each joint. The maximum ROM for each joint of PANDORA is limited by mechanical end-stops designed into each respective component. The designed ROM is replicated in Fig. 13 with the real PANDORA, validating the design performance on hardware with wiring considered. A video of the ROM testing of PANDORA is attached in the supplementary materials. This ROM ensures that PANDORA will be able to climb stairs, navigate difficult terrain, and complete other activities requiring joint flexibility. In the next section, a dynamic simulation of PANDORA walking has been performed to estimate the required actuator forces.
Range of motion with built model.

5. Dynamic simulation of the lower body
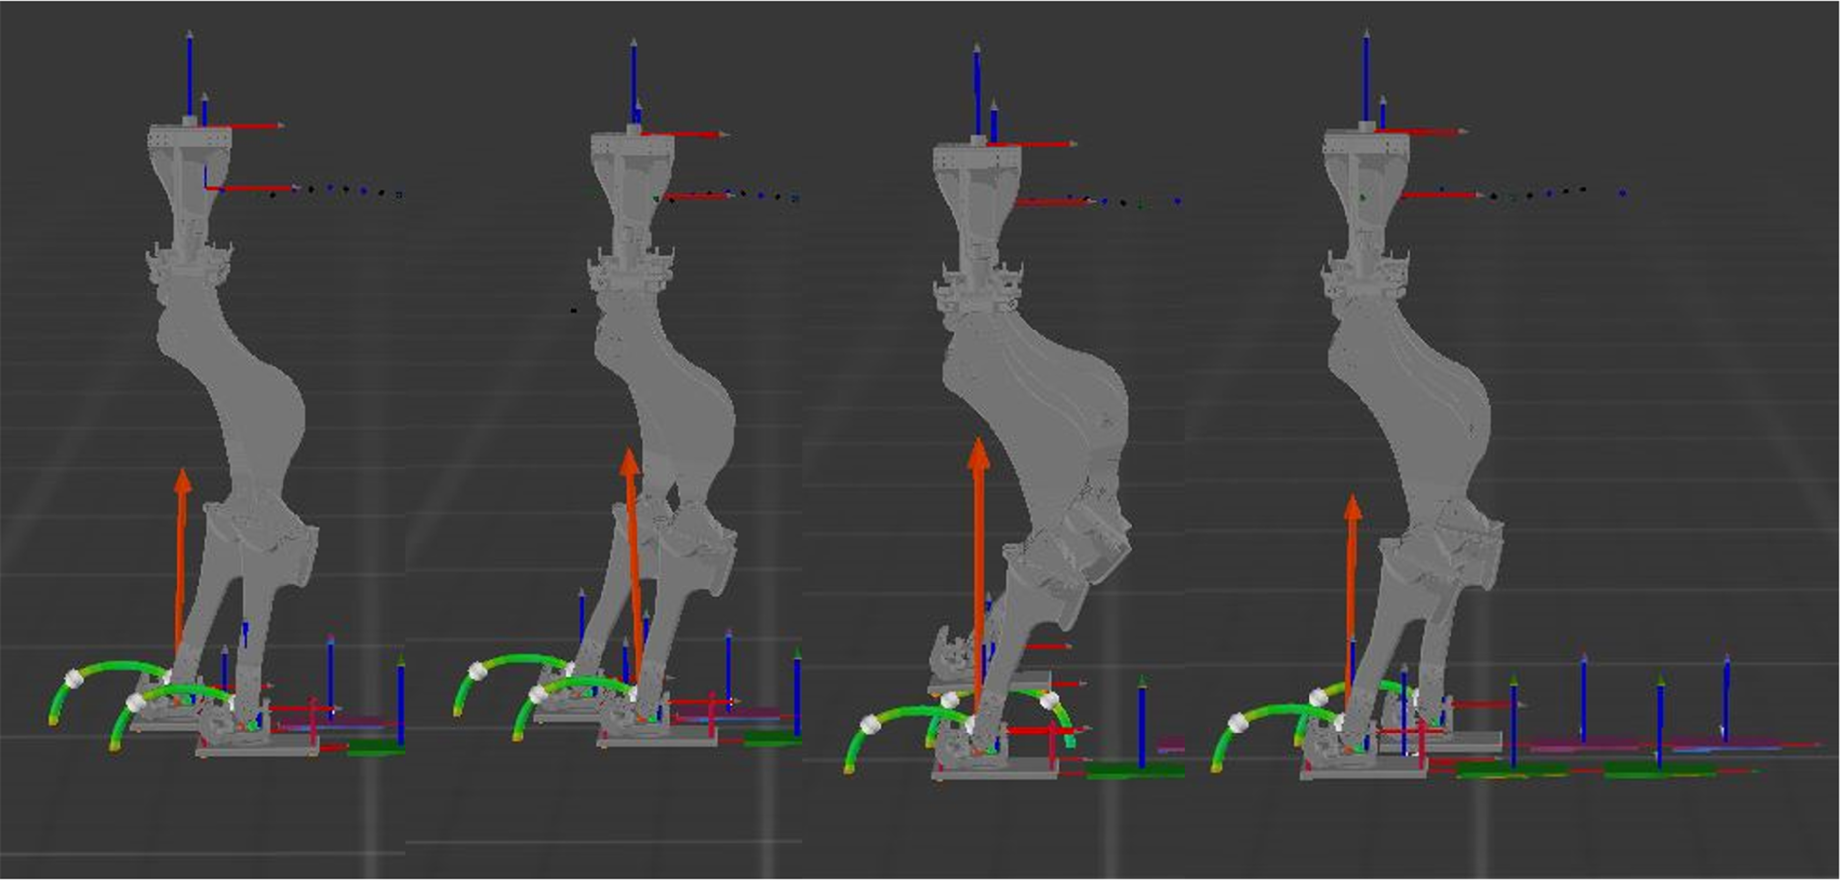
In order to evaluate the performance of this humanoid design, walking simulations on flat ground have been performed to validate joint ROM and joint torque capabilities. PANDORA is controlled in the simulation using whole-body control (WBC), which is a popular control approach applied to many established humanoid robots [Reference Knabe, Seminatore, Webb, Hopkins, Furukawa, Leonessa and Lattimer25, Reference Lee38, Reference Romualdi, Dafarra, Hu and Pucci47, Reference Koolen, Smith, Thomas, Bertrand, Carff, Mertins, Stephen, Abeles, Englsberger, Mccrory, van Egmond, Griffioen, Floyd, Kobus, Manor, Alsheikh, Duran, Bunch, Morphis, Colasanto, Hoang, Layton, Neuhaus, Johnson and Pratt48]. WBC is a flexible control strategy for manipulating highly dynamic rigid-body systems with physical and virtual constraints. It works by setting up a quadratic programing optimization problem with the linear instantaneous equations of motion of the system, in order to accomplish multiple, overlapping control tasks at the same time. More specifically, WBC takes desired motions set by the control designer (such as walking) and calculates desired joint torques to realize these motions at every time step. On the robot, this is paired with actuator control [Reference Herron, Fuge, Kogelis, Tremaroli, Kalita and Leonessa39] on each joint and its associated actuator(s), which will produce the force necessary at every timestep to realize the desired joint torque. In simulation, these required actuator forces can be calculated from the virtual model. The simulation of this robot is built in the open-source simulation and control software, IHMC ORS [43]. A video of the walking simulation has been included in the supplementary material. The controller implemented matches standard approaches with the inclusion of the linkages and masses of the robot model, stored in the standard SDF/URDF file types.
Four images of PANDORA walking, showing the stages of half a walking cycle. (1) Right foot hit ( $t=10.47$
s). (2) Left foot toe off (
$t=10.47$
s). (2) Left foot toe off ( $t=10.9$
s). (3) Left foot swing peak (
$t=10.9$
s). (3) Left foot swing peak ( $t=11.4$
s). (4) Left foot hit (
$t=11.4$
s). (4) Left foot hit ( $t=11.9$
s). The times for each step match the dashed lines in Figs. 15 and 16. The second half of the gait (right foot swing) is symmetrical to the first. The orange arrow represents the total ground reaction force at that time.
$t=11.9$
s). The times for each step match the dashed lines in Figs. 15 and 16. The second half of the gait (right foot swing) is symmetrical to the first. The orange arrow represents the total ground reaction force at that time.
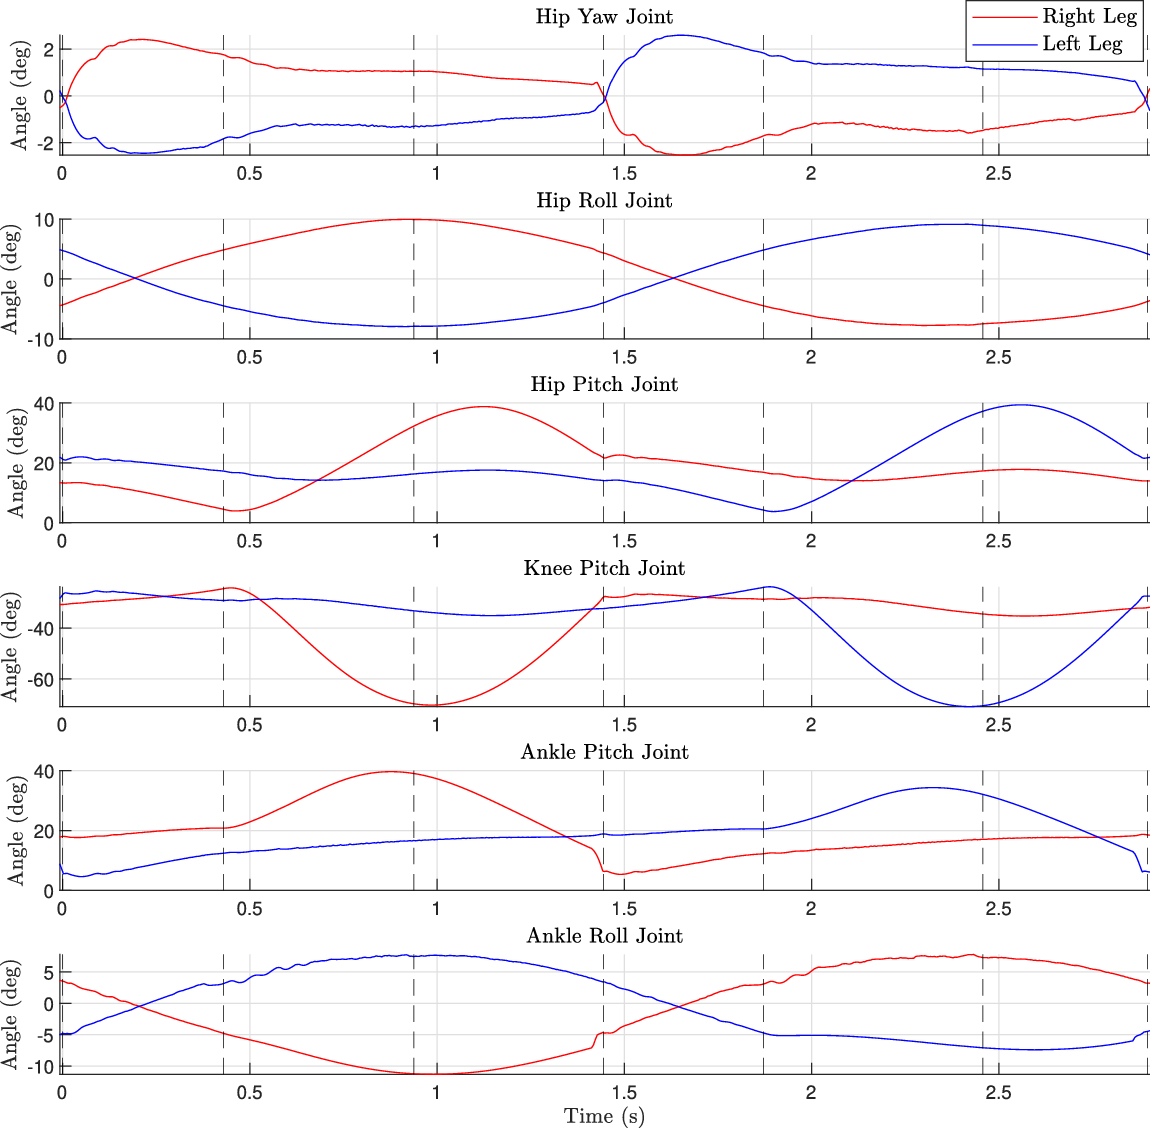
Joint angles for each joint in the leg over a full walking cycle. The vertical dotted lines indicate key points in the gait: right foot touchdown, left foot toe-off, left foot swing peak, left foot touchdown, right foot toe off, right foot swing peak, and lastly right foot touchdown.
For accurate loading of PANDORA, the planned weight of the upper body is included in the simulation model. An additional $50$
lbs (
$50$
lbs ( $22.5$
kg) is added to the pelvis of the robot such that the center of mass of the entire robot is approximately at the top of the pelvis. This representation does not contain the same inertial or dynamics properties as the real upper body, but it does generate the same scale of ground reaction forces and joint torques during walking. In this way, accurate joint position and actuator load trajectories can be generated to validate the design’s capabilities.
$22.5$
kg) is added to the pelvis of the robot such that the center of mass of the entire robot is approximately at the top of the pelvis. This representation does not contain the same inertial or dynamics properties as the real upper body, but it does generate the same scale of ground reaction forces and joint torques during walking. In this way, accurate joint position and actuator load trajectories can be generated to validate the design’s capabilities.
As displayed in Fig. 14, PANDORA walks forward with a cyclical gait at 0.1 m/s where each step takes a total of $1.45$
s to complete so a total gait cycle takes
$1.45$
s to complete so a total gait cycle takes $2.9$
s. The corresponding joint angles over one full gait cycle (right foot contact to right foot contact) are displayed in Fig. 15, with the maximum and minimum joint positions reached during the same cycle shown in Table V. Comparing Tables IV and V, it can be seen that the required joint angles for walking are within PANDORA’s ROM, validating the design’s capabilities for completing bipedal balancing and locomotive tasks.
$2.9$
s. The corresponding joint angles over one full gait cycle (right foot contact to right foot contact) are displayed in Fig. 15, with the maximum and minimum joint positions reached during the same cycle shown in Table V. Comparing Tables IV and V, it can be seen that the required joint angles for walking are within PANDORA’s ROM, validating the design’s capabilities for completing bipedal balancing and locomotive tasks.
Force at actuators and joint torques over a full walking cycle from right foot touchdown to right foot touchdown. The vertical dotted lines indicate key points in the gait: right foot touchdown, left foot toe-off, left foot swing peak, left foot touchdown, right foot toe off, right foot swing peak, and lastly right foot touchdown.

Additionally, in order to evaluate the dynamic performance of the robot, the joint torques and actuator forces through the walking cycle are shown in Fig. 16. The minimum and maximum torques are given in Table V, and actuator forces are given in Table VI. The actuators are named based on their location on the robot, with their corresponding controlled joint(s) also given in Table VI. When comparing the left and right legs, the forces are mostly symmetric, with differences coming from simulation phenomena and walking gaits not being perfectly balanced. Additionally, the ankle left and ankle right actuators have switched rather than fully symmetric force behavior. Most of the actuators must produce steady loads throughout the gait cycle of $ 400-600 \ \text{N}$
, with the maximum magnitude force of
$ 400-600 \ \text{N}$
, with the maximum magnitude force of $ 780 \ \text{N}$
seen by the thigh (hip pitch joint) actuator. The steady state and peak forces are within the range able to be generated by the actuators [Reference Knabe5], meaning the robot is capable of generating the desired joint torques. In the next section, the specific stress points that would be seen on each part from actuator forces are identified using FEA.
$ 780 \ \text{N}$
seen by the thigh (hip pitch joint) actuator. The steady state and peak forces are within the range able to be generated by the actuators [Reference Knabe5], meaning the robot is capable of generating the desired joint torques. In the next section, the specific stress points that would be seen on each part from actuator forces are identified using FEA.
Maximum and minimum simulated joint values for the robot during a simulated gait cycle.

Maximum and minimum actuator values for the robot during a simulated gait cycle.

6. Finite element analysis
FEA is a tool to determine how a component will react under load by simulating the stresses that the part may encounter. The use of FEA helps to identify potential design flaws which could lead to catastrophic failure resulting in expensive replacement costs or even loss of life. However, FEA is most often used for subtractive manufactured components, where additive manufactured components are not properly modeled in the simulation. With the simulation software available, it is not practical or feasible to simulate the layer orientation, layer adhesion, infill type, differences in print temperature, and wall thickness that are associated with 3D printing. Nevertheless, FEA is utilized in this work to validate design choices, whereas future work will focus on comparing the physical performance with simulations through tensile and impact load testing. PANDORA utilizes a substitute material of ABS in Siemens NX software that has similar mechanical properties to PLA+ and gives an indication of the high-stress points of the printed part to mitigate failure through using bracing, metal replacements, or redesign. The lower body of PANDORA is complex with a mixture of aluminum and PLA+ parts scattered throughout that are intentionally placed to mitigate stresses that have been found during FEA simulations. These simulations presented within this section are performed with NX Nastran software, to determine high-stress points while the robot is in operation. Within FEA simulations, the element size of 5 mm is used, with an element type of tetrahedral, and the part material being ABS. These parameters illustrate areas of potential failure that will need future destructive testing to verify the identified areas of high stress. To find areas of concern, a continuous force of 685 N provided by the linear actuators was used with the full weight of a whole body humanoid robot [Reference Knabe5]. The actuator force of 685 N was used for these simulations since it has been validated in tests as the continuous force that the actuators can reliably output [Reference Knabe5]. The simulations in the following subsections represent the humanoid taking a step with the right leg in the air and the left leg taking the full weight of the robot. While a majority of the loading is placed on the left leg, the simulation results validate the design for the right leg due to design symmetry. The main structures and joints are simulated to determine the weak points in the lower body of the robot, including pelvis, hip bracket, thigh, shin, and ankle bracket. The FEA has been conducted to validate the design of a 2 m tall humanoid robot manufactured through additive manufacturing techniques with the analysis showcasing that a 3D printed part is fully capable of withstanding the stresses and strains.
6.1. Pelvis
The pelvis is the most complex part to simulate because it connects to five joints, that is two sets of hip yaw/roll and the torso yaw, and is responsible for transferring the overall weight of the upper body to the lower body of the robot. There are a total of five actuators in this single part providing two DoFs in each leg and one to the torso of PANDORA. Therefore, FEA simulations have been performed on the pelvis by keeping the right leg in the air represented by a 100 N distributed load (A) in Fig. 17 pulling down on the part. All the weight of the robot has been transferred to the ground through the left leg simulated with a fixed constraint in Fig. 17. Each of the four actuator mounts is experiencing 685 N of force with the left leg pushing into the part with a simulated bearing load (B) as in Fig. 17 to simulate the actuators stabilizing as all weight is transferred to the left leg. The right leg hip actuator brackets represented by bearing load (A) (Fig. 17) have been forced out of the part to simulate the right leg being held in the air. There is a 500 N force directed at the top bearing through distributed load (B) in Fig. 17 that simulates the weight of the upper body.
FEA force distribution on simulated pelvis.

FEA of pelvis at continuous torque. (a) Deformation and (b) Von-Mises.

FEA of pelvis at peak torque. (a) Deformation and (b) Von-Mises.

The simulation of the pelvis shows a 2.4 mm deflection as shown in Fig. 18(a) on the right leg side due to it holding up the leg. The highest stress points in Fig. 18(b) are within the aluminum parts that hold the actuators where the extra screws and steel shim help to distribute the force to a larger area when transferred to the 3D printed component. Figure 18 illustrates the maximum continuous operating force of the linear actuators, and in Fig. 19 the peak force of 2225N is used at the four actuators mounting points [Reference Knabe5]. From the observations in Figs. 18 and 19, it can be concluded that the part is having same stress concentration areas and deformation distribution with the use of either continuous output force or peak output force. This same conclusion can be made with the other parts of PANDORA and hence, it has been not discussed for the following parts.
The failure of the pelvis has been mitigated through utilizing simulation and real-world testing (Fig. 20), where a majority of the actuator force is experienced through the aluminum mounting elements. By adding a thin steel plate that stretches the length of the pelvis along with two sets of screws mounted through the top, the pelvis rigidity is increased. The FEA analysis has shown that removing the two screws located on the top side of the actuator mount would cause failure due to higher stresses at peak actuator torque which did occur during testing of the actual pelvis. This is represented in Fig. 20 showing the failure along the layer lines of the pelvis and the absence of the bolts and a larger shim leading to higher bending stresses than the component can handle. This stress concentration is noticeable in Fig. 18 where the actuator mounts are seeing some of the highest stresses which will be transferred through the aluminum part into the plastic pelvis.
Failure in the built pelvis.

6.2. Hip bracket
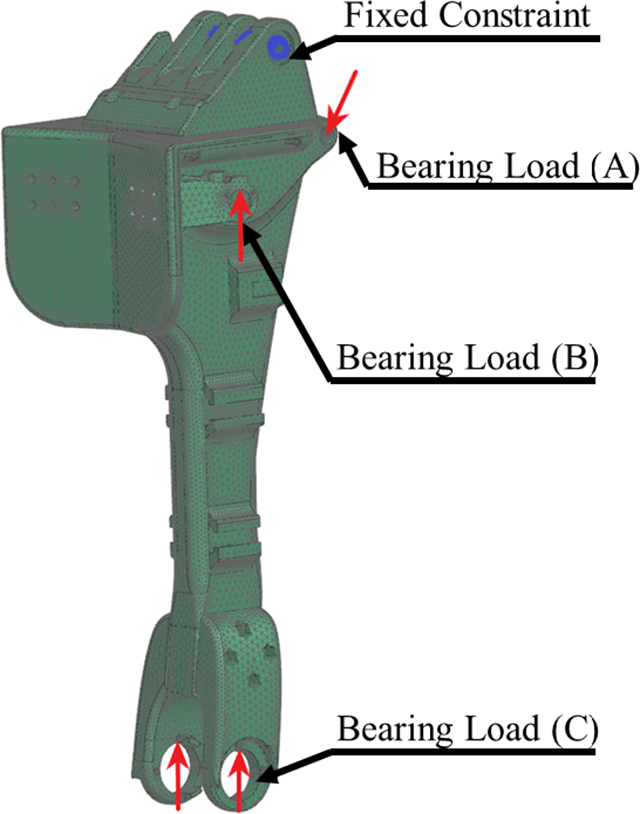
Each hip bracket has a high concentration of stresses due to the three DoFs and weight that are transferred through this bracket’s interconnected joint design. A fixed constraint is placed on both sides of the hip bracket to represent the connection to the thigh illustrated in Fig. 21. The two upper mounting points, where the pelvis connects to the hip bracket, use a bearing distribution (A) shown in Fig. 21 for a total force of 800 N (400 N per side). On the back side of the hip bracket represented in Fig. 21, bearing load (C) is the connection point from the thigh represented by two 342.5 N loads. There are additional four bearing loads located in the aluminum parts attached to the 3D printed structure on the front and back of the hip bracket. The hip pitch/roll actuator attaches within these aluminum parts and uses a bearing load of 342.5 N at each of the four thin-walled cylinders represented by bearing load (B) in Fig. 21.
FEA force distribution on simulated hip bracket.

To perform FEA, the hip bracket of the left leg is considered since this scenario is of PANDORA balancing on a single leg with the FEA results being shown in Fig. 22. As mentioned previously, these results validate the right hip bracket due to design symmetry. The main concern with this component is the stresses within the 3D-printed part in Fig. 22(b), where a 17 MPa stress point occurs at the connection point between the thigh and hip bracket. To mitigate the chance of failure at the connection between the bolt and the additive part, the 3D-printed component has a larger thickness and longer bolt to distribute the force further into the part. The largest deformation (Fig. 22(a)) from the constraints is 0.412 mm which seems small but it is representing a force that is working to pull the front and rear face off of the hip bracket. This type of force over time will lead to small deformation within the part causing inaccuracies in encoder and force sensor readings but will be verified through real-world testing on lasting effects. The hip bracket utilized multiple FEA simulations to ensure that the component will be properly reinforced to withstand the highest stresses and loading scenarios.
FEA of hip bracket at continuous torque. (a) Deformation and (b) Von-Mises.

6.3. Thigh
The thigh has 15 mm thick sidewalls and a complex system of curves to ensure there are minimal corners to reduce areas of stress concentrations, while retaining firm mounting points for the knee and thigh actuators. For this simulation, the thigh has a fixed constraint at the areas that the knee shaft connects to. There are two 400 N bearing loads at the top two connectors where the hip bracket attaches shown in Fig 23 as bearing load (A). The two actuators mounted in the thigh use universal bearings that have contact directly to the thigh simulated with a force of 342.5 N at each of the four points of contact represented by bearing load (B) and (C) in Fig 23. The thigh has a fixed constraint at the knee connection point demonstrated in the simulated thigh (Fig 23).
FEA force distribution on simulated thigh.

The results from the simulation show a maximum 8.9 mm deformation as shown in Fig. 24(a). While the deformation is significant in this case, the increased structural elasticity is a design choice which could lead to greater efficiency during motion. If necessary, an alternative approach to representing humanoid robots is using a spring-loaded inverted pendulum (SLIP)-based model [Reference Wensing and Orin49], which would directly integrate the elasticity displayed here into a reduced-order model of the robot. The peak Von-Mises stress is observed at 34.4 MPa in Fig. 24(b). These stresses occur at the point where the knee is fixed and stress is going into the part and distributed over the three connection points. While this is of concern, the weight is distributed over three 15 mm thick connection points and will be perpendicular to the layer lines ensuring the knee is in compression.
FEA of thigh at continuous torque. (a) Deformation and (b) Von-Mises.

6.4. Shin
The shin of PANDORA uses a central beam structure that transmits most of the forces from the upper body to the ankle. This single beam and its two linear actuators hold the entire weight of the robot while also stabilizing the robot to standing. For the simulation, the shin is fixed at the three knee connection points demonstrated in Fig. 25. For the loading, an 800 N force is divided between the two ankle mounting points represented in Fig. 25 as bearing load (C), a 342.5 N is placed on each side of the two aluminum actuator mounts as bearing load (B) located below the knee joint bolted mounted to the front face, and a 342.5 N bearing load (A) is placed on each side of the lower knee where the knee actuator connects to the shin. The Von-Mises reaches a peak of 47.2 MPA as shown in Fig. 26(b), this demonstrates two areas of high stresses, the knee connection and actuator connection to the front face of the shin. To distribute the forces, three brass bushings are used in the knee and thin steel plates on the front of the shin where the bolts connect. These reinforcements act both for force distribution and adding strength to the shin where it is needed. The 4.3 mm displacement displayed in Fig. 26(a) propagates from the shin to the connected ankle, where this structural elasticity is intentional and perhaps requires modeling within the SLIP approach [Reference Wensing and Orin49] previously discussed.
FEA force distribution on simulated shin.
FEA of shin at continuous torque. (a) Deformation and (b) Von-Mises.

6.5. Ankle bracket
The ankle bracket is a complex design that incorporates the compliance for the two actuator connections as well as transmitting the full upper body weight to the foot. The two forward-raised slots on the ankle having bearing load (A) in Fig. 27 connect to the lower part of the shin transmitting the weight of the robot into the foot. This loading condition is represented using the two bearing loads (A) of 400 N on each side. Additionally, a 342.5 N bearing load (B) in Fig. 27 is placed at each of the back actuator mounting points for ankle pitch/roll motion. A fixed constraint is on the bottom in a cutout that connects the ankle to the foot through the ATI force sensor.
FEA force distribution on simulated ankle bracket.

The design of the ankle bracket has evolved through FEA analysis as shown in Fig. 28 to ensure that the component will be able to withstand the stresses caused by loading. The deformation in Fig. 28(a) is expected to be highest at the ankle actuator mounts because the linear actuators are applying a compressive force to maintain the robot’s balance. The deflection of 3 mm across the backside of the ankle acts as a designed structural compliance for the actuators. The high-stress point in Fig. 28(b) is observed at the connection of the foot with the ankle through the ATI sensor. The peak stress is 36.6 MPa that arise due to the sharp curves where the steel ATI sensor connects to the additive manufactured foot. This will be monitored through real-world testing to determine if that stress point is a cause for concern and needs further reinforcements.
FEA of ankle bracket at continuous torque. (a) Deformation and (b) Von-Mises.

7. Conclusion and future work
The in-house developed 3D printed full-body humanoid platform, PANDORA, has been introduced in this paper, and the overall design of the lower body of the robot along with the manufacturing of different parts and joints has been discussed. This 30 DoFs humanoid includes two 6 DoFs legs, a 1 DoF torso, 3 DoFs neck and head, and two 7 DoFs arms. The use of additive manufacturing techniques reduces the number of parts along with the manufacturing and assembly times for PANDORA in comparison to previously available TREC humanoids, THOR and ESCHER. The use of additive manufacturing and PLA+ material along with the in-house developed actuators and control electronics make PANDORA an affordable humanoid platform. This makes PANDORA a novel solution for the industries and researchers when compared to the available humanoids in the market with an increased power-to-weight ratio without affecting the robustness of the overall robot. The lower body of PANDORA consists of three joints (i.e., hip, knee, and ankle) and three structural parts (i.e., pelvis, thigh, and shin) which have been designed to achieve the maximum ROM while maintaining structural stability. The design and assembly of the robot allow the mounting of different control electronics and actuators directly into the chassis of PANDORA. Further, the structural integrity of different parts of the lower body of PANDORA has been investigated with the help of FEA simulations performed in NX Nastran software. Several key aspects of additive manufactured components such as layer orientation, layer adhesion, infill type, differences in print temperature, and wall thickness are not modeled in the simulation and are critical for assessing structural integrity. Overall, this humanoid platform can be useful to researchers and designers to explore the field of humanoid robotics, develop new technology, and expand applications in medical and industrial settings.
Humanoid robot development and research requires a significant investment, requiring extensive mechanical, electrical, networking, and control knowledge. PANDORA is a cost-effective humanoid robot platform that enables researchers and industries to bypass a significant portion of the development cycle for their individual research direction or application. To the authors’ knowledge, with PANDORA’s overall mass expected at 45 kg, this would make this platform one of the lightest full-sized humanoid robots in the world. This lower weight enables exploration in new research directions such as agile locomotion which previously were constrained by higher torque requirements for basic mobility. PANDORA’s lower body mechanical design (CAD) is available on the TREC Lab Public GitLab ( https://gitlab.com/trec-lab ), providing researchers with a solid foundation to make modifications for their specific requirements. This is a major milestone among open source offerings because PANDORA’s design release is one of the only full-sized humanoid robot platforms. Alternatively, the LARMbot 2 and iCub are child-sized, open-source humanoid robot platforms where LARMbot 2 is parallel actuated and the iCub humanoid is direct drive actuated [Reference Dafarra, Darvish, Grieco, Milani, Pattacini, Rapetti, Romualdi, Salvi, Scalzo, Sorrentino, Tomé, Traversaro, Valli, Viceconte, Metta, Maggiali and Pucci10, Reference Russo, Cafolla and Ceccarelli34].
Future work will focus on comparing the simulation results with tensile and impact loading tests to further justify the structural integrity of PANDORA. In addition, PANDORA’s upper body will be developed using the same additive manufacturing methods and materials as the lower body. The development of the upper body of PANDORA will consist of four major structural parts, for example, a torso, two arms, and a head with neck which can be observed from the overall design of the robot. Each arm of PANDORA will consist of three major joints, that is, shoulder, elbow, and wrist, for mimicking a human arm with similar DoFs which will provide the flexibility to perform a variety of tasks with better reachability as well as larger working space. Further, the integration of the upper body will be attached to the already developed lower body of PANDORA through the pelvis for achieving a full-body humanoid platform. Potential improvement in the control architecture as well as robot electronics will be explored to make the robot more efficient and robust. Overall, the aim of developing PANDORA will be satisfied by using it in different applications to assist humans in real-world environments.
Author contributions
AJF: Conceptualization, methodology, prototype, formal analysis, investigation, and writing – original draft. CWH: Methodology, prototype, investigation, visualization, and writing – review and editing. BCB: Investigation, visualization, and writing – review and editing. BK: Investigation, visualization, supervision, and writing – original draft. AL: Investigation, supervision, project administration, and writing – review and editing.
Financial support
This research received no specific grant from any funding agency, commercial, or not-for-profit sectors.
Conflicts of interest
The authors declare no conflicts of interest exist.
Ethical approval
Not applicable.
Acknowledgements
The authors want to acknowledge the members of the TREC Lab, Virginia Tech for their contribution in the development of PANDORA, specially, Zachary J Fuge, Nicholas J Tremaroli, Philip Hancock, Stephen B Welch, Ivan Fischman Ekman Simoes, and Isaac Pressgrove.
Supplementary material
To view supplementary material for this article, please visit https://doi.org/10.1017/S0263574723000395.


 Open access