


1. Introduction
Glaciers are retreating worldwide due to global warming (Edwards and others, Reference Edwards2021; IPCC, 2023). Mountain glaciers remain the dominant contributor to sea-level rise at a rate similar to that of the Greenland and Antarctic ice sheets combined (Slater and others, Reference Slater2021). It is anticipated that glaciers will remain the dominant contributor until the end of the century (Kopp and others, Reference Kopp2014). Many people live close to the coast and will be affected by the rising sea level (Kulp and Strauss, Reference Kulp and Strauss2019). On a regional scale, glaciers are also an essential source of seasonal freshwater, especially in high mountain areas (Kaser and others, Reference Kaser, Großhauser and Marzeion2010; Huss and Hock, Reference Huss and Hock2018). On a local scale, retreating glaciers can destabilize mountain slopes and precondition glacier lake outburst floods (Fischer and others, Reference Fischer, Huggel, Kääb and Haeberli2013; Veh and others, Reference Veh, Korup and Walz2020). Thus, there is particular interest for mountain communities in accurate simulations of future glacier evolution.
The current suite of glacier evolution models (GEMs) for regional to global applications is typically based on flow-line approaches (Maussion and others, Reference Maussion2019; Zekollari and others, Reference Zekollari, Huss and Farinotti2019; Rounce and others, Reference Rounce2023). These models simulate glacier evolution along a few representative flow lines or by approximating glacier-wide properties such as volume, area and length using empirical or semi-empirical relationships. To enable global-scale projections, they deliberately adopt simplified model structures and parameterizations. This simplification is not necessarily a drawback: on large spatial and temporal scales, such models can offer robust estimates and even reduce uncertainty by avoiding overparameterization.
However, when applied at the scale of individual glaciers or over shorter time periods, these simplified models are often unable to represent critical local processes. As a result, projection uncertainties at these finer scales remain substantial, stemming from (i) limitations and biases in climate forcing data, (ii) insufficient representation of glacier-specific dynamics and (iii) the limited availability of observational data for model calibration (Rounce and others, Reference Rounce, Khurana, Short, Hock, Shean and Brinkerhoff2020b). While uncertainties in long-term projections are primarily dominated by emission scenarios and climate model spread, the choice and calibration of the glacier model become increasingly important for near-future projections (Hock and others, Reference Hock2019; Marzeion and others, Reference Marzeion2020; Aguayo and others, Reference Aguayo2024; Schuster and others, Reference Schuster, Rounce and Maussion2023). This is closely tied to the characteristic response time of glaciers, which spans several decades to centuries (Zekollari and others, Reference Zekollari, Fürst and Huybrechts2014). On such timescales, dynamic responses may be sensitive to subglacial topography and other local conditions that are difficult to capture in flow-line models (Nias and others, Reference Nias, Cornford and Payne2018).
Glacier models vary in complexity depending on the case of application and geographic focus. Recent advances in computing enable a shift from simplified one-dimensional (1-D) flow-line models to more precise three-dimensional (3-D) models that resolve ice flow within real topography. Until recently, high computational cost limited their application mostly to local-scale studies(e.g. Jouvet and others, Reference Jouvet, Huss, Blatter, Picasso and Rappaz2009; McNabb and others, Reference McNabb2012; Morlighem and others, Reference Morlighem, Bondzio, Seroussi, Rignot, Larour, Humbert and Rebuffi2016; Fürst and others, Reference Fürst2017). The IGM developed by Jouvet and Cordonnier Reference Jouvet and Cordonnier(2023), based on a physics-informed neural network architecture, represents a major step forward in this direction. It enables computationally efficient 3-D simulations that resolve ice flow over complex topography, making such models increasingly suitable not only for local but also for regional to global scale applications.
A common challenge for all glacier models is the need for accurate calibration, which is, the adjustment of model parameters to ensure agreement with observed glacier behaviour, in order to produce realistic projections. This process becomes even more demanding for complex models, as they typically include a larger number of free parameters. The calibration of a GEM involves primarily two components. First, the ice-dynamic state is characterized by the viscous deformation of the ice body itself and by the frictional contact at the glacier base, allowing for basal sliding. Second, the surface mass balance (SMB) comprises all processes of mass gain and mass loss at the glacier upper surface. In situ measurements (Adhikari and Huybrechts, Reference Adhikari and Huybrechts2009; Zekollari and others, Reference Zekollari, Fürst and Huybrechts2014; Engelhardt and others, Reference Engelhardt, Leclercq, Eidhammer, Kumar, Landgren and Rasmussen2017) or geodetic mass balance observations (Gilbert and others, Reference Gilbert, Flowers, Miller, Refsnider, Young and Radić2017, Reference Gilbert, Sinisalo, Gurung, Fujita, Maharjan, Sherpa and Fukuda2020; Compagno and others, Reference Compagno, Jouvet, Bauder, Funk, Church, Leinss and Lüthi2019) typically serve to calibrate SMB parameters such as degree-day factors, precipitation correction factor, temperature and precipitation lapse rates, temperature bias and a rain-snow temperature threshold. Since in situ data are limited to a few well-studied glaciers, calibration methods often require extrapolation for broader application. Maussion and others Reference Maussion(2019) use a simple approach, interpolating SMB parameters from nearby glaciers. However, they acknowledge the potential issues with this assumption, given the variability in glacier size, valley orientation and elevation range. The calibration with a regional focus on the European Alps has been performed by Zekollari and others Reference Zekollari, Huss and Farinotti2019. Their study is certainly a step towards systematic model calibration using remote sensing observations. They calibrate their SMB model with geodetic observations of the specific mass balance, but did not provide a systematic estimate of model uncertainties. Another regional calibration was performed by Rounce and others Reference Rounce, Khurana, Short, Hock, Shean and Brinkerhoff2020b in High Mountain Asia. Their calibration method is based on a Bayesian formulation to estimate three specific parameters (degree-day factor of snow, precipitation factor and temperature bias) sequentially against the specific mass balance. However, calibrating parameters using glacier-averaged specific values does not utilize valuable information on spatial distribution as, for example, inherent in elevation change maps that could be captured by incorporating spatially distributed observations.
The dynamical nature of glaciers and the sequential availability of satellite-based observations make it challenging to calibrate glacier models for a single time interval. To address this, data assimilation methods are needed that incorporate observations as they become available over time. Recent satellite products offer a largely untapped source of information for this purpose, including bi-weekly global glacier velocity datasets (Scambos and others, Reference Scambos, Fahnestock, Moon, Gardner and Klinger2016; Friedl and others, Reference Friedl, Seehaus and Braun2021; Millan and others, Reference Millan, Mouginot, Rabatel and Morlighem2022), regional and global elevation change maps (Brun and others, Reference Brun, Berthier, Wagnon, Kääb and Treichler2017; Braun and others, Reference Braun2019; Hugonnet and others, Reference Hugonnet2021) and global glacier outlines (RGI Consortium, 2023). However, these datasets often have nonoverlapping temporal coverage, which further complicates the calibration process. In this study, we apply a transient data assimilation approach based on the Ensemble Kalman Filter (EnKF) to integrate remote-sensing observations into a glacier model. While the method is designed to assimilate multiple observations over time, we focus here on a simplified proof-of-concept using a single observation to demonstrate the approach.
Ensemble calibration involves running multiple simulations with varying model parameters to explore the parameter space and estimate uncertainty. This approach, commonly used in climate modelling, is increasingly being employed in cryospheric modelling approaches ranging from glaciers (Eis and others, Reference Eis, Maussion and Marzeion2019), via ice-sheets (Gillet-Chaulet, Reference Gillet-Chaulet2020) to permafrost (Groenke and others, Reference Groenke, Langer, Nitzbon, Westermann, Gallego and Boike2023). Ensemble methods help calibrate model parameters, improve the simulation of glacier dynamics and better capture nonlinear processes and feedbacks. Transient data assimilation can be performed using the EnKF, which provides a flexible framework for incorporating observational data into ensemble-based model calibration (Vetra-Carvalho and others, Reference Vetra-Carvalho2018). A proof of concept for calibrating the initial state of an ice-sheet model using an EnKF was published by Bonan and others Reference Bonan, Nodet, Ritz and Peyaud(2014). In a synthetic Twin Experiment, where observations are generated by the same model used for forecasting, they show that EnKF has good convergence even for small ensembles. Gillet-Chaulet Reference Gillet-Chaulet(2020) evaluated the performance of the EnKF for the assimilation of surface elevation and velocity in a marine ice-sheet model—also in a Twin Experiment. They show that the filter can reproduce basal friction and topography beneath the glacier in a synthetic experiment. So far, EnKF has not been tested with real observations for glacier setups. Knudsen and others Reference Knudsen, Park-Kaufmann, Corcoran, Robel and Mayo(2024) similarly applied the EnKF in a Twin Experiment using a simplified ice sheet model and demonstrated that it can improve glacier melt projections and reduce uncertainty in poorly constrained initial states.
In this study, we explore the suitability of the EnKF for automatically calibrating the SMB parameters of a GEM in an Alpine setting. As a test case, we selected the Rhône Glacier, located in the canton of Valais in the Swiss Alps. With a length of approximately 8 km and an elevation range from about 2200 to 3600 m a.s.l., it is one of the most extensively studied valley glaciers in the region. Long-term observations include detailed SMB records provided by GLAMOS - Glacier Monitoring Switzerland (2023). This record makes the glacier an ideal candidate for evaluating the performance of our calibration framework. For the Twin Experiment in this study, we adopt its actual geometry and use realistic ice-dynamic and SMB parameters derived from observational data. The main objective of this study is a proof of concept of the utility of EnKF for GEM calibration. We pursue the following primary contributions:
1. Implementation of a calibration framework for GEM using EnKF.
2. A sensitivity study evaluating EnKF performance in calibrating SMB parameters in a Twin Experiment.
3. Calibration of Rhône Glacier SMB parameters using elevation change observations in a Real-World Experiment.
2. Method
Our method combines the EnKF (Evensen, Reference Evensen1994; Houtekamer and Mitchell, Reference Houtekamer and Mitchell1998) with the GEM IGM (v2.2.2) from Jouvet and Cordonnier Reference Jouvet and Cordonnier(2023). IGM is a 3-D glacier model based on a physics-informed neural network trained to minimize the energy associated with the Blatter–Pattyn ice-flow model. For further details on the model, we refer to Jouvet and Cordonnier Reference Jouvet and Cordonnier(2023). Compared to other glacier models, IGM allows for multiple model runs in a relatively short computational time. We use its built-in inversion routine to infer ice dynamic parameters from observed surface velocities (Jouvet, Reference Jouvet2023). To calibrate the SMB parameters, we couple IGM with the EnKF. The full workflow is publicly available at https://github.com/FAU-glacier-systems/FROST.
In this study, we simplify the application of the EnKF, which is traditionally used to estimate evolving hidden states, and instead use it to calibrate SMB parameters based on long-term elevation change observations. These observations are generally more robust when aggregated over extended periods (Hugonnet and others, Reference Hugonnet2022). As a result, we choose to use a single observation that spans the entire period. While this limits our ability to estimate time-varying parameters, it simplifies the problem and improves computational efficiency and numerical stability. We recognize, however, that a single iteration may not suffice for convergence. Therefore, we adopt an iterative approach, cycling through the same observation multiple times to refine the parameter estimates until they stabilize.
2.1. Ensemble Kalman Filter
We apply the EnKF as a practical data assimilation method to calibrate three SMB parameters: the equilibrium line altitude (ELA) sELA, the ablation gradient γabl and the accumulation gradient γacc. Rather than presenting the abstract formulation, we focus on the specific implementation used in this study to integrate remote-sensing observations of elevation change into the model and iteratively update both the parameter estimates and their associated uncertainties.
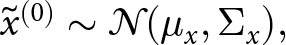
Both the SMB parameters and the elevation change are assumed to follow Gaussian distributions, each characterized by a corresponding covariance matrix. The EnKF algorithm begins with an initial ensemble of SMB parameter vectors (Evensen, Reference Evensen2003), denoted by  ${\tilde{x}}^{(0)}$, drawn from a prior normal distribution:
 \begin{equation}
{\tilde{x}}^{(0)} \sim \mathcal{N}(\mu_x, \Sigma_x),
\end{equation}
\begin{equation}
{\tilde{x}}^{(0)} \sim \mathcal{N}(\mu_x, \Sigma_x),
\end{equation} where µx is the mean vector of the prior distribution and  $\Sigma_x$ is its covariance matrix. We assume that the SMB parameters are independent, which means that the covariance matrix is defined by the standard deviation of the individual parameters $\Sigma_x = diag(\sigma_{s_{ELA}}, \sigma_{\gamma_{abl}}, \sigma_{\gamma_{acc}})$. Each member of the ensemble represents a plausible realization of the SMB parameters based on these prior assumptions.
These ensemble members are then propagated through the glacier model IGM to simulate the corresponding elevation change values, as defined by the forward step:
 \begin{equation}
{\tilde{y}}^{(i)} = \mathrm{IGM}({\tilde{x}}^{(i)}).
\end{equation}
\begin{equation}
{\tilde{y}}^{(i)} = \mathrm{IGM}({\tilde{x}}^{(i)}).
\end{equation}This process is followed by the update step, in which the SMB parameters are adjusted based on the comparison between modelled and observed elevation change.
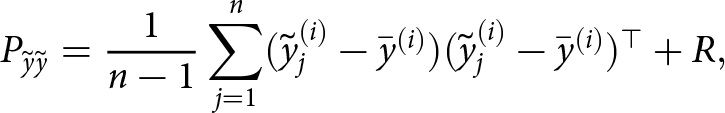
To compute the update, we first evaluate the cross-covariance matrix between the SMB parameters and the simulated elevation change (Evensen, Reference Evensen2003):
 \begin{equation}
P_{\tilde{x}\tilde{y}} = \frac{1}{n-1} \sum_{j=1}^n (\tilde{x}_j^{(i)} - \bar{x}^{(i)})(\tilde{y}_j^{(i)} - \bar{y}^{(i)})^\top,
\end{equation}
\begin{equation}
P_{\tilde{x}\tilde{y}} = \frac{1}{n-1} \sum_{j=1}^n (\tilde{x}_j^{(i)} - \bar{x}^{(i)})(\tilde{y}_j^{(i)} - \bar{y}^{(i)})^\top,
\end{equation} where n is the ensemble size, and  $\bar{x}^{(i)}$ and $\bar{y}^{(i)}$ denote the ensemble means of the parameters and model output at iteration i, respectively. This matrix captures the covariance between individual SMB parameters and spatial elements of the elevation change map.
Next, we compute the covariance of the modelled elevation change, including observation uncertainty:
 \begin{equation}
P_{\tilde{y}\tilde{y}} = \frac{1}{n-1} \sum_{j=1}^n (\tilde{y}_j^{(i)} - \bar{y}^{(i)})(\tilde{y}_j^{(i)} - \bar{y}^{(i)})^\top + R,
\end{equation}
\begin{equation}
P_{\tilde{y}\tilde{y}} = \frac{1}{n-1} \sum_{j=1}^n (\tilde{y}_j^{(i)} - \bar{y}^{(i)})(\tilde{y}_j^{(i)} - \bar{y}^{(i)})^\top + R,
\end{equation}where R is the observation error covariance matrix, which incorporates the uncertainty of the observed elevation change maps.
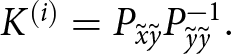
The Kalman Gain is then computed using:
 \begin{equation}
K^{(i)} = P_{\tilde{x}\tilde{y}} P_{\tilde{y}\tilde{y}}^{-1}.
\end{equation}
\begin{equation}
K^{(i)} = P_{\tilde{x}\tilde{y}} P_{\tilde{y}\tilde{y}}^{-1}.
\end{equation}This statistical construct determines how much each ensemble member should be adjusted based on the mismatch between the simulated and observed elevation change (Burgers and others, Reference Burgers, Leeuwen and Evensen1998; Houtekamer and Mitchell, Reference Houtekamer and Mitchell1998).
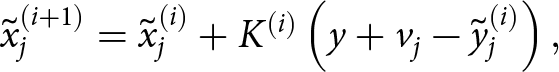
Each ensemble member is then updated individually:
 \begin{equation}
\tilde{x}_j^{(i+1)} = \tilde{x}_j^{(i)} + K^{(i)} \left( y + v_j - \tilde{y}_j^{(i)} \right),
\end{equation}
\begin{equation}
\tilde{x}_j^{(i+1)} = \tilde{x}_j^{(i)} + K^{(i)} \left( y + v_j - \tilde{y}_j^{(i)} \right),
\end{equation} where y is the observed elevation change, and vj is a random realization of the observation noise drawn from  $\mathcal{N}(0, R)$ (Evensen, Reference Evensen2003).
To better understand the role of the Kalman Gain in the update step, we highlight three of its key properties: (1) K transforms information from observation space into parameter space; (2) K encodes the update direction, determining whether to increase or decrease the estimate of the SMB parameters; (3) K balances the influence of the prior state with the new information provided by the observation (Burgers and others, Reference Burgers, Leeuwen and Evensen1998; Evensen, Reference Evensen2003).
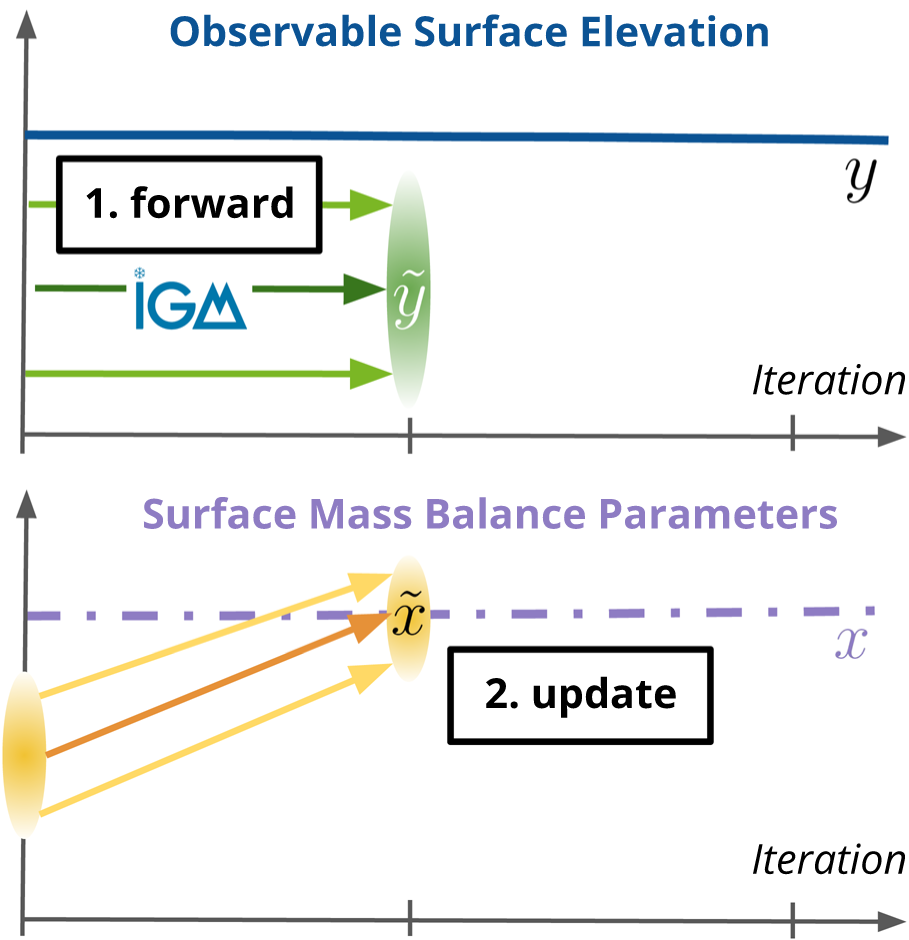
These forward and update steps form the core of the EnKF and are repeated iteratively (Evensen, Reference Evensen2003). Traditionally, each iteration would assimilate a new observation in time. In our simplified setting, however, we use the same long-term elevation change observation in every iteration. This approach is commonly used in parameter estimation frameworks, such as iterative EnKF or history matching (Emerick and Reynolds, Reference Emerick and Reynolds2013; Iglesias and others, Reference Iglesias, Law and Stuart2013). The iterative process continues until convergence, at which point the parameter estimates stabilize (see Fig. 1 for an illustration of the workflow).
Conceptual workflow of the EnKF applied in this study. The process begins with an ensemble of initial SMB parameter sets (left, yellow ellipse), which are propagated through the glacier model (IGM) during the forward step to simulate elevation change (green arrows). The results are compared to observed elevation (blue ellipse). In the update step, the ensemble is adjusted using the Kalman Gain, which accounts for uncertainties in both the model and the observations. This cycle is repeated iteratively until the ensemble converges to a stable estimate of the SMB parameters. The dotted purple line represents an optimal SMB parameter set which describes the observed surface elevation change.

2.2. Calibration pipeline
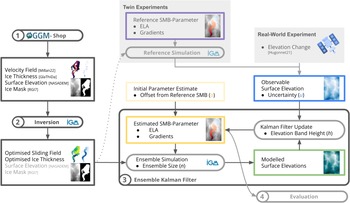
This section outlines the procedure used to calibrate SMB parameters for any glacier using our proposed method. It supports two configurations: one based on synthetic observations from a Twin Experiment, and another using real elevation change data from Hugonnet and others Reference Hugonnet(2021). An overview of both workflows is provided in Fig. 2.
Schematic overview of the calibration pipeline for estimating SMB parameters using the glacier model IGM and the EnKF. The pipeline supports both Twin Experiment, which uses synthetic observations from a reference simulation, and Real-World Experiment, which relies on observed elevation change data from Hugonnet and others Reference Hugonnet(2021). (1) Glacier-specific input datasets, such as surface elevation, velocity and ice mask, are obtained and preprocessed using OGGM-Shop (Maussion and others, Reference Maussion2019). (2) The inversion step with IGM provides estimates of ice thickness and the basal sliding coefficient. These are then used in ensemble simulations, followed by Kalman Filter updates and evaluation. The hyperparameters tested in this study: ensemble size n, initial offset from reference SMB o, observation uncertainty u and elevation band height h, are highlighted throughout the workflow.

In the Twin Experiment setup, an IGM reference simulation with prescribed SMB parameters is used to generate synthetic elevation change observations. These serve as the input for the EnKF calibration. Since the same glacier model is used in both the simulation and the calibration, model uncertainty is effectively eliminated. This idealized setup allows us to isolate and evaluate the performance of the EnKF, as any deviation between the simulated and estimated elevation change can be directly attributed to differences in the SMB parameters.
To enhance realism while retaining full control, we use the actual geometry of the Rhône Glacier, as well as realistic ice dynamics (inferred velocity field) and SMB parameters derived from Glacier Monitoring Switzerland (GLAMOS) data. As such, the Twin Experiment provides a controlled environment for systematically investigating the influence of internal method settings, including key hyperparameters such as ensemble size, observation uncertainty and iteration count.
The pipeline begins by acquiring essential glacier datasets, primarily representing conditions around the year 2000. This includes surface elevation data from NASA Digital Elevation Model (NASADEM) (Crippen and others, Reference Crippen2016), glacier outlines from the Randolph Glacier Inventory Version 7 (RGI7) (RGI Consortium, 2023), ice thickness and velocity fields from Millan and others Reference Millan, Mouginot, Rabatel and Morlighem(2022) and ice thickness measurements from GlaThiDa 3.1.0 (Welty and others, Reference Welty2020). The Open Global Glacier Model (OGGM) (Maussion and others, Reference Maussion2019) offers robust preprocessing tools to standardize and merge these datasets. Integrated within IGM, OGGM facilitates the automatic retrieval and processing of the required input data using only the RGI7 ID. The spatial resolution of the input grids depends on the size of the glacier; for Rhône Glacier, this corresponds to a resolution of 50 m.
While the RGI7 outlines for Rhône Glacier are based on data from 2003, and the velocity and thickness fields from Millan and others Reference Millan, Mouginot, Rabatel and Morlighem(2022) represent conditions from 2017–18, we assume that the glacier’s geometries and dynamics have not undergone significant changes between 2000 and these later dates. This assumption is supported by the relatively slow response of glacier geometries and flow dynamics to climatic changes.
The next step is the IGM inversion (Step 2), which estimates the glacier’s internal state prior to calibration. Specifically, it optimizes the basal sliding coefficient and ice thickness distribution to match observed surface velocity, thickness measurements, surface elevation and glacier area (Jouvet, Reference Jouvet2023).
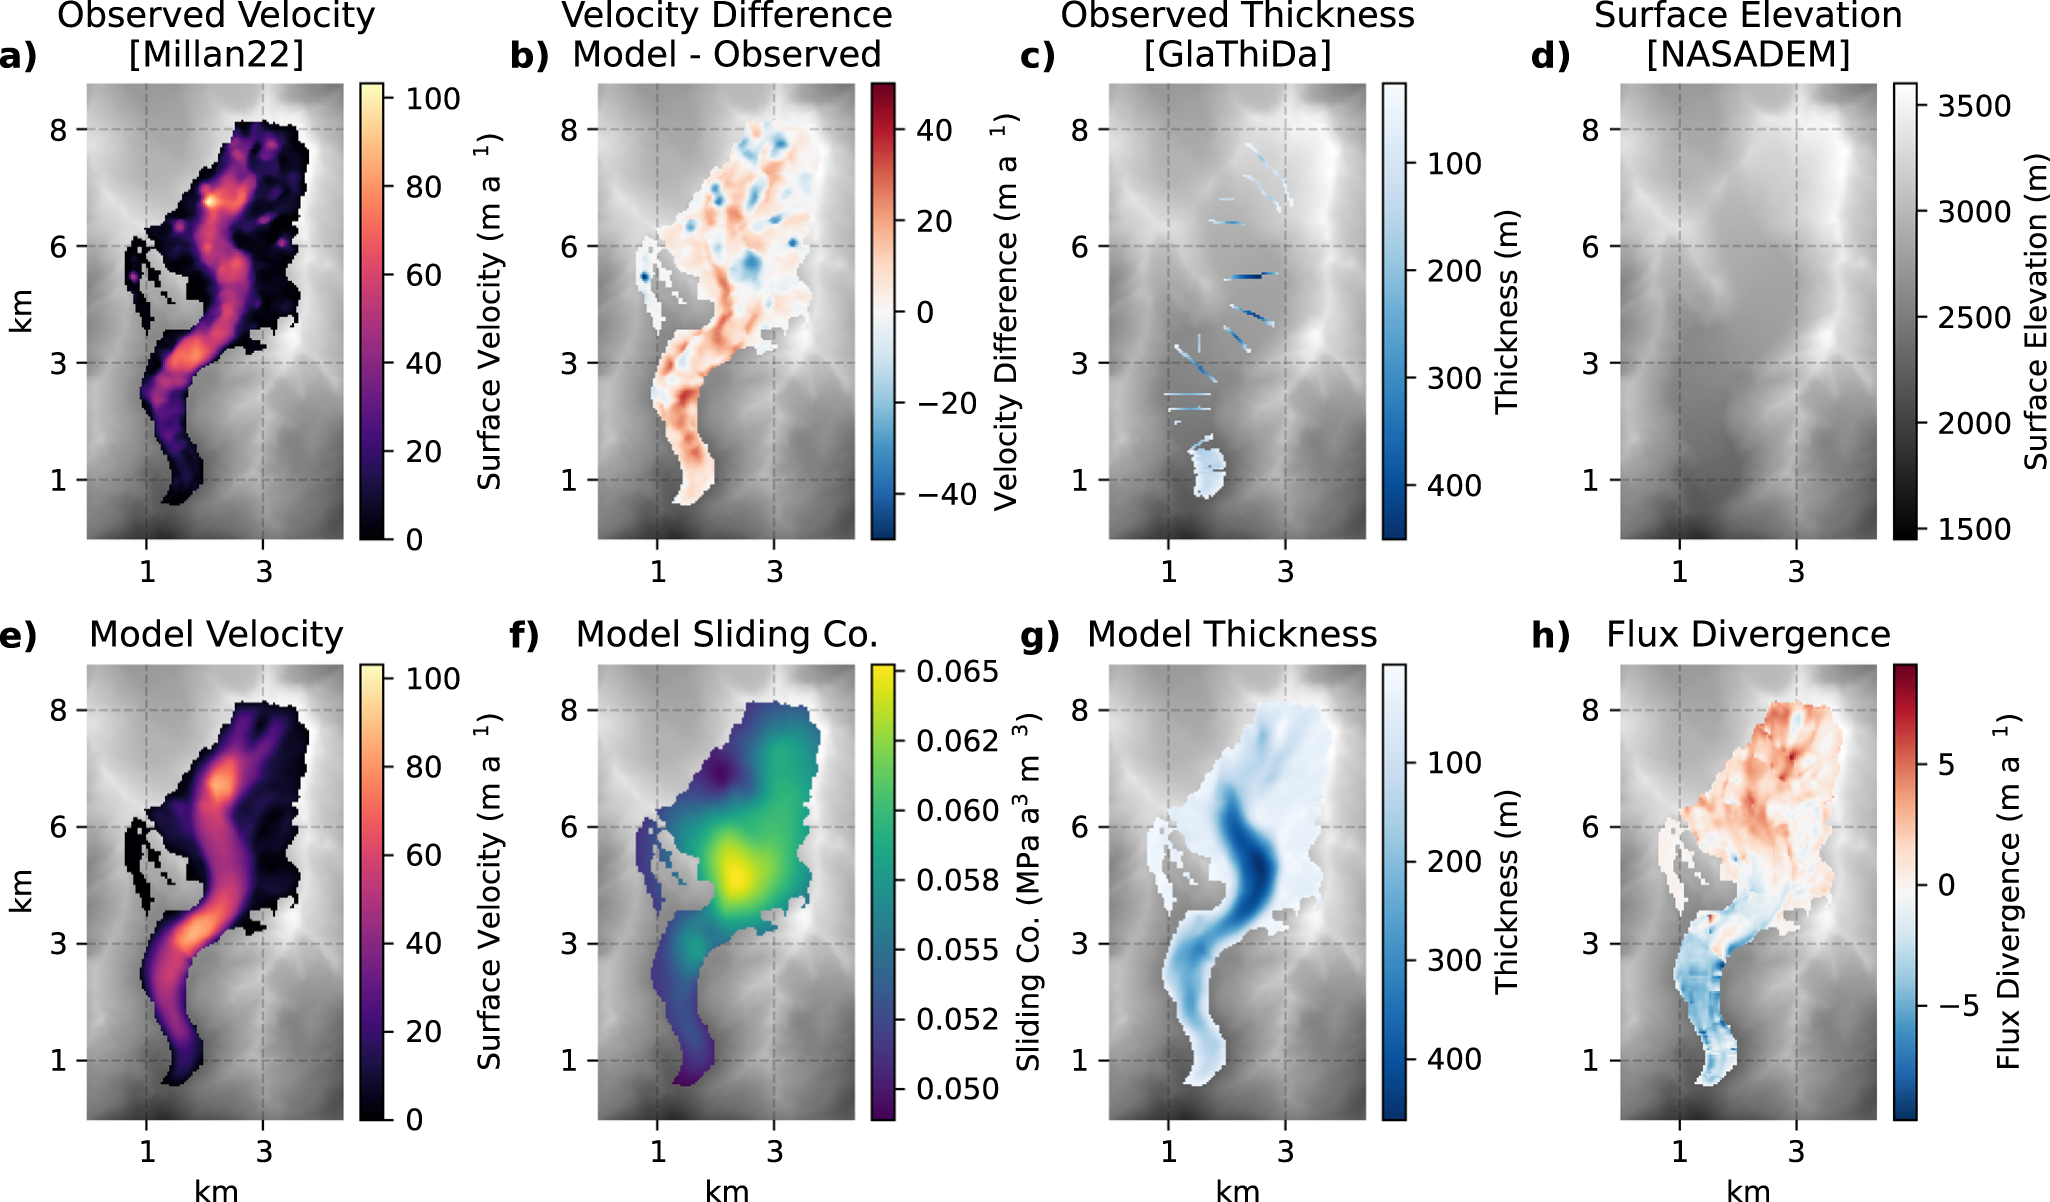
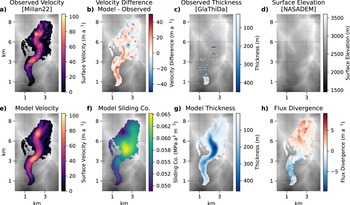
In this inversion, the Arrhenius rate factor, which defines the ice viscosity in Glen’s flow law, is set to a constant value of 78 MPa−3a−1, corresponding to temperate ice at  $0\,^\circ$C, a standard choice in glacier modelling (Cuffey and Paterson, Reference Cuffey and Paterson2010; Cook and others, Reference Cook, Jouvet, Millan, Rabatel, Zekollari and Dussaillant2023). The resulting velocity, basal sliding and thickness fields are shown in Figure 3.
Results of the IGM inversion applied to Rhône Glacier following the procedure described in Jouvet Reference Jouvet(2023). The distribution of ice thickness and basal sliding is optimized such that the misfit between observed velocities from Millan and others Reference Millan, Mouginot, Rabatel and Morlighem(2022) and thickness values is minimized.
Step 3 consists of the full SMB calibration cycle, where each ensemble member is used to simulate glacier evolution forward in time and is then updated through the Kalman filter (see previous section). The simulation spans a 20 year period, using IGM with a variable temporal resolution (3–12 months) depending on the modelled glacier velocity. Each simulation is driven by three SMB parameters: ELA, ablation gradient and accumulation gradient, sampled within the EnKF ensemble.
To compare the modelled and observed elevation change maps, we aggregate both into elevation bins with a fixed height. This step leverages the fact that the SMB model is explicitly elevation-dependent, allowing us to reduce the dimensionality of the data while preserving the key vertical signal. This binning significantly lowers memory usage and computational cost, especially important given that the covariance matrix equation (4) scales quadratically with the number of observed variables. Although this simplification discards information about the horizontal distribution of elevation change, the SMB model represents spatial variability only as a function of elevation and therefore cannot make use of horizontal information. Instead, the binning improves robustness and efficiency in the data assimilation process. The area of each bin is defined by the surface elevation from NASADEM and a chosen bin height. Aggregating the mean value of a bin is straightforward: it is the arithmetic mean of the elevation values within the bin.
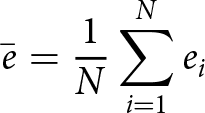
Let ei denote the surface elevation at pixel i within a bin, and let N be the number of pixels in the bin. Then the bin-mean elevation is given by:
 \begin{equation}
\bar{e} = \frac{1}{N} \sum_{i=1}^{N} e_i
\end{equation}
\begin{equation}
\bar{e} = \frac{1}{N} \sum_{i=1}^{N} e_i
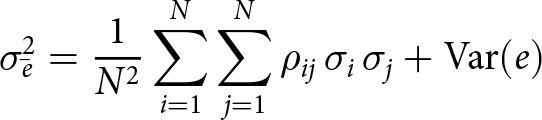
\end{equation} Computing the uncertainty associated with  $ \bar{e} $, however, is more complex. It combines both measurement uncertainty and natural variability within the bin. The total variance of the bin mean is defined as:
 \begin{equation}
\sigma_{\bar{e}}^2 = \frac{1}{N^2} \sum_{i=1}^{N} \sum_{j=1}^{N} \rho_{ij} \, \sigma_i \, \sigma_j + \text{Var}(e)
\end{equation}
\begin{equation}
\sigma_{\bar{e}}^2 = \frac{1}{N^2} \sum_{i=1}^{N} \sum_{j=1}^{N} \rho_{ij} \, \sigma_i \, \sigma_j + \text{Var}(e)
\end{equation} where σi is the uncertainty (standard deviation) associated with pixel i, ρij is the spatial correlation between the uncertainties of pixels i and j and  $ \text{Var}(e) $ is the empirical variance of the elevation values ei within the bin. The empirical variance is influenced by the elevation bin height, but also adapts to the actual distribution of elevation values within the bin, capturing local topographic variability rather than relying solely on the predefined elevation height. The spatial correlations ρij are computed as a function of the pairwise distances between pixels and the corresponding correlation parameters. These parameters vary between glaciers and over time, as discussed in Hugonnet and others Reference Hugonnet(2021), and their complexity is likely the reason why they are not explicitly published. In the absence of published values, we rely on representative parameters obtained through personal communication with Romain Hugonnet. For more details, we refer to our published code.
In our Twin Experiment, the pixel uncertainty σi is assumed to be spatially constant across all pixels. We test different values of this constant uncertainty to evaluate its influence on the resulting bin-level variance. In the Real-World case, pixel-level uncertainties are spatially variable and are provided by the elevation error model described in Hugonnet and others Reference Hugonnet(2021). This formulation captures both the propagated uncertainty due to correlated measurements and the natural topographic variability within each bin.
In the final step (Step 4), we evaluate the performance of the EnKF based on two complementary setups. In the Twin Experiment, we compare the inferred SMB parameters to the prescribed reference values, enabling a systematic analysis of the impact of hyperparameters such as ensemble size, uncertainty and initial offset. In the real-data setup, our goal is to estimate the actual SMB parameters of the Rhône Glacier. These results are then compared to glaciological measurements provided by GLAMOS to assess the plausibility of the calibrated parameters.
2.3. Experimental design
2.3.1. Twin Experiment—sensitivity study
To systematically evaluate the performance of the EnKF and its sensitivity to internal settings, we design a Twin Experiment based on the setup described in the previous sections. In this controlled environment, we vary one hyperparameter at a time while keeping all others fixed. The use of synthetic elevation change observations, which are generated with known SMB parameters, ensures a consistent reference for evaluation, allowing us to isolate the influence of each individual setting on the calibration outcome.
The first hyperparameter is the ensemble size n, which defines the number of members in the ensemble. Each member represents a plausible realization of the SMB parameters, sampled from the prior distribution 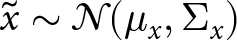 $\tilde{x} \sim \mathcal{N}(\mu_x, \Sigma_x)$. The second hyperparameter is the number of iterations i, i.e. how many times the EnKF calibration cycle is repeated using the same observation. This iterative approach is necessary because a single iteration is often not sufficient to reach the convergence targeting only one long-term observation.
The third hyperparameter is the elevation bin height h, which determines the vertical resolution at which the simulated and observed elevation change fields are aggregated. This binning leverages the elevation-dependent nature of the SMB model, reducing the dimensionality of the data and improving computational efficiency. Although spatial details are lost in horizontal direction, this simplification is justified because such detail cannot be resolved by the SMB model and would not contribute to improved calibration.
The fourth hyperparameter is the observation uncertainty u, which defines the diagonal entries of the observation error covariance matrix R. We assume a uniform uncertainty across all elevation bins, consistent with long-term elevation change products.
Finally, the fifth hyperparameter is the initial offset o from the true parameter values used to generate the synthetic reference data. This offset determines how far the initial ensemble is placed from the optimum and directly defines the bias in the prior distribution. The spread of the prior is kept fixed across all experiments. A larger offset reflects a bad initial parameter estimate and allows us to assess the robustness of the method under poorly constrained conditions.
Each SMB parameter is drawn from a Gaussian distribution with a mean defined by the offset and a fixed standard deviation:
 \begin{align}
s_{ELA} &\sim \mathcal{N}\left(s_{ELA_{true}} \pm o \cdot \sigma_{s_{ELA}},\ \sigma_{s_{ELA}}\right)~\text{[m]},
\end{align}
\begin{align}
s_{ELA} &\sim \mathcal{N}\left(s_{ELA_{true}} \pm o \cdot \sigma_{s_{ELA}},\ \sigma_{s_{ELA}}\right)~\text{[m]},
\end{align} \begin{align}
\gamma_{abl} &\sim \mathcal{N}\left(\gamma_{abl_{true}} \pm o \cdot \sigma_{\gamma_{abl}},\ \sigma_{\gamma_{abl}} \right)~\text{[m\,a}^{-1}\,\text{km}^{-1}],
\end{align}
\begin{align}
\gamma_{abl} &\sim \mathcal{N}\left(\gamma_{abl_{true}} \pm o \cdot \sigma_{\gamma_{abl}},\ \sigma_{\gamma_{abl}} \right)~\text{[m\,a}^{-1}\,\text{km}^{-1}],
\end{align} \begin{align}
\gamma_{acc} &\sim \mathcal{N}\left(\gamma_{acc_{true}} \pm o \cdot \sigma_{\gamma_{acc}},\ \sigma_{\gamma_{acc}}\right)~\text{[m\,a}^{-1}\,\text{km}^{-1}].
\end{align}
\begin{align}
\gamma_{acc} &\sim \mathcal{N}\left(\gamma_{acc_{true}} \pm o \cdot \sigma_{\gamma_{acc}},\ \sigma_{\gamma_{acc}}\right)~\text{[m\,a}^{-1}\,\text{km}^{-1}].
\end{align} Here,  $s_{ELA_{true}}$, $\gamma_{abl_{true}}$ and $\gamma_{acc_{true}}$ represent the true values of the ELA, the ablation gradient and the accumulation gradient, respectively. The offset value o is randomly sampled between 0 and 1 and multiplied by the relatively large standard deviation of the respective variable ( $\sigma_{s{ELA}}=500$, $\sigma_{\gamma{acc}}=\sigma_{\gamma{acc}}=5$). Subsequently, the resultant values are then randomly either added or subtracted from the true mean value to define the mean of the sample. This prior range is deliberately chosen to be large to reflect our poor knowledge of SMB variables in many glacierized regions. Yet it assures that the true target value remains within one standard deviation.
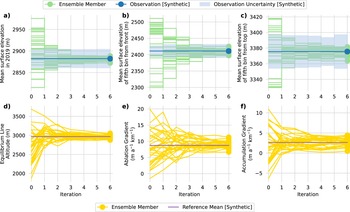
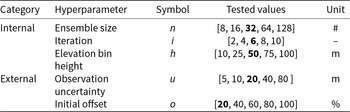
We evaluate the influence of all five hyperparameters (ensemble size n, iteration count i, elevation bin height h, observation uncertainty u and initial offset o) on the final EnKF estimate using the mean absolute error (MAE) between the estimated and reference SMB parameters. Each sensitivity experiment varies only one hyperparameter at a time, while keeping the others fixed at their default values: n = 32, i = 6, h = 50 m, u = 20 m and  $o = 20\%$. The tested value ranges are listed in Table 1. A representative run using the default is shown in Figs. 4 and 5.
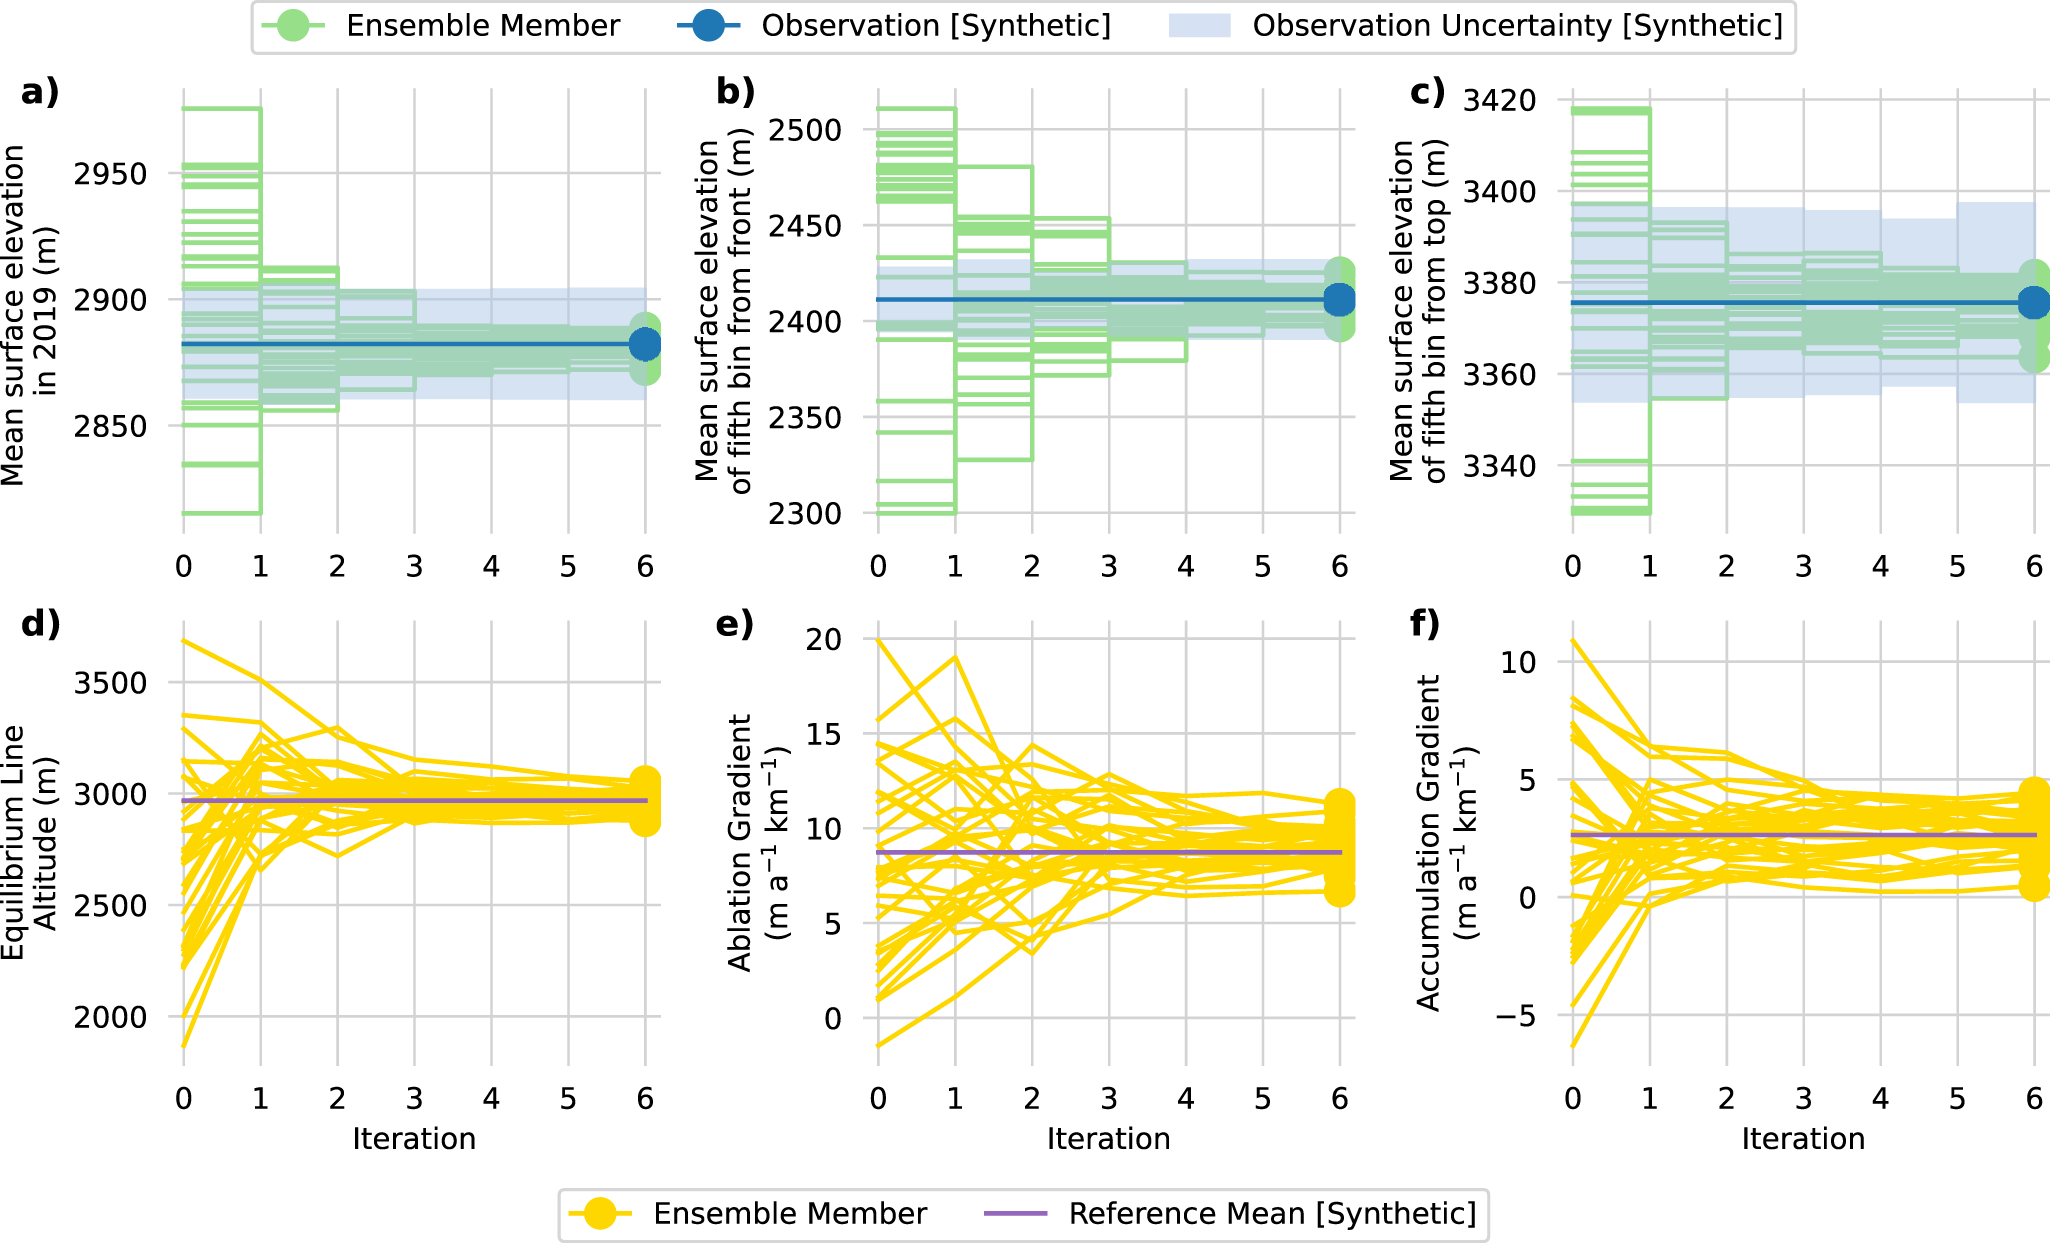
Calibration of SMB parameters using the EnKF in the Twin Experiment. Panels (a–c) show the surface elevation of the reference simulation (blue) with uncertainty, and the modelled elevation from each ensemble member (green). (a) shows the mean surface elevation, while (b, c) display representative elevation bins from the ablation and accumulation areas, respectively. Panels (d–f) show the calibration of the three SMB parameters: (d) ELA, (e) Ablation gradient and (f) Accumulation gradient. The synthetic reference values are shown in purple, and the EnKF ensemble mean in yellow.
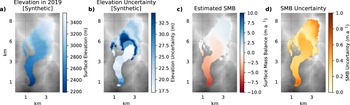
Spatial outputs from the Twin Experiment. (a) Surface elevation in 2019 from the synthetic reference simulation, aggregated into elevation bins. (b) Associated uncertainty of the surface elevation. (c) Estimated SMB field after EnKF calibration. (d) Uncertainty in the estimated SMB, derived from the ensemble spread.

Overview of tested hyperparameter values used in the sensitivity analysis

Hyperparameters are grouped into internal (related to the algorithm setup) and external (related to the input data). Fixed values used in the baseline experiments are shown in bold, while each hyperparameter is varied individually in the sensitivity tests. These values are also used as default for the Real-World Experiment.
2.3.2. Real-World Experiment
In the Real-World Experiment, we apply our method to the Rhône Glacier using remote-sensing observations. Based on the sensitivity analysis from the Twin Experiment, we adopt the default values for the internal hyperparameters that control the performance of the EnKF, namely the ensemble size, number of iterations and elevation bin height. These values are listed in Table 1. The observation uncertainty in this case is provided by the data source and is therefore not treated as a tunable parameter. Likewise, no initial offset is applied, since we do not know the true SMB parameters in a Real-World setting.
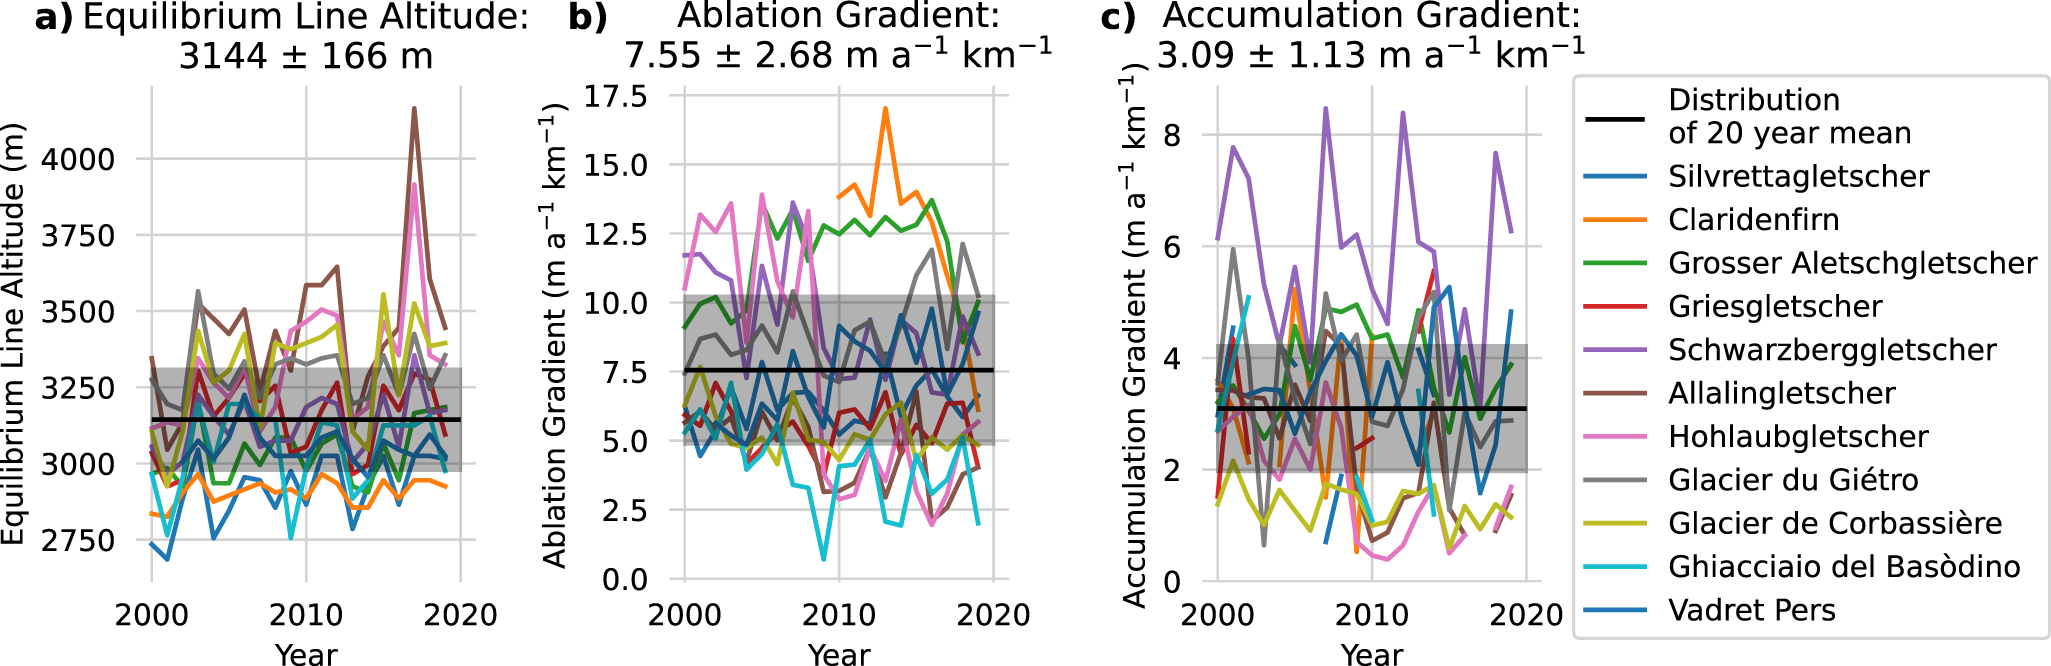
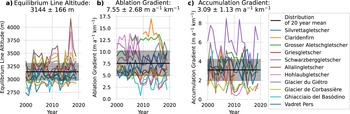
Moreover, we choose our prior for the SMB parameters based on the GLAMOS dataset, from which we extracted the SMB parameters for all available glaciers in the region (see Fig. 6). The regional average of these parameters serves as the prior mean for the ensemble, and the corresponding standard deviation is used to define the ensemble spread. The task of the calibration method is then to constrain this regional prior to the specific conditions of Rhône Glacier.
Temporal evolution and distribution of the SMB parameters across selected glaciers in the Swiss Alps, where measurements are available for at least 15 of the 20 years from GLAMOS - Glacier Monitoring Switzerland (2023). The panels show the time series from 2000 to 2020 for: (a) ELA, (b) Ablation Gradient and (c) Accumulation Gradient. Individual glacier curves are shown in colour, while the black boxplot in each panel represents the distribution of the 20 year mean for all glaciers. Mean and standard deviation for each parameter are provided in the panel titles.
To derive the 2019 surface elevation, we use NASADEM from the year 2000 as a baseline and apply the gridded, glacier-specific elevation change rates ( $\Delta h / \Delta t$) over the 2000–19 period from Hugonnet and others Reference Hugonnet(2021). The corresponding elevation uncertainty is estimated by multiplying the per-pixel uncertainty in the elevation change rate by the square root of the 20 year time span, assuming temporal independence of errors. We then evaluate the calibrated SMB parameters by comparing them to glaciological SMB measurements from GLAMOS - Glacier Monitoring Switzerland (2023), which are aggregated by elevation bins.
3. Results
We begin this section by evaluating the sensitivity of our method to five key hyperparameters using the Twin Experiment setup. These include three internal parameters (ensemble size, iteration count and elevation bin height) that are related to the algorithm configuration and are expected to yield stable results when calibrating the SMB of other glaciers. In contrast, observation uncertainty and initial parameter offset are external parameters, as they depend on the observations of the glacier and prior knowledge. Based on these sensitivity experiments, we select a set of reasonable parameter values for the Real-World application, taking into account both the observed trends and the fact that the Real-World observations are derived from processed remote sensing products rather than from a controlled twin setup. We then apply these settings to calibrate the SMB model for the Rhône Glacier.
3.1. Influence of hyperparameters in the Twin Experiment
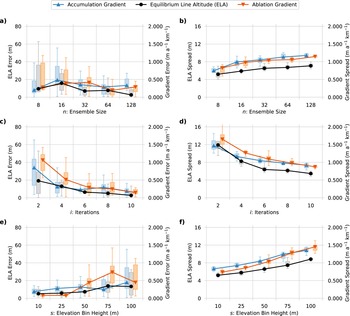
The sensitivity of our EnKF assimilation procedure is evaluated for each hyperparameter individually (see Figs. 7 and 8). Each column in the plots represents the results from 10 independent calibration runs using different random seeds, which generate slightly different initial ensembles despite sharing the same prior distribution (mean and standard deviation). Panels (a) and (b) in Fig. 7 show the effect of ensemble size n on the MAE and the final ensemble spread, respectively. While increasing the ensemble size does not significantly reduce the mean MAE, it notably decreases the variability between runs, indicating improved stability and reproducibility. The final ensemble spread increases with ensemble size, likely due to more extensive sampling of the prior distribution. While some increase is still observed beyond n = 32. A convergence of the spread magnitude is notable, suggesting a stable spread as ensemble size increases further. This behaviour is expected, as the spread should eventually reflect the true uncertainty and become independent of the ensemble size.
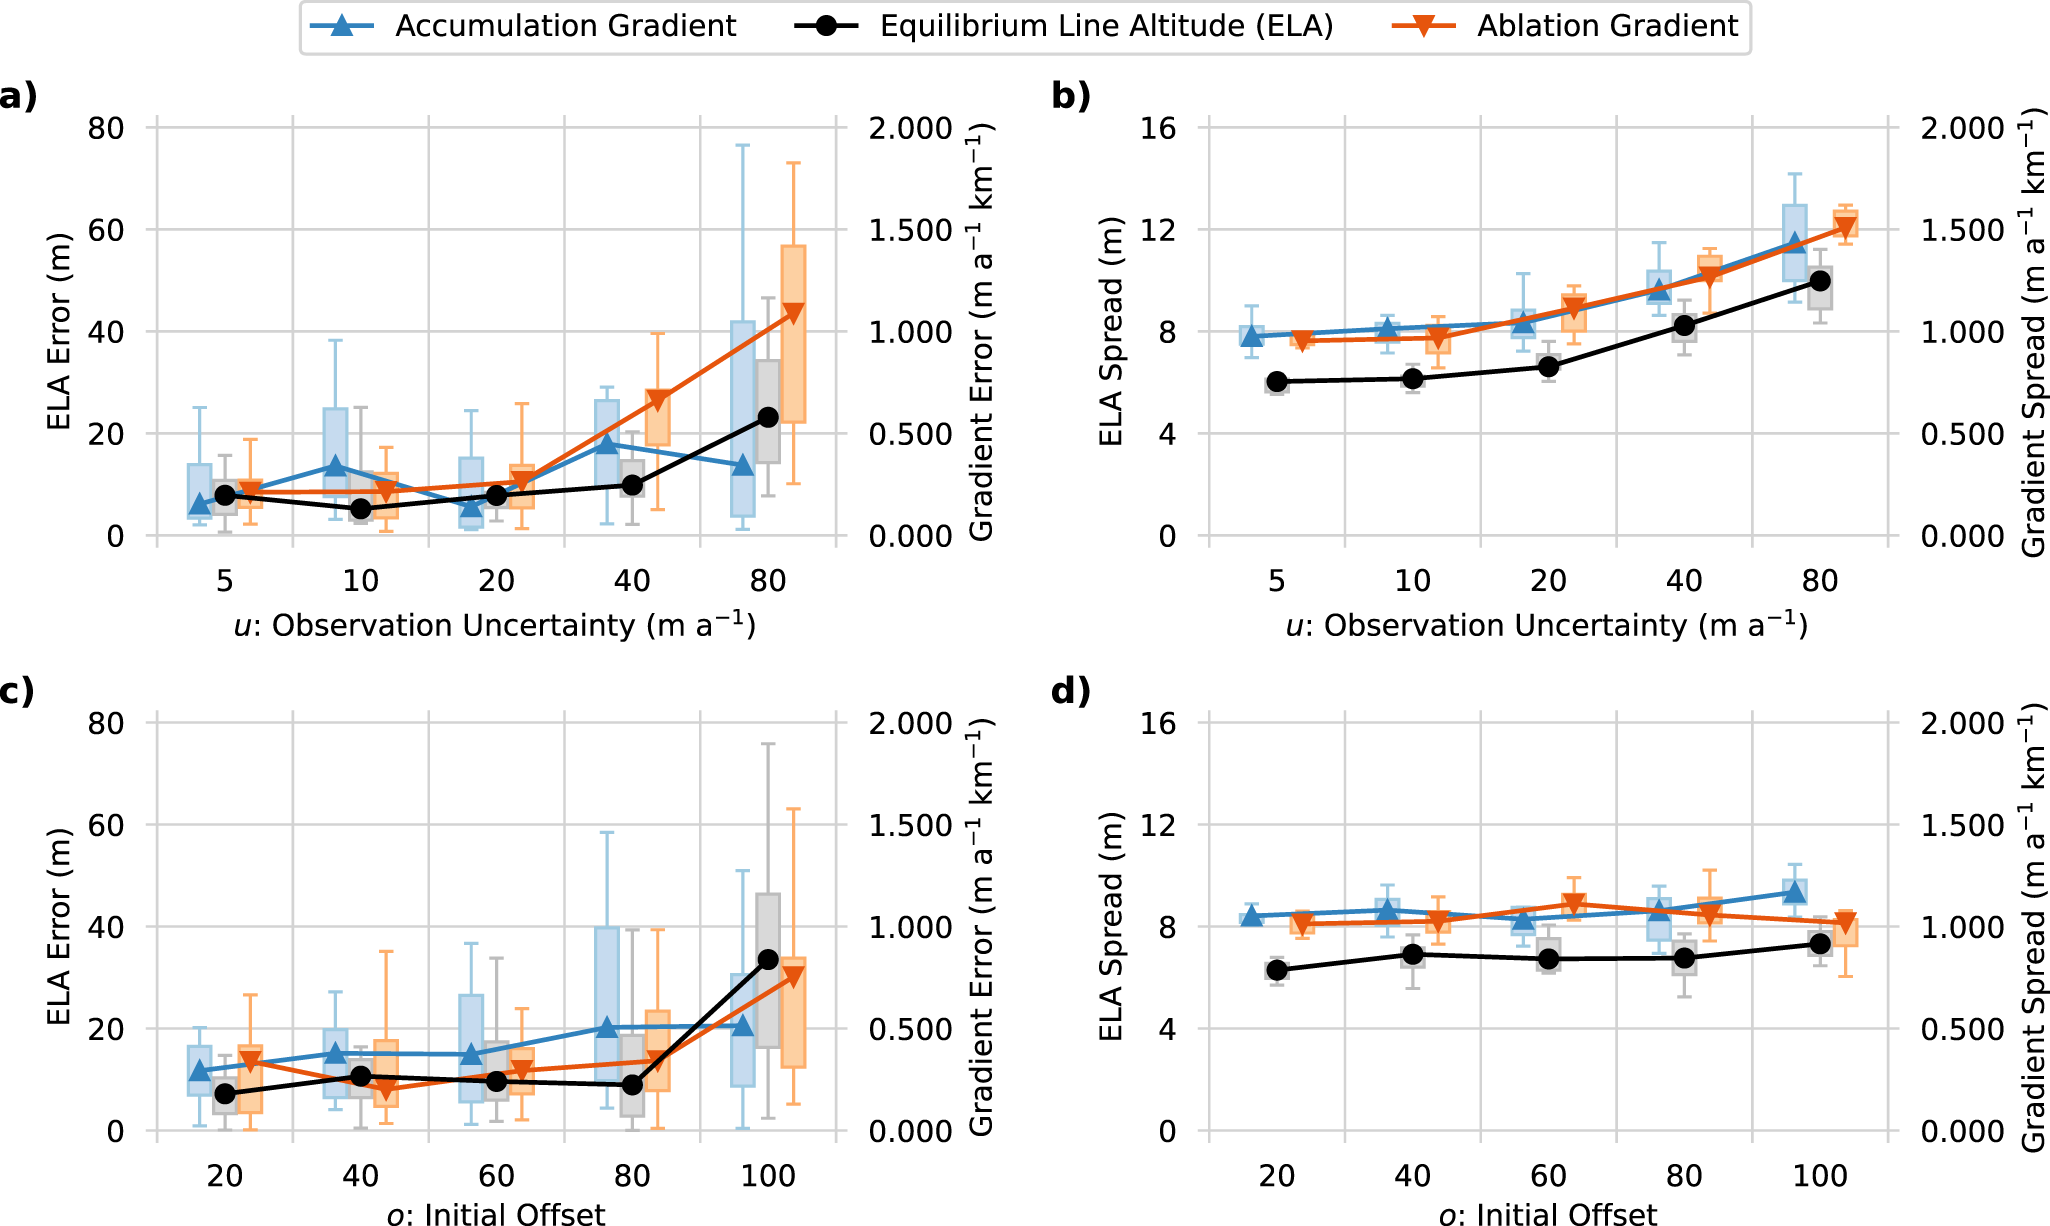
Sensitivity analysis showing the influence of three internal hyperparameters: ensemble size n (a, b), iteration count i (c, d) and elevation bin height s (e, f) on the calibration of SMB parameters in the Twin Experiment. Left panels (a, c, e) show the normalized MAE between the estimated and reference values. Right panels (b, d, f) show the spread of the final parameter ensemble. Each subplot distinguishes results for ELA, ablation gradient and accumulation gradient.

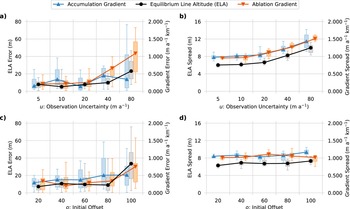
Sensitivity of the EnKF calibration to external hyperparameters: observation uncertainty (a, b) and initial parameter offset (c, d). Panels on the left (a, c) show the normalized MAE between the estimated and true SMB parameters. Panels on the right (b, d) display the spread of the final ensemble, representing internal consistency. Results are shown separately for the ELA, ablation gradient and accumulation gradient.
Panels (c) and (d) in Fig. 7 illustrate the sensitivity of the final parameter estimates to the number of iterations. Both the MAE and the ensemble spread decrease with more iterations, indicating that additional cycles improve the calibration. However, the rate of improvement diminishes beyond six iterations, suggesting that most of the refinement occurs early in the process. After this point, further gains are marginal and may be increasingly influenced by ensemble undersampling effects, which can artificially reduce the observed spread. These results support the use of six iterations as a practical default, offering a good compromise between computational cost and calibration accuracy.
Panels (e) and (f) in Fig. 7 show the influence of the elevation bin height h on the final parameter estimates. Smaller bin heights lead to lower MAE and smaller ensemble spread, as they allow the assimilation procedure to resolve elevation-dependent features of the SMB more precisely. However, this improvement comes with a computational cost, as the size of the covariance matrix scales quadratically with the number of elevation bins. Additionally, smaller bin heights increase the sensitivity of individual bins to observational noise, since fewer data points are aggregated per bin. While this effect is not strongly evident in our results, it may become more prominent for elevation bins smaller than those tested here.
Panels (a) and (b) in Fig. 8 show the effect of observation uncertainty u on the calibration outcome. As expected, both the MAE and the ensemble spread increase with higher observational uncertainty. However, this dependency is not entirely direct due to our binning approach: each elevation bin aggregates multiple pixels, so the final uncertainty depends not only on individual pixel uncertainties but also on the number of pixels per bin and their spatial distribution. Despite this complexity, we observe a strong and consistent relationship between the input uncertainty and the final ensemble spread. This reinforces our interpretation of the ensemble spread as a reliable proxy for the uncertainty in the estimated SMB parameters.
Panels (c) and (d) in Fig. 8 illustrate the effect of the initial offset o on the calibration outcome. We find that the mean MAE remains relatively stable up to an offset of 80%, which corresponds to a ± 400 m deviation in ELA and ± 4 m a−1 km−1 in the ablation and accumulation gradients. This indicates that the method can reliably recover accurate parameter estimates even from poorly informed priors. Only the highest tested offset of 100% leads to a significant degradation in performance, probably because the prior ensemble no longer fully captures the true parameters. While the average error remains stable for moderate offsets, the variability between individual calibration runs increases with offset. Importantly, the final ensemble spread around the mean remains nearly constant, indicating that the method maintains a consistent measure of posterior uncertainty regardless of prior bias.
3.2. Results of Real-World Experiment
Based on the findings from the sensitivity analysis, we selected a fixed set of internal hyperparameters for the Real-World application: an ensemble size of n = 32, an iteration count of i = 6 and an elevation bin height of h = 50 m. These values showed stable and reliable performance during the Twin Experiment and offer a good trade-off between accuracy and computational efficiency. For the external hyperparameters, we derived the prior distribution of the SMB parameters from the regional GLAMOS dataset. Specifically, we computed the regional average across all available glaciers to serve as the ensemble mean and used the corresponding standard deviation as ensemble spread. This setup allows our method to calibrate the regional prior toward the specific characteristics of the Rhône Glacier.
The observation uncertainty was derived directly from the elevation change product, including uncertainty maps, by Hugonnet and others Reference Hugonnet(2021).
The resulting calibrated SMB parameters for the Rhône Glacier over the period 2000–19 are: an ELA of 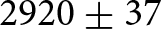 $2920 \pm 37$ m, an ablation gradient of $13.39 \pm 1.10$ m a−1 km−1 and an accumulation gradient of $2.36 \pm 0.91$ m a−1 km−1. These values reflect both the glacier’s geometry and the observed elevation change, as shown in Fig. 10. The iterative progression of the calibration is visualized in Fig. 9, illustrating how the ensemble estimates converge over the course of the six assimilation steps.
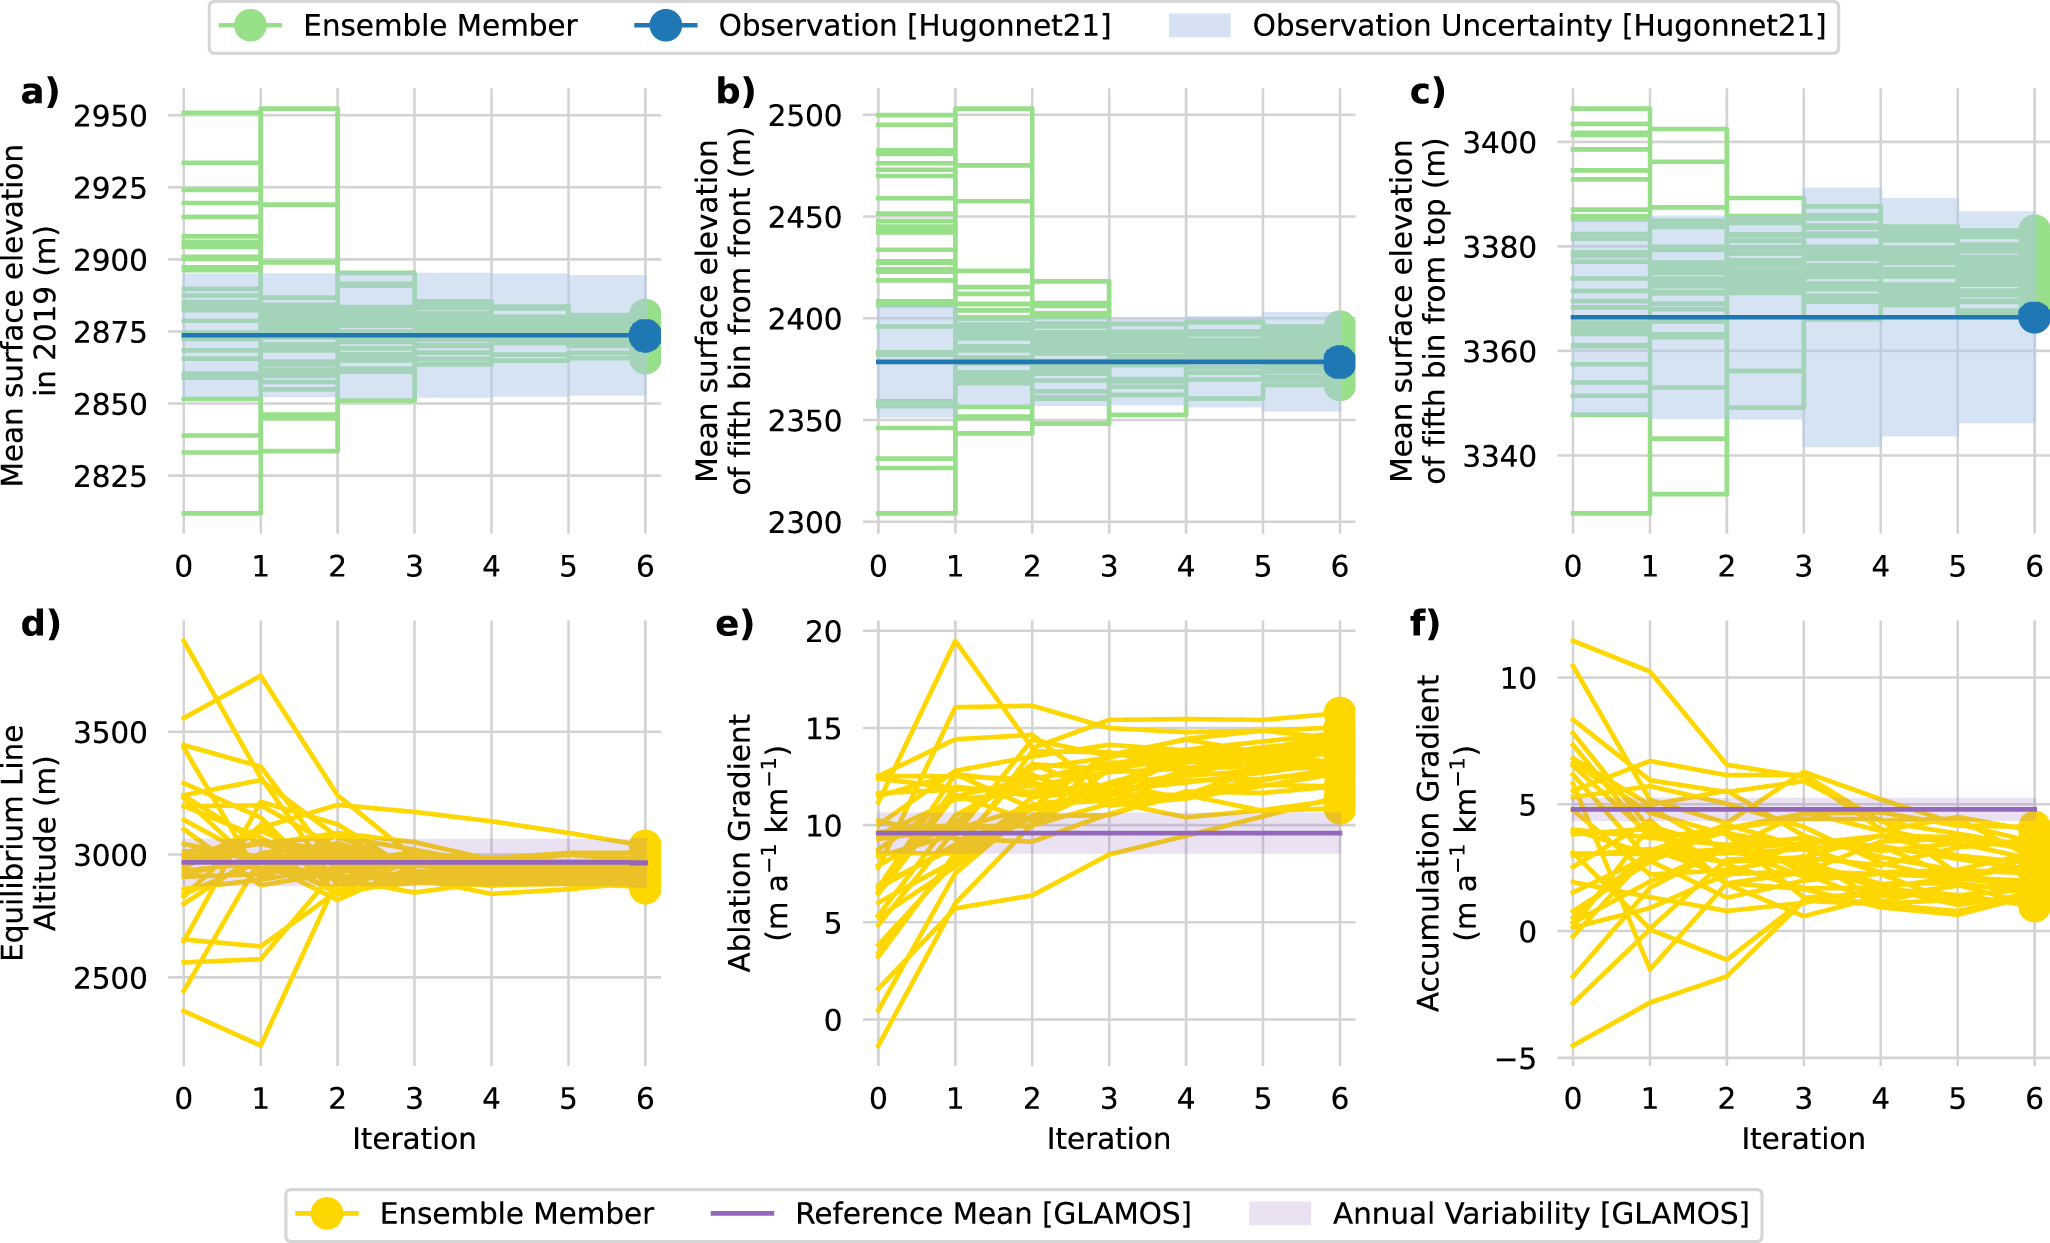
Calibration of SMB parameters using the EnKF in the Real-World Experiment. Panels (a–c) show the surface elevation in 2019 from the reference (Hugonnet and others, Reference Hugonnet2021) (blue) with uncertainty, and the modelled elevation from each ensemble member (green). (a) shows the mean surface elevation, while (b, c) display representative elevation bins from the ablation and accumulation areas, respectively. Panels (d–f) show the calibration of the three SMB parameters: (d) ELA, (e) Ablation gradient and (f) Accumulation gradient. The reference values from GLAMOS - Glacier Monitoring Switzerland (2023) are shown in purple, and the EnKF ensemble mean in yellow.
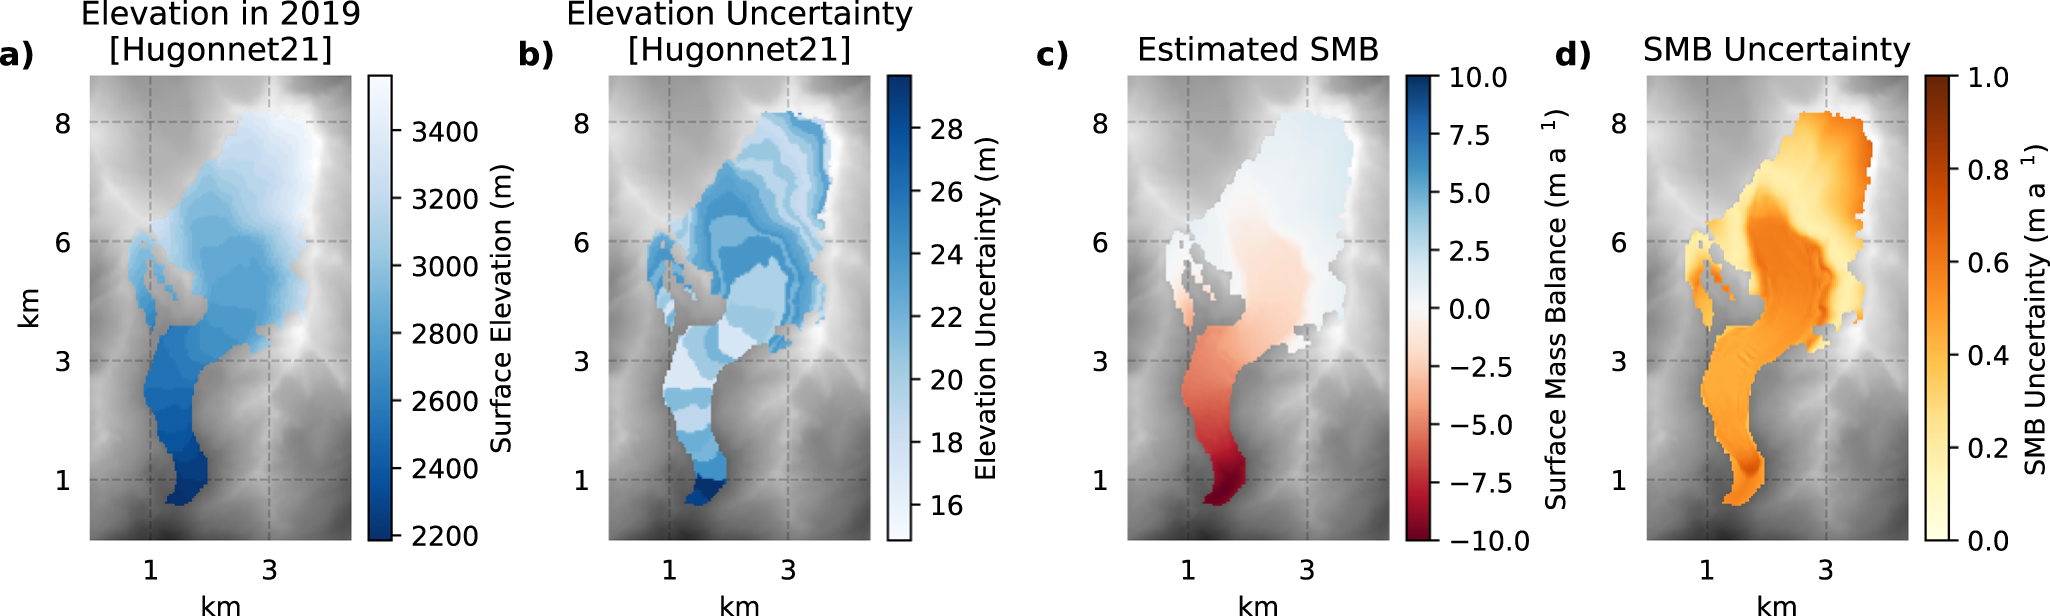
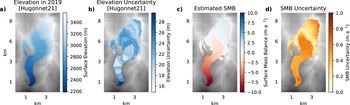
Calibration results of the Rhône Glacier using elevation change observations from Hugonnet and others Reference Hugonnet(2021). Panels (a, b) show the 2019 surface elevation and the corresponding elevation uncertainty derived from remote sensing observations. Panels (c, d) show the estimated SMB field and the associated uncertainty after EnKF calibration. All fields are displayed as maps over the glacier domain, illustrating the spatial structure of both the input observations and the resulting parameter estimates.
4. Discussion
We successfully coupled the 3-D glacier model IGM with the EnKF, resulting in an open-source pipeline for systematic calibration of glacier models using remote sensing observations. The full workflow is publicly available at https://github.com/FAU-glacier-systems/FROST and can be easily adapted to other glaciers via the data acquisition tools provided by IGM and OGGM.
Our sensitivity analysis shows that an ensemble size of  $n \geq 32$ provides stable and robust calibration results for an elevation-dependent SMB model with three unknown parameters. For more complex models, such as those used in Gabbi and others Reference Gabbi, Carenzo, Pellicciotti, Bauder and Funk(2014) and Sauter and others Reference Sauter, Arndt and Schneider2020, or for a greater number of free parameters, a larger ensemble size is likely required. Since the elevation-based SMB model does not include a horizontal dimension, elevation change data can be aggregated into elevation bins without losing relevant information. Our sensitivity study shows that while larger elevation bins reduce calibration performance, they also lower computational cost. While reducing computational cost was one motivation for binning, the primary reason was that using unbinned elevation change maps led to less consistent calibration results. This binning approach is specific to 1-D elevation-dependent models and is not applicable to 2D SMB models that resolve horizontal variations, such as those caused by debris cover or shading.
The sensitivity study clearly demonstrates that observation uncertainty directly influences the uncertainty of the final parameter estimates, including ELA, ablation and accumulation gradients. This strong relationship reinforces the interpretation of the ensemble spread as a meaningful proxy for parameter uncertainty.
The initial offset from the true parameter values, used to define the prior ensemble mean, has only a minor effect on the final result. As long as the prior includes the true value, the method converges toward accurate estimates. This behaviour aligns with Bayesian inference using weakly informative priors. While encouraging, this also reflects the data-dominant nature of the setup. Performance under biased or overconfident priors is not assessed and may expose limitations of ensemble-based approaches. This is particularly important for poorly constrained glaciers and warrants future investigation.
Based on observations from Hugonnet and others Reference Hugonnet(2021), our method estimates a mean ELA between 2000 and 2019 of 2920 ± 37 m for the Rhône Glacier (Fig. 11), which is close to the glaciologically derived mean ELA of 2968 m for 2007–19 (GLAMOS - Glacier Monitoring Switzerland, 2023). The reported uncertainty of ±37 m reflects only the propagated uncertainty from the elevation change observations and does not include other model uncertainties such as dynamics or structural assumptions. While the multi-year averaging reduces variability compared to annual estimates, caution is still warranted: ensemble-based methods like the EnKF may underestimate posterior uncertainty in nonlinear systems (Iglesias and others, Reference Iglesias, Law and Stuart2013). The actual uncertainty may therefore be larger.
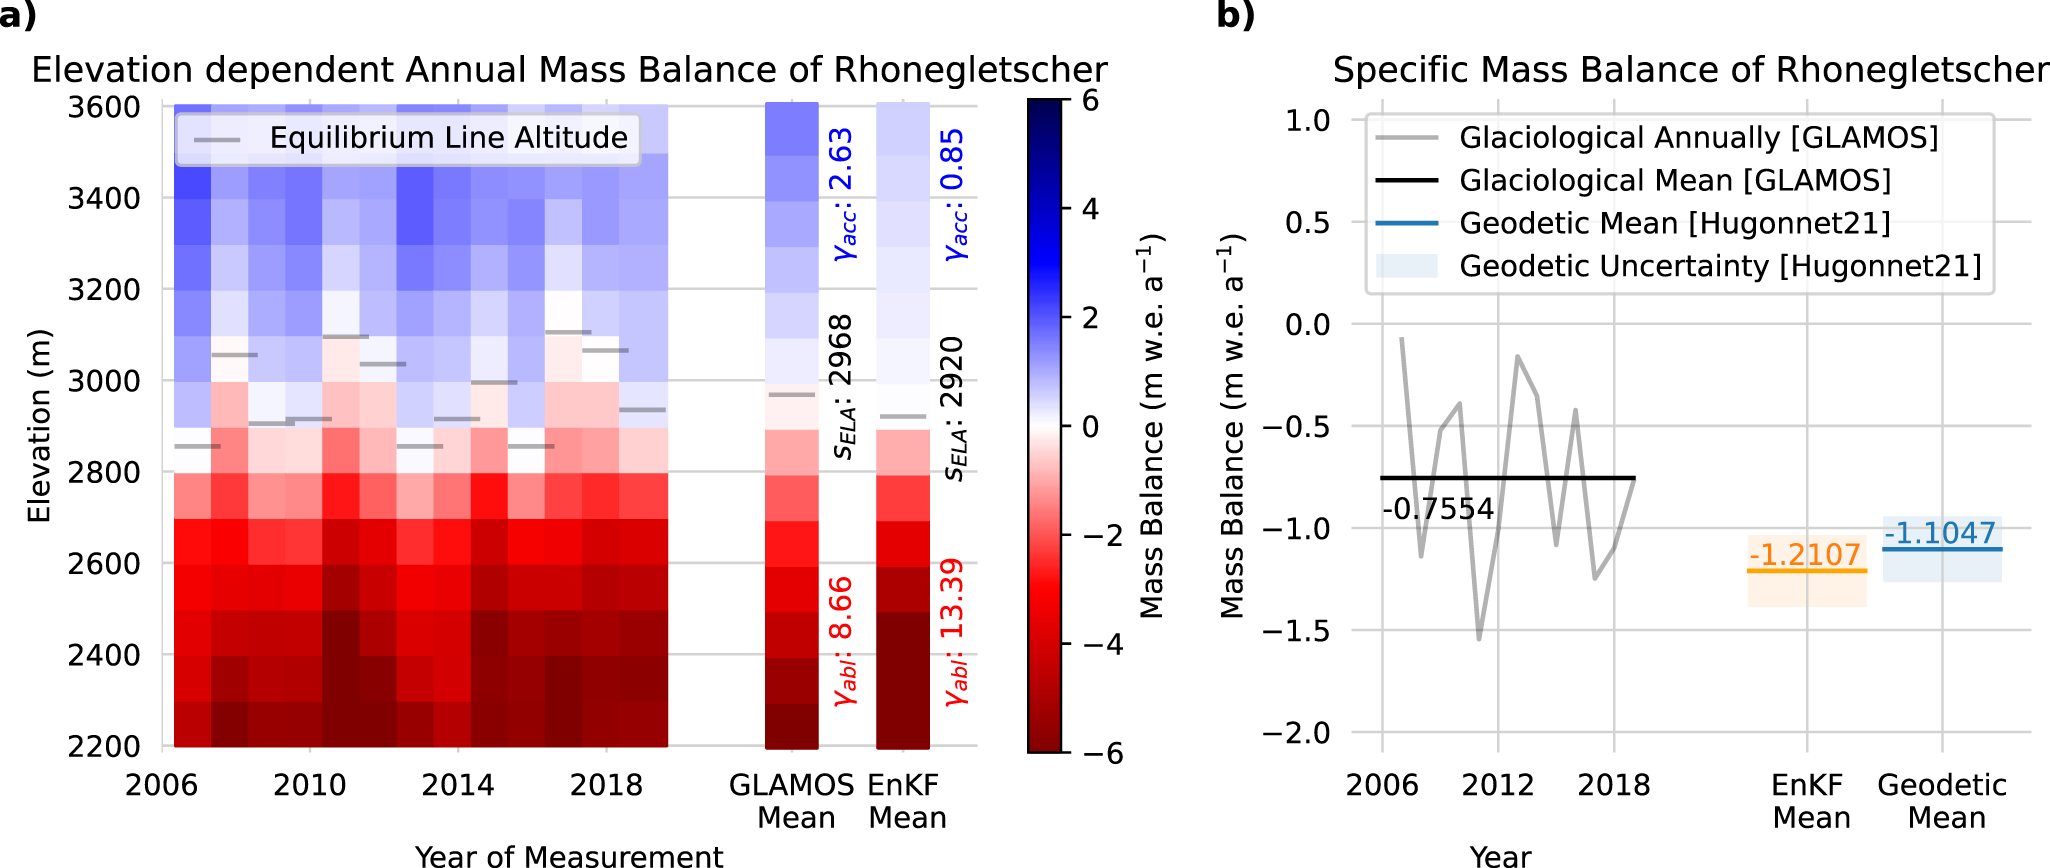
Comparison of glaciological measurements (GLAMOS - Glacier Monitoring Switzerland, 2023) with EnKF estimates for the Rhône Glacier. On the left, glaciological data are organized by year and elevation bins. The rightmost columns display the means for the GLAMOS period (2007–19) and the EnKF period (2000–19), along with the gradients in water equivalent. We converted the EnKF gradient estimates from elevation change (m) to mass change (m w.e.) using densities of 910 kg m−3 in the ablation zone and 550 kg m−3 in the accumulation zone. The right panel presents the specific mass balance from Hugonnet and others Reference Hugonnet(2021), GLAMOS and EnKF.

The estimated ablation gradient of 13.39 ± 0.99 m w.e. a−1 km−1 is higher than the measured value of 8.66 m w.e. a−1 km−1, while the estimated accumulation gradient (0.84 ± 0.54 m w.e. a−1 km−1) is lower than the measured 2.63 m w.e. a−1 km−1. Such discrepancies are common, especially for accumulation gradients due to fewer measurements and snow density variability (WGMS, 2024).
Another explanation for the deviating SMB parameters is the mismatch between the modelled ice velocity and the observed surface velocity from Millan and others Reference Millan, Mouginot, Rabatel and Morlighem(2022) (see Fig. 3). This highlights a potential weakness of our approach: the calibration relies heavily on the quality of the initial inversion, which estimates basal sliding and ice thickness. In particular, the inferred SMB gradients are strongly influenced by the glacier flow. If the modelled velocity field does not accurately reflect the real glacier motion, the resulting elevation change will deviate from observations, potentially biasing the calibrated SMB parameters. A comparison between the specific mass balance shows that the geodetic estimate and the ensemble estimate are aligned and within the uncertainty range (Fig. 11b). This is not surprising because the ensemble is optimized based on geodetic data. The glaciological data are completely independent of the geodetic data and are never used during calibration. As such measurements are labour intensive, they are only available at specific points for a restricted number of glaciers around the world. In contrast, the geodetic elevation change has almost global coverage, but has a higher uncertainty and includes not only the SMB but also the flux divergence.
The calibration method of Maussion and others Reference Maussion(2019) estimates temperature sensitivity parameters based on interpolated equilibrium conditions from glaciers with observations. While this approach enables global scalability, it assumes regional consistency, which may not hold in topographically diverse regions. In contrast, our method yields glacier-specific parameter estimates and associated uncertainties, offering a flexible framework for calibrating glacier models. As satellite remote sensing expands, the EnKF provides a practical framework to integrate distributed observations into glacier models and improve parameter calibration in a physically consistent way.
In terms of performance, the EnKF calibration results deviate from glaciological measurements by 0.45 ± 0.17 m w.e., which is similar in magnitude to the MAE reported by Zekollari and others Reference Zekollari, Huss and Farinotti2019. They state that their regionally calibrated SMB model achieves a mean MAE of 0.67 m w.e. a−1. Although these values appear close, they are not directly comparable due to differences in spatial scale, calibration approach, and the fact that our error estimate is based on a single glacier. Furthermore, their method involves regional calibration tailored specifically to SMB parameters such as degree-day factors and precipitation scaling.
A more appropriate methodological comparison is Rounce and others Reference Rounce2023, who used a Markov Chain Monte Carlo (MCMC) method to calibrate a global GEM, achieving MAE values of 0.54 m w.e. a−1 globally and 0.49 m w.e. a−1 for Central Europe. While their approach relies on glacier-wide scalar mass-balance values, our method directly assimilates spatially distributed elevation change fields. This can potentially improve the elevation-resolved calibration of SMB parameters. Although we apply this only to a single, long-term dataset in this proof-of-concept study, the framework can accommodate temporally resolved observations in future applications.
Sjursen and others Reference Sjursen, Dunse, Tambue, Schuler and Andreassen2023 showed how the temporal resolution of observations affects parameter calibration. Their work emphasized the importance of seasonal data for resolving accumulation and ablation separately. In contrast, our approach focuses on the long-term mean signal and does not resolve seasonal sensitivity. Future developments could combine spatially and temporally resolved datasets to further constrain model parameters.
While the EnKF is computationally efficient and well suited for sequential data assimilation, it relies on key assumptions that may limit its applicability in certain settings. Most notably, it approximates uncertainties using Gaussian distributions and linear correlations, which can be problematic in systems with strong nonlinearities or non-Gaussian behaviour, such as abrupt glacier responses to climate extremes. In contrast, MCMC methods are more flexible and can capture complex posterior distributions, but they come with higher computational costs (e.g. Rounce and others, Reference Rounce, Hock and Shean2020a). These trade-offs are important to consider, particularly when applying the EnKF to transient or highly dynamic glacier systems.
5. Conclusion and outlook
In this study, we presented a method for automatic calibration of GEMs combining inverse techniques with the EnKF building on the growing amount of remote sensing data. We showed that the EnKF is capable of estimating key SMB parameters, including the ELA, ablation gradient and the accumulation gradient, using surface elevation change maps. Our synthetic experiment demonstrates that the method is robust to the initial parameter offset and that increasing the ensemble size improves the accuracy of the parameter estimates. Importantly, we found that the observation uncertainty has a direct impact on the final ensemble spread, allowing the spread to be interpreted as a measure of uncertainty in the calibrated SMB parameters.
Applying this method to the Rhône Glacier with the elevation change data of Hugonnet and others Reference Hugonnet(2021) resulted in estimates of the ELA, ablation gradient and accumulation gradient that are in reasonable agreement with observed values. However, we observe discrepancies in the gradients, likely due to the density uncertainties of ice, firn and snow, and remaining equifinalities in the calibration. Despite this, the specific mass balance estimates aligned well with the geodetic measurements, illustrating the utility of the EnKF for glacier model calibration. At first glance, the EnKF can compete with other existing calibration methods. Its benefits are based on a systematic quantification of uncertainties associated with the initial state and the mode adequacy. The EnKF GEM calibration framework supports the transient assimilation of available and upcoming satellite remote sensing data and can easily be extended to other observations and other target parameters. In this way, regional and global glacier projections can be improved to better serve the needs of impact studies. The EnKF flexibility will be a further asset for such an adaptation.
Future work will involve developing a more sophisticated SMB model and incorporating a larger set of observations. The goal is to create a globally applicable data assimilation strategy that systematically leverages available observations to minimize uncertainty in estimating the current state of the glacier.
Code availability
The code implementing the data assimilation using the EnKF and coupling it to IGM is publicly available on GitHub https://github.com/FAU-glacier-systems/FROST. The glacier model IGM is also available on GitHub https://github.com/jouvetg/igm.
Acknowledgements
OH, JJF and ARG received primary funding from the European Union’s Horizon 2020 research and innovation programme via the European Research Council (ERC) as a Starting Grant (FRAGILE project) under grant Agreement No. 948290. IT was supported by the DFG Individual Research Grant project RESPONSE (No. 495516510). OH received additional training through the International Doctoral Program ‘Measuring and Modelling Mountain Glaciers and Ice Caps in a Changing Climate’ (M3OCCA) funded by the Bavarian State Ministry of Science and Arts under the Elite Network Bavaria. The authors gratefully acknowledge the scientific support and HPC resources provided by the Erlangen National High Performance Computing Center (NHR@FAU) of the Friedrich-Alexander-Universität Erlangen-Nürnberg (FAU). NHR funding is provided by federal and Bavarian state authorities. NHR@FAU hardware is partially funded by the German Research Foundation (DFG) (No. 440719683). We thank Hugonnet and others and Millan and others for making their datasets publicly available. Furthermore, we acknowledge the efforts of GLAMOS - Glacier Monitoring Switzerland for providing the stake measurements aggregated into elevation bands. Finally, we would like to thank Romain Hugonnet for his assistance and for taking the time to explain how to interpret the elevation change error. His input was crucial for understanding and appropriately handling the surface elevation change data as observations within our framework. Parts of the manuscript were refined using ChatGPT (OpenAI, version May 2025) to improve clarity and wording. All scientific content and interpretations were developed and verified by the authors.
Author contributions
OH and JJF were responsible forthe conceptualization of the study. OH developed and implemented the methodology and software for the experiments. GJ supported the integration of IGM into the EnKF and determined the optimal inversion parameters for the Real-World application. JJF, ARG and IT supervised the study. OH performed and analysed the experiment and visually prepared the results. OH wrote the paper. JJF, ARG, GJ and IT reviewed and edited the article, as well as contributed to its revision.
Competing interests
The authors declare that they have no competing interests.


 Open access