


The commensal microbes that reside within the gastrointestinal tract are implicated in human health and disease. Host genetics( Reference Goodrich, Davenport and Beaumont 1 ), life stage, geographical location( Reference Yatsunenko, Rey and Manary 2 ), sex( Reference Mueller, Saunier and Hanisch 3 ) and antibiotic use( Reference Dethlefsen, Huse and Relman 4 ) influence gut microbiota composition; however, diet plays a major role in modulating the community of microbes that reside within the gut( Reference Wu, Chen and Hoffmann 5 ). Dietary interventions provide an opportunity to manipulate the commensal bacteria towards a more favourable profile to help enhance human health.
Numerous studies have demonstrated that dietary interventions can elicit significant changes in gut microbiota composition and SCFA production. In a recent study, a short-term plant-based diet high in grains, legumes, fruits and vegetables or an animal-based diet composed of meat, eggs and cheese led to distinct shifts in bacterial relative abundance. Interestingly, the animal-based diet had a larger effect on the gut microbiota than the plant-based diet( Reference David, Maurice and Carmody 6 ). Another study demonstrated that a three-week intervention containing high levels of wholegrains or red meat altered numerous bacterial taxa, including Collinsella aerofaciens and certain Clostridium spp., and led to an increase in microbial diversity during the high-wholegrain dietary phase( Reference Foerster, Maskarinec and Reichardt 7 ). Dietary intake in economically developed countries is characterised by intakes of dietary fibre well below recommendations, thus depriving the gut microbiota of valuable fermentable substrates( Reference King, Mainous and Lambourne 8 , 9 ). One method of enriching the diet to positively modulate the gut microbiota is to supplement it with prebiotics. Prebiotics are ‘a substrate that is selectively utilised by host microorganisms conferring a health benefit’( Reference Gibson, Hutkins and Sanders 10 ).
It is becoming increasingly evident that there is profound inter-individual variability in gut microbiota response to dietary interventions. Preliminary research has suggested that factors such as microbial diversity, baseline bifidobacteria concentrations and habitual diet are implicated in gut microbiota responsiveness. A study undertaken by Tap et al.( Reference Tap, Furet and Bensaada 11 ) demonstrated that a short-term alteration in dietary fibre intake in nineteen healthy adults led to differing microbial responses among participants. Participants with higher baseline microbial richness had gut microbiota that were more resilient to change and, therefore, less responsive to the change in dietary fibre intake. Several studies have also established a link between baseline bifidobacteria concentrations and change in bifidobacteria in response to a dietary intervention( Reference Tuohy, Finlay and Wynne 12 – Reference Bouhnik, Raskine and Champion 16 ). Increases in bifidobacteria concentrations are more pronounced in individuals with lower baseline bifidobacteria compared with individuals with higher baseline bifidobacteria concentrations. Preliminary research has shown that habitual diet may also influence gut microbiota responsiveness( Reference Eid, Osmanova and Natchez 17 , Reference Griffin, Ahern and Cheng 18 ). A 21-d palm date intervention did not influence the numbers of select bacterial taxa; however, secondary analysis demonstrated that those with high dietary fibre (HDF) intakes hosted microbiota that were more stable in response to the palm date intervention than those with low dietary fibre (LDF) intakes( Reference Eid, Osmanova and Natchez 17 ).
To date, no human studies have been conducted with the primary aim of determining whether habitual dietary intake influences gut microbiota responsiveness to a dietary intervention. Therefore, we aimed to investigate the influence of differing habitual dietary fibre intakes on the responsiveness of the gut microbiota to an inulin-type fructan prebiotic.
Methods
This randomised, double-blind, placebo-controlled, cross-over, human intervention study was conducted at Massey University, Palmerston North, New Zealand, between March and August 2016. The Massey University Human Ethics Committee approved the study (Massey University HEC: Southern A application – 15/34). The study is registered in the Australian New Zealand Clinical trials registry (ACTRN12615000922572). The study protocol has previously been published( Reference Healey, Brough and Butts 19 ).
Participants
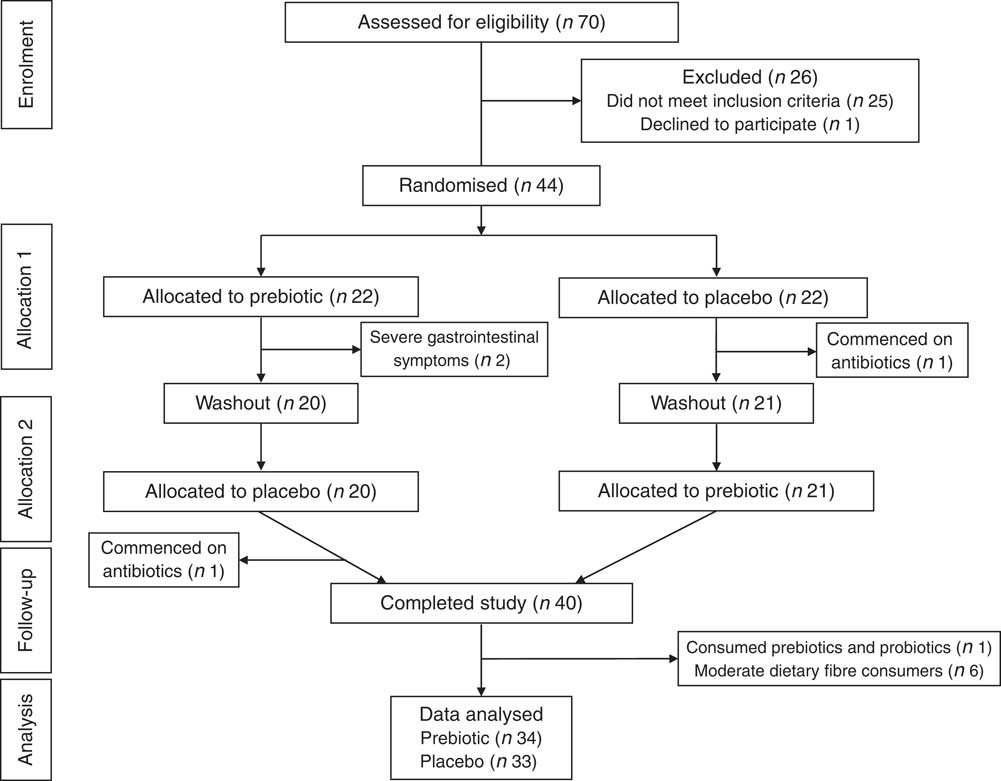
Participants were recruited through email and poster advertisement around Palmerston North, New Zealand. A total of forty-four eligible participants provided written informed consent to participate in this human intervention study (Fig. 1). Participants completed a screening questionnaire to ensure that they met the following inclusion criteria: aged between 19 and 65 years; BMI between 18·5 and 30 kg/m2; healthy (self-reported and confirmed by a health screening blood test (liver and kidney function, blood glucose levels, electrolytes, complete blood count, Ca and C-reactive protein) using standard clinical cut-offs). Exclusion criteria included a significant change in weight (±5 % of total body weight) or dietary intake over the past year; taken antibiotics within the past 6 months; consumption of prebiotic- or probiotic-containing foods, drinks and supplements within the past 1 month; pregnancy or breast-feeding (or plans for a pregnancy within the following 3 months); food intolerances associated with gastrointestinal upset; current smoker; and high alcohol consumer (>15 standards drinks/week for males or >10 standard drinks per week for females, and <2 d/week alcohol free).
Consolidated Standards of Reporting Trials flow diagram.
Participants were also selected based on their habitual dietary fibre intakes. All eligible participants completed a validated habitual dietary fibre intake FFQ( Reference Healey, Brough and Murphy 20 ) during the screening phase of the study to determine whether they were low, moderate or HDF consumers. Only participants categorised with low (<18 g/d for females and <22 g/d for males) or high (≥25 g/d for females and ≥30 g/d for males) dietary fibre intakes were invited to participate in the study. The HDF categories were chosen to reflect the New Zealand recommended dietary fibre intake, which is >25 g/d for females and >30 g/d for males( 21 ). The LDF categories were chosen as the average dietary fibre intake in New Zealand is 17·5 g/d for females and 22·1 g/d for males, which is well below the recommended dietary fibre intakes( 22 ). To ensure that categorisation into low and HDF groups was as accurate as possible, once recruited, participants completed four 3-d diet records. If the average dietary fibre intake from these records was outside of the pre-defined categories described above, the participants’ data were excluded from the analysis.
Interventions
The two interventions were either 16 g/d of powdered inulin-type fructan prebiotic (Orafti® Synergy1 – 50:50 inulin to fructo-oligosaccharide mix; Beneo GmbH) as two 8 g/d doses for 3 weeks or 16 g/d of powdered placebo (Glucidex® 29 Premium-digestible maltodextrin; Roquette Worldwide) as two 8 g/d doses for 3 weeks. The two doses were consumed 30 min before breakfast and 30 min before dinner mixed into hot or cold beverages that the participants regularly consumed. A washout period of 3 weeks was undertaken between the two intervention phases (Fig. 1). Both interventions were presented in identical packaging and the powders were similar in taste and appearance and were both low in energy content (prebiotic 142 kJ/d (34 kcal/d); placebo 259 kJ/d (62 kcal/d)). Participants were advised not to change their habitual dietary intake or physical activity levels, or take prebiotic- or probiotic-containing foods, drinks and supplements for the duration of the study.
Study design
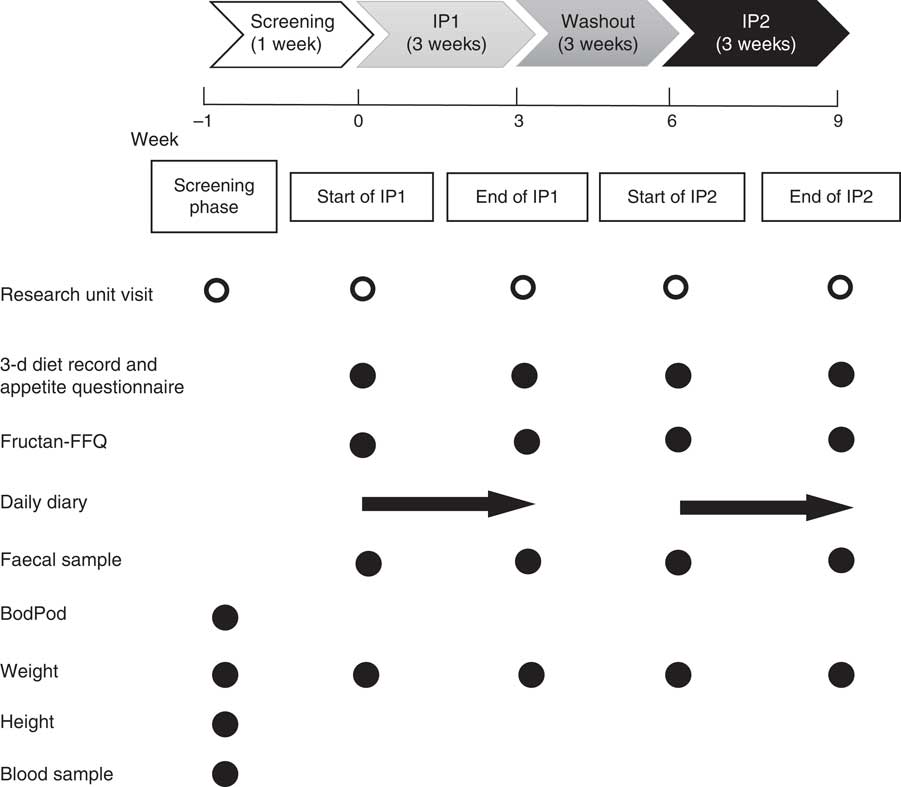
Participants attended an initial screening visit to the research unit where a fasting health screening blood sample was taken. Body composition was assessed using air displacement plethysmography (BodPod® (COSMED); participants were fasted and wore skin-tight clothing) and weight and height measurements were taken (Fig. 2). Eligible participants were then randomised to one of two intervention orders (i.e. prebiotic then placebo or placebo then prebiotic) (Fig. 1). The intervention order was randomised using a computer-based pre-generated intervention order. The researcher involved in participant recruitment and data collection, and the participants were blinded to the intervention order. Participants completed a participant questionnaire at the beginning of the study. They also completed a 3-d diet record and appetite questionnaire, fructan FFQ (Fructan-FFQ), and had a weight measurement taken at the beginning and end of each intervention phase. A daily diary was completed by each participant during both intervention phases to assess compliance to the intervention, stool frequency and gastrointestinal symptoms. A fresh faecal sample was voided at the beginning and end of each intervention phase into a sterile container, immediately sealed in an anaerobic bag containing an anaerobic sachet and stored at −20°C until processing (Fig. 2).
Participant flow through the study including measurements, questionnaires and samples taken at each research unit visit. IP, intervention phase, Fructan-FFQ, fructan FFQ, BodPod, air displacement plethysmography.
Dietary intake analysis
Nutrient intake and food group serves were evaluated using four 3-d diet records. The 3-d diet records were completed on the 3 d leading up to the start of each intervention phase and the last 3 d of each intervention phase. The information collected in the 3-d diet records was entered into FoodWorks version 8.0 (Xyris Software Pty Ltd) by a registered Dietitian. The Australian database in FoodWorks was used (AusBrands and AusFoods 2015 data sources) so nutrient intake and food group analysis could be conducted.
Because of the absence of data regarding inulin-type fructan composition in dietary analysis software, fructan intake from diet was evaluated using a validated Fructan-FFQ( Reference Dunn, Datta and Kallis 23 ). Four Fructan-FFQ were completed during the study, one at the beginning and one at the end of each intervention phase. The Fructan-FFQ comprised twenty-three food and drink items contributing to inulin and oligofructose intake. For each food or drink item, participants indicated the usual portion size (i.e. small, medium or large) and the number of portions consumed in the previous 7 d. Inulin and oligofructose consumed from food commodities (i.e. onion or garlic) were determined using published food composition data( Reference van Loo, Coussement and de Leenheer 24 ), whereas for composite foods (i.e. noodles and biscuits) the inulin and oligofructose intakes were determined first by calculating the food commodity content (i.e. wheat) of the composite food using the Food Commodity Intake Database (US Department of Agriculture and the US Environmental Protection Agency) and then calculating the inulin and oligofructose amounts of each food commodity present in each composite food item, as previously performed( Reference Moshfegh, Friday and Goldman 25 ). Portion sizes were estimated using standard portion size information( Reference Mills, Patel and Crawley 26 ).
Appetite rating analysis
Appetite rating was evaluated using an anchored 100 mm visual analogue scale( Reference Flint, Raben and Blundell 27 ). Hunger, fullness, satisfaction and how much can be consumed were assessed. Participants were instructed to mark with a cross at the point on the scale where they felt the cross best represented their appetite at the time the questionnaire was completed. Appetite ratings were assessed 30 min before and 30 min after main meals (breakfast, lunch and dinner) on the 3 d leading up to the start of each intervention phase and the last 3 d of each intervention phase.
Bacterial DNA extraction
Faecal microbiota were measured using 16S rRNA bacterial gene sequencing and bifidobacteria concentrations were analysed using quantitative PCR. Bacterial DNA was extracted from the faecal samples using the PowerLyzer® Powersoil DNA® isolation kit (MoBio) according to the manufacturer’s instructions with minor alterations. Faecal subsamples were taken from the outer region of the sample only (to reduce variability) and weighed (0·25 (sd 0·025) g) into PowerLyzer® glass bead tubes (MoBio). A FastPrep-24™ 5 G (MP Biomedicals) was used to homogenise the samples at a speed of 5·5 m/s for four 90-s cycles with a 60-s break between each cycle. The DNA was eluted in 10 mm TRIS. NanoDrop 1000 spectrophotometry was used to quantify the DNA concentration.
16S rRNA bacterial gene sequencing
The extracted bacterial DNA was used as a template for initial PCR amplification of the V3–V4 hyper-variable region of the 16S rRNA bacterial gene using the barcoded fusion primers: 16SR_V4 (5'-CAAGCAGAAGACGGCATACGAGAT-barcode-AGTCAGTCAGCCGGAC TACHVGGGTWTCTAAT-3') and 16SF_V3 (5'-AATGATACGGCGACCACCGAGATCT ACAC-barcode-TATGGTAATTGGCCTACGGGAGGCAGCAG-3'), which also contain adaptors for downstream Illumina MiSeq sequencing. Each sample was amplified with a pair of unique (8 base) barcoded primers. The PCR reagents used were Invitrogen AccuPrime™ Pfx SuperMix (part no. 12344-040) (17 µl), 10 μm 16SR_V4 Primer (1 μl), 10 μm 16SF_V3 Primer (1 μl) and Ambion nuclease-free water (catalog no.: AM9932) to normalise to 5 ng/µl (1 µl). The following PCR conditions were used: a hold at 95°C for 2 min followed by 30 cycles of 95°C for 20 s (denaturation), 55°C for 15 s (annealing), 72°C for 5 min (extension) finishing with a hold at 72°C for 10 min. Library clean-up utilised an Invitrogen SequalPrep Normalisation Plate Kit (Thermo Fisher). A quantity 18 µl of the PCR product was used in the library clean-up with an elution volume of 12 µl. A Qubit DNA high-sensitivity assay was used to measure the library concentration and a Bioanalyzer DNA HS assay was used for library sizing. The libraries were pooled by equal volume. Sequencing was undertaken on an Illumina MiSeq machine, using 2×250 bp read length, at the Massey Genome Service (Massey University).
The data obtained from Illumina MiSeq sequencing were analysed using Quantitative Insights Into Microbial Ecology (QIIME)( Reference Caporaso, Kuczynski and Stombaugh 28 ). Paired-end assembler for DNA sequencing was used to assemble the forward and reverse reads into continuous sequences ensuring at least a 50-bp overlap with a minimum of 350 bp and a maximum of 500 bp length( Reference Masella, Bartram and Truszkowski 29 ). Chimera filtered sequences and reads were clustered into operational taxonomic units based on an identity threshold value of 97 % using USEARCH 6.1 and UCLUST( Reference Edgar 30 ). Sequence alignment with the Greengenes core reference database (version 13_5) was carried out using PyNAST( Reference DeSantis, Hugenholtz and Larsen 31 ). The RDP Naïve Bayesian classifier was used to provide taxonomic assignment( Reference Wang, Garrity and Tiedje 32 ). As there was variation in the library size (33 906–196 843 reads) and the potential for differing sequencing depths, which could bias the diversity metric calculations, all samples were rarefied to 33 000 reads. Sequencing data are available from the NCBI Sequence Read Achieve under study SRP120250; BioProject PRJNA414683 (https://www.ncbi.nlm.nih.gov/Traces/study/?acc=SRP120250).
Quantitative PCR
In addition to 16S rRNA bacterial gene sequencing, quantitative PCR analysis of bifidobacteria was undertaken as it provides direct quantification and previous research, using this technique, has demonstrated that bifidobacteria response to certain dietary interventions is influenced by baseline concentrations( Reference Tuohy, Finlay and Wynne 12 – Reference Bouhnik, Raskine and Champion 16 ). Therefore, bifidobacteria concentrations were determined using the LightCycler® 480 system (Roche Life Science). Standard template DNA was prepared using Bifidobacterium bifidium (DSM20082). Bifidobacterium bifidum was grown in MRS (De Man, Rogosa, Sharpe) broth (Oxoid)+0·05 % cysteine at 37°C for 2 d under anaerobic conditions. The culture was counted using a haemocytometer and adjusted to a final concentration of 1×10⁹ cells/ml. Bacterial DNA was extracted using the PowerLyzer® Powersoil DNA® isolation kit (MoBio) as described above. The following primers were used: forward (GGGTGGTAATGCCGGATG) and reverse (CCACCGTTACACCGGGAA) primers( Reference Kok, Waal and Schut 33 ). Quantitative PCR was performed in triplicate with 10 µL of SyBr Green Master (Roche Life Science), 1 µl of each of the forward and reverse primers (5 µm), 7 µl of PCR-grade water and 1 µl of template DNA. The conditions used for PCR amplification were initial denaturation at 95°C for 5 min followed by forty cycles of denaturation (95°C for 1 min), annealing (66°C for 45 s), extension (72°C for 1 min) and finished with a melt curve (95°C for 30 s, 65°C for 1 min and 95°C continuous – 5 per °C acquisitions).
Faecal SCFA analysis
SCFA were measured by GC using a modified known method( Reference Richardson, Calder and Stewart 34 ). While still frozen, 0·5–1·0 g of faecal sample was weighed into a 15-ml Eppendorf tube; 0·01 m PBS containing 2-ethylbutyric acid (5·56 mM) as an internal standard was added to the faecal sample to make an aqueous faecal solution (dilution factor of 10) containing 5 mm 2-ethylbutyric acid. The samples were kept on ice and mixed to disperse faecal matter. Aqueous faecal solutions were centrifuged at 3000 g for 10 min (4°C), 500 µl of the supernatant was transferred to a 2 ml Eppendorf tube and was acidified with 250 µl of concentrated hydrochloric acid and 1000 µl of diethyl ether added. Following a 10-s vortex, to allow acids to transfer to the diethyl ether phase, the samples were centrifuged at 10 000 g for 5 min (4°C). In a capped GC vial, 100 µl of the diethyl ether phase was derivatised with 20 µl of N-tert-butyldimethylsilyl-N-methyltrifluoroacetamide with 1 % tert-butyldimethylchlorosilane (MTBSTFA + TBDMSCI, 99:1; Sigma-Aldrich) in a water bath at 80°C for 20 min. Once cooled, the derivatised sample was transferred to a 200-µl vial insert and recapped. To ensure complete derivatisation, the samples were left for 48 h at room temperature before analysis using GC. Standards containing 2-ethylbutyric acid (5 mm) as an internal standard were prepared for derivatisation alongside the samples.
Analysis was performed on a Shimadzu capillary GC system (GC-2010 Plus) equipped with a flame ionisation detector and fitted with a Restek column (SH-Rtx-1, 30 m×0·25 mm ID×0·25 µm) (Shimadzu). The carrier gas was He with a total flow rate of 21·2 ml/min and pressure of 131·2 kPa. Make-up gas was N. The temperature programme began at 70°C increasing to 115°C at 6°C/min, with a final increase to 300°C at 60°C/min, holding for 3 min. Flow control mode was set to linear velocity: 37·5 cm/s. Injector temperature was 260°C and detector temperature was 310°C. Samples were injected (1 µl) with a split injection (split ratio 10:1). The GC instrument was controlled and data processed using Shimadzu GC Work Station LabSolutions version 5.3. Data acquired provided a final sample result of µmol SCFA/g wet faeces.
Sample size calculations
In order to detect a significant difference in responsiveness of the key phylum and genera (i.e. Actinobacteria, Lactobacillus, Faecalibacterium, Bifidobacterium) to the prebiotic intervention (difference of 3 % in bacterial composition with a variance of 9 % between and within individuals) between the LDF and HDF groups (with a power of 80 % and significance of 5 %) thirty-four participants were required( Reference Holscher, Bauer and Gourineni 35 ). To allow for participant withdrawal, we aimed to recruit approximately forty participants.
Statistical analysis
Mann–Whitney tests were used to determine whether there were significant differences in baseline (start of intervention phase 1) bacterial taxa, SCFA concentrations and dietary intakes (fructan intakes, nutrient intakes and food group serves) between the LDF and HDF groups. One-way repeated-measures ANOVA was used to determine whether nutrient intakes changed throughout the duration of the study in the whole cohort. Differences in participant characteristics between the LDF and HDF groups were assessed using t tests and χ 2 tests. McNemar’s tests were used to determine whether there were any differences in gastrointestinal symptom frequency during the placebo and prebiotic intervention phases in the whole cohort and the LDF and HDF groups. Differences in bacterial taxa and SCFA concentrations between the start of intervention phase 1 (baseline) and start of intervention phase 2 (after the washout period) were determined using the Mann–Whitney test. The Mann–Whitney test was also used to determine whether the bacterial taxa or SCFA concentrations changed during the placebo intervention phase. Two-way repeated-measures ANOVA, blocked by participant, were used to determine whether there were differences in appetite ratings, SCFA concentrations and bacterial taxa during the prebiotic and placebo intervention phases in the whole cohort and the LDF and HDF groups. Two-way repeated-measures ANOVA, blocked by the participant, was also used to determine whether there were differences in prebiotic-driven gut microbiota response between the LDF and HDF groups. Bacterial taxa with skewed data were log-transformed to help normalise the data. Only genus-level bacteria with a mean relative abundance of >1 % were included in the analysis unless a genus (i.e. Faecalibacterium and Lactobacillus) has been shown in the literature to be influenced by inulin-type fructan prebiotics( Reference Dewulf, Cani and Claus 36 ). PERMANOVA analysis (adonis procedure in R package vegan) was undertaken, using the relative abundances for the unweighted UniFrac distance, to determine whether the gut microbiota community changes that occurred differed significantly between the LDF and HDF groups. Spearman’s rank correlation test was used to analyse the correlation between baseline (start of intervention phase 1) bifidobacteria concentrations and change in bifidobacteria concentrations after the prebiotic intervention. Statistical analysis was carried out using Genstat version 17.1.0.14713 or R package vegan version 2.4-4. QIIME( Reference Caporaso, Kuczynski and Stombaugh 28 ) was used to conducted the statistical analysis (non-parametric two-sample t test) to compare baseline (start of intervention phase 1) alpha diversity between the dietary fibre groups and the change in alpha diversity in the LDF and HDF groups after the prebiotic intervention.
Results
Participants
Of the forty-four eligible participants who provided informed consent to participate in the study, four did not complete the study as they either experienced severe gastrointestinal symptoms (i.e. disabling abdominal pain, cramps and bloating) owing to the prebiotic (n 2) or were prescribed antibiotics at the beginning of the study (n 1). One participant was also prescribed antibiotics at the end of the study (during the placebo intervention phase); however, the data collected during the prebiotic intervention phase were still able to be used. Forty participants completed the study; however, the data from seven participants were excluded as the participants were either assessed as being moderate dietary fibre consumers, based on the data collected from the four 3-d diet records (n 6), or were found to have consumed prebiotic- or probiotic-containing foods and drinks during the study (n 1). The data collected from thirty-four participants were used for the prebiotic intervention analysis and the data collected from thirty-three participants were used for the placebo intervention analysis (Fig. 1).
Baseline dietary intake and participant characteristic differences
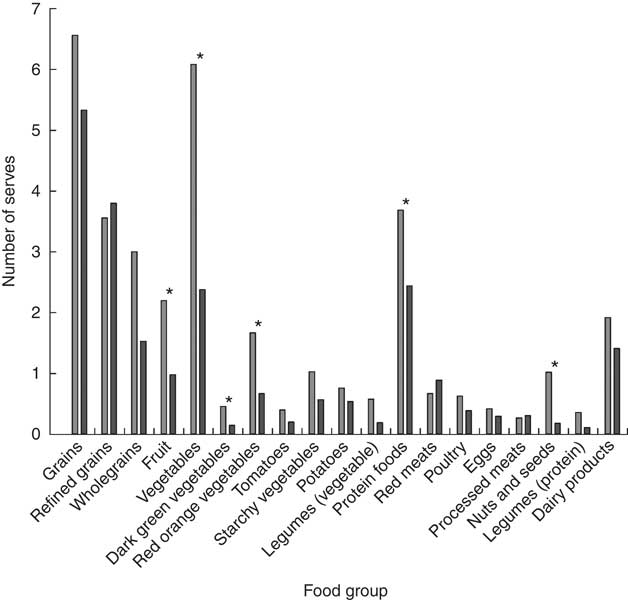
Categorisation into different dietary fibre intake groups was successful as dietary fibre intakes were significantly different (P<0·001) between the LDF (n 14; 18·0 g/d) and HDF (n 20; 38·6 g/d) groups. There were several additional significant differences (P<0·05) in baseline nutrient intakes between the LDF and HDF groups. HDF consumers had higher energy, total fat, PUFA, MUFA, carbohydrate and dietary fibre per 1000 kJ compared with the LDF group. There were, however, no differences in fructan intake between the two groups (Table 1). Energy from fat (%) and energy from protein (%) were not significantly different; however, energy from fibre (%) was significantly different between dietary fibre groups (P<0·001). Therefore, the only macronutrient that continued to be significantly different between dietary fibre groups after energy intakes were controlled for was dietary fibre (Table 1). The LDF group had a lower intake of fruits (P=0·009), vegetables (P<0·001) (dark green (P=0·007) and red orange vegetables (P=0·039)), protein foods (P=0·036) and nuts and seeds (P=0·001) compared with the HDF group (Fig. 3). Dietary intakes did not change throughout the duration of the study (online Supplementary Table S1). Despite similar age, sex and BMI, there were significant differences in body composition between the two dietary fibre groups. The LDF group had a significantly lower fat-free mass (P=0·021) and significantly higher fat mass (P=0·021) compared with the HDF group (Table 2).
Baseline differences in the average number of food group serves consumed per d (as assessed using four 3-d diet records) between the low (![]() ) and high dietary fibre (
) and high dietary fibre (![]() ) groups. * Changes that are significantly different (P<0·05) between dietary fibre groups as analysed by a Mann–Whitney test.
) groups. * Changes that are significantly different (P<0·05) between dietary fibre groups as analysed by a Mann–Whitney test.
Baseline dietary intake differences between the low and high dietary fibre groupsFootnote * (Mean values and standard deviations)

* Mann–Whitney test.
† Significant results (P<0·05).
Participant characteristic comparison between the low and high dietary fibre groupsFootnote * (Mean values and standard deviations)
* χ 2 Test and unpaired t test.
† Significant results (P<0·05).
‡ Activity level of 5 is seated work with some moving around and strenuous leisure activity.
Baseline SCFA concentration and microbiota differences
Of the 138 faecal samples analysed, a total of 12 420 607 high-quality 16S rRNA bacterial gene sequence reads were generated. The average number of sequence reads generated per faecal sample was 90 004 (33 906–196 843 reads/sample).
There were no significant baseline differences in SCFA concentrations (Table 3) or any of the alpha diversity indices measured (Observed species, Shannon, Chao and PD_whole tree) (online Supplementary Table S2) between the LDF and HDF groups. At baseline, the relative abundance of an unknown genus of Lachnospiraceae (other) was significantly higher in the LDF group compared with the HDF group (P=0·043). The LDF group also had a trend towards a higher relative abundance of Bifidobacterium compared with the HDF group; however, statistical significance was not reached (P=0·066) (Table 3).
Baseline SCFA concentrations and bacterial taxa in the low and high dietary fibre groupsFootnote † (Mean values and standard deviations)
Mean values are significantly different from the low dietary fibre group: * P<0·05.
† Mann–Whitney test.
‡ Trend towards significance (P<0·1).
Gastrointestinal symptoms
In the whole cohort, the frequency of mild and severe gastrointestinal symptoms were statistically similar (P>0·05) during the placebo and prebiotic intervention phases. There was, however, a significantly higher frequency of moderate symptoms (P=0·013), particularly moderate flatulence (P=0·012), experienced during the prebiotic compared with the placebo intervention phase (online Supplementary Table S3).
After categorisation into dietary fibre intake groups, the HDF group also experienced an increased frequency of moderate symptoms (P=0·004), particularly moderate flatulence (P=0·016), during the prebiotic compared with the placebo intervention phase. There were no significant differences in gastrointestinal symptom frequency between the placebo and prebiotic intervention phases in the LDF group (online Supplementary Table S3).
Prebiotic-driven changes in appetite ratings
In the whole cohort, there were no significant differences in appetite ratings before or after breakfast, lunch or dinner during the prebiotic intervention phase (online Supplementary Table S4).
After categorising participants on the basis of their dietary fibre intakes, appetite ratings did not significantly change before or after breakfast, lunch or dinner during the prebiotic intervention phase in the LDF group (online Supplementary Table S5). There were, however, a number of significant changes in appetite ratings during the prebiotic intervention phase in the HDF group. The prebiotic intervention led to a significant reduction in satisfaction before lunch (P=0·042) and in hunger after dinner (P=0·006), and a significant increase in fullness (P=0·002) and satisfaction after lunch (P=0·044) (online Supplementary Table S6).
Prebiotic-driven changes in SCFA concentrations and microbiota
Gut microbiota composition and SCFA concentrations after the washout period were not significantly different from baseline (data not presented). There were also no significant changes in gut microbiota composition or SCFA concentrations during the placebo intervention phase (data not presented).
In the whole cohort, there were no significant changes in SCFA concentrations owing to the prebiotic intervention (Table 4). There were, however, a number of prebiotic-driven changes in bacterial taxa. At a phylum level, Actinobacteria relative abundance significantly increased (P<0·001) and Firmicutes relative abundance significantly decreased (P=0·007). There was also a trend towards a reduction in Proteobacteria relative abundance (P=0·070) during the prebiotic intervention phase (Table 4). At a genus level, there was a prebiotic-driven increase in the relative abundance of Bifidobacterium (P<0·001) and a reduction in Coprococcus (P=0·016), Dorea (P=0·029), Ruminococcus (Lachnospiraceae family) (P=0·007) and Oscillospira relative abundance (P=0·031). There was also a trend towards an increase in Faecalibacterium relative abundance (P=0·088) during the prebiotic intervention phase (Table 4).
SCFA concentration and bacterial taxa changes during the placebo and prebiotic intervention phases in the whole cohortFootnote † (Mean values and standard deviations)
Mean values are significantly different from those of the placebo intervention and prebiotic before intervention or in the case of Dialister different from those of the prebiotic intervention and placebo before intervention: * P<0·05, ** P<0·01.
† Two-way repeated-measures ANOVA (blocked by participant) and least significant difference test.
‡ Trend towards significance (P<0·1).
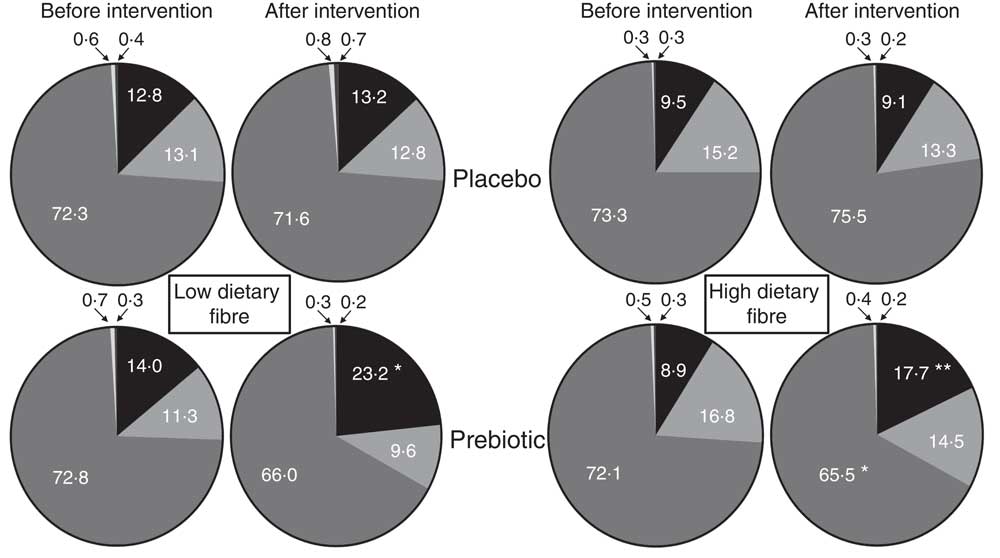
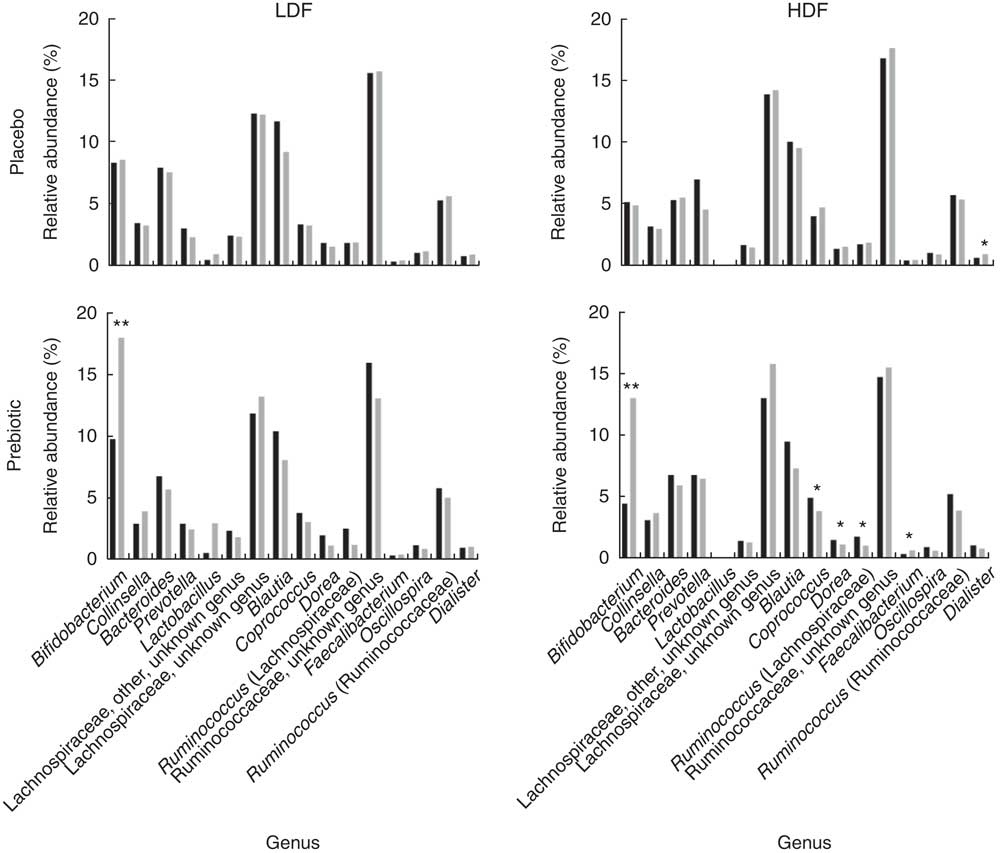
After categorisation into dietary fibre intake groups, there were no significant prebiotic-driven changes in SCFA concentrations in the LDF (online Supplementary Table S7) or HDF groups (online Supplementary Table S8), which was consistent with the whole cohort analysis (Table 1). At a phylum level, both dietary fibre groups had a significant increase in Actinobacteria relative abundance (LDF P=0·007 and HDF P=<0·001); however, the reduction in Firmicutes relative abundance was only significant in the HDF group (LDF P=0·127 and HDF P=0·027) (Fig. 4+online Supplementary Tables S7 and S8). At a genus level, the only significant change that occurred during the prebiotic intervention in the LDF group was an increase in the relative abundance of Bifidobacterium (P=0·001) (Fig. 5+online Supplementary Table S7). The prebiotic intervention did, however, lead to a number of significant changes in the HDF group including a significant increase in Bifidobacterium (P<0·001) and Faecalibacterium relative abundance (P=0·010), and a significant reduction in Coprococcus (P=0·010), Dorea (P=0·043) and Ruminococcus (Lachnospiraceae family) relative abundance (P=0·032) (Fig. 5+online Supplementary Table S8). There was a trend towards a reduction in Shannon index (P=0·060) in the HDF group and an increase in Chao index (P=0·060) in the LDF group during the prebiotic intervention (online Supplementary Table S2).
Mean phylum level relative abundance (%) before and after the placebo and prebiotic intervention phases for the low dietary fibre and high habitual dietary fibre groups. ![]() , Actinobacteria;
, Actinobacteria; ![]() , Bacteroidetes;
, Bacteroidetes; ![]() , Firmicutes;
, Firmicutes; ![]() , Proteobacteria;
, Proteobacteria; ![]() , Verrucomicrobia. Significantly different from the placebo intervention and prebiotic before intervention: * P<0·05, ** P<0·01.
, Verrucomicrobia. Significantly different from the placebo intervention and prebiotic before intervention: * P<0·05, ** P<0·01.
Mean genus level relative abundance (%) before (![]() ) and after (
) and after (![]() ) the placebo and prebiotic intervention phases for the low dietary fibre (LDF) and high habitual dietary fibre (HDF) groups. After intervention, values are significantly different from the placebo intervention and prebiotic before intervention (or in the case of Dialister significantly different from those of the prebiotic intervention and placebo before intervention): * P<0·05, ** P<0·01.
) the placebo and prebiotic intervention phases for the low dietary fibre (LDF) and high habitual dietary fibre (HDF) groups. After intervention, values are significantly different from the placebo intervention and prebiotic before intervention (or in the case of Dialister significantly different from those of the prebiotic intervention and placebo before intervention): * P<0·05, ** P<0·01.
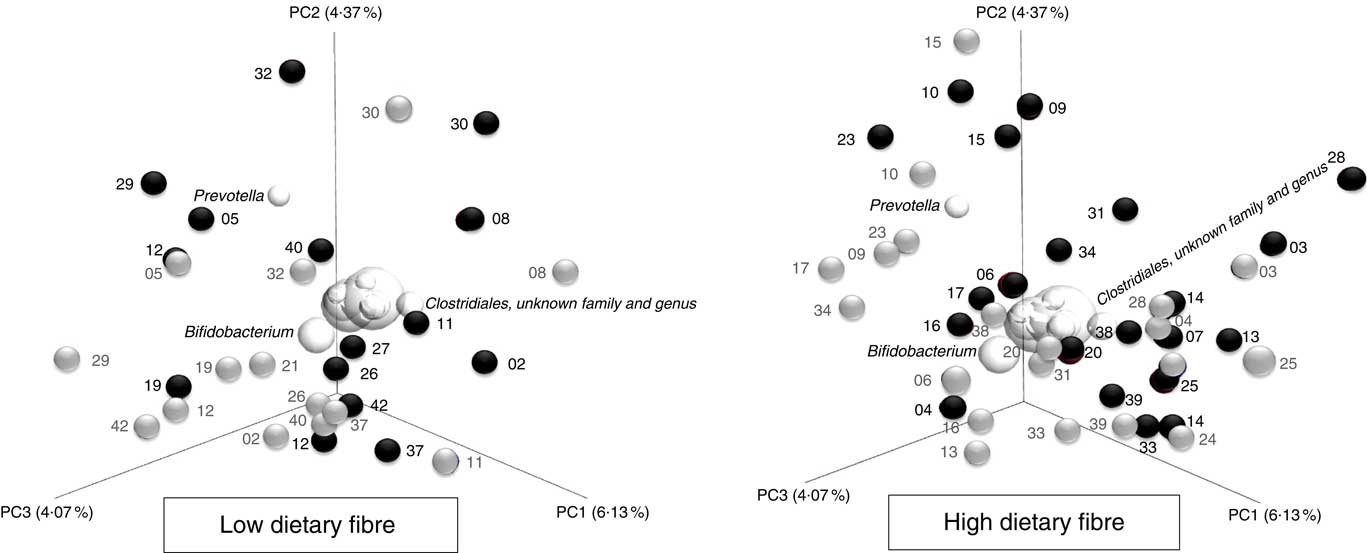
The unweighted UniFrac distance principal coordinate analysis biplots (β diversity) demonstrate that there were large inter-individual variability in whole community microbiota responses to the inulin-type fructan prebiotic (Fig. 6). For example, participant 32 (LDF) and 28 (HDF) harboured gut microbiota communities that were more responsive to the inulin-type fructan prebiotic as their before (![]() ) and after (
) and after (![]() ) prebiotic intervention samples are a distance away from each other. However, participant 19 (LDF) and 03 (HDF) before (
) prebiotic intervention samples are a distance away from each other. However, participant 19 (LDF) and 03 (HDF) before (![]() ) and after (
) and after (![]() ) prebiotic intervention samples cluster together, suggesting that their gut microbiota communities were less responsive to the inulin-type fructan prebiotic. There was, however, no significant difference in how the gut microbiota communities responded to the inulin-type fructan between the LDF and HDF groups (P=0·997) based on this analysis.
) prebiotic intervention samples cluster together, suggesting that their gut microbiota communities were less responsive to the inulin-type fructan prebiotic. There was, however, no significant difference in how the gut microbiota communities responded to the inulin-type fructan between the LDF and HDF groups (P=0·997) based on this analysis.
Principal coordinate analysis biplots (unweighted UniFrac distances) illustrating the between-sample differences in bacterial taxa (β-diversity) before (![]() ) and after the prebiotic intervention (
) and after the prebiotic intervention (![]() ) for the low and high habitual dietary fibre groups. Participant ID are shown on the biplot (i.e. 03). The further apart a participant’s samples are from each other, the greater the whole community microbiota response was to the inulin-type fructan prebiotic.
) for the low and high habitual dietary fibre groups. Participant ID are shown on the biplot (i.e. 03). The further apart a participant’s samples are from each other, the greater the whole community microbiota response was to the inulin-type fructan prebiotic. ![]() , the 10 most abundant bacterial taxa. The spheres that cluster in the middle of the graphs, which are not labelled, include the following bacterial taxa: Coprococcus; Bacteroides; Ruminococcus; Collinsella; Lachnospiraceae, unknown genus; Blautia and Ruminococcaceae, unknown genus. The position and size of the sphere indicate the bacterial taxa that are the most influential in driving the separation of the samples.
, the 10 most abundant bacterial taxa. The spheres that cluster in the middle of the graphs, which are not labelled, include the following bacterial taxa: Coprococcus; Bacteroides; Ruminococcus; Collinsella; Lachnospiraceae, unknown genus; Blautia and Ruminococcaceae, unknown genus. The position and size of the sphere indicate the bacterial taxa that are the most influential in driving the separation of the samples.
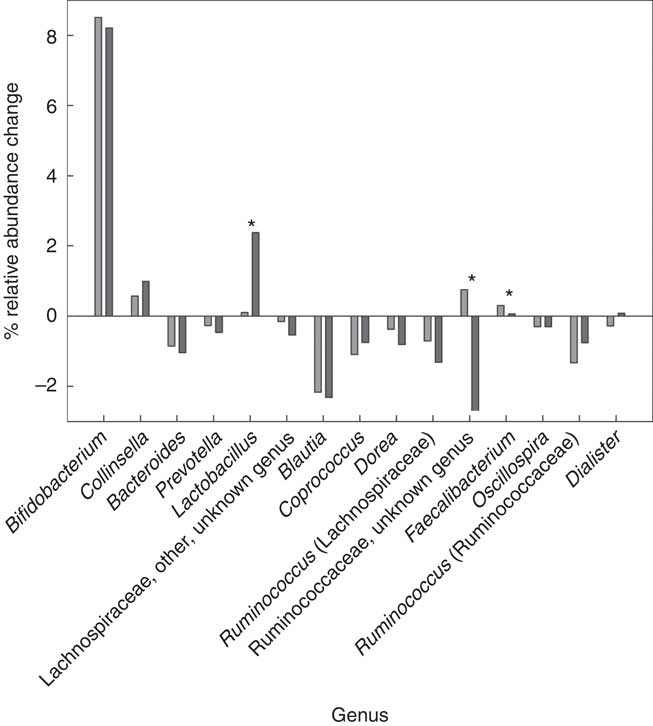
The between-dietary fibre group comparison demonstrated that there were no differences in phylum-level gut microbiota response to the prebiotic between the LDF and HDF groups (Table 5). There were also no differences in prebiotic-driven SCFA production between the LDF and HDF groups (Table 5). The gut microbiota did, however, respond differently between the LDF and HDF groups at a genus level for Lactobacillus, an unknown genus of Ruminococcaceae and Faecalibacterium (Fig. 7). There was minimal change in Lactobacillus relative abundance due to the prebiotic in the HDF group; however, Lactobacillus increased from 0·6 to 3·0 % in the LDF group (P=0·025). The relative abundance of an unknown genus of Ruminococcaceae increased in the HDF group but decreased in the LDF group (P=0·018). The relative abundance of Faecalibacterium increased more markedly in the HDF group than in the LDF group (P=0·009) (Table 5).
Mean genus level changes after the prebiotic intervention between the low (![]() ) and high dietary fibre (
) and high dietary fibre (![]() ) groups. * Significant change (P<0·05) as analysed by a two-way repeated-measures ANOVA (blocked by participant) and least significant difference test.
) groups. * Significant change (P<0·05) as analysed by a two-way repeated-measures ANOVA (blocked by participant) and least significant difference test.
SCFA concentrations and bacterial taxa before and after the prebiotic intervention in low and high dietary fibre groupsFootnote * (Mean values and standard deviations)
* Two-way repeated-measures ANOVA (blocked by participant) and least significant difference test.
† Changes in bacterial relative abundance that were significantly different between the low and high dietary fibre groups (P<0·05).
Correlation between baseline bifidobacteria concentrations and change in bifidobacteria
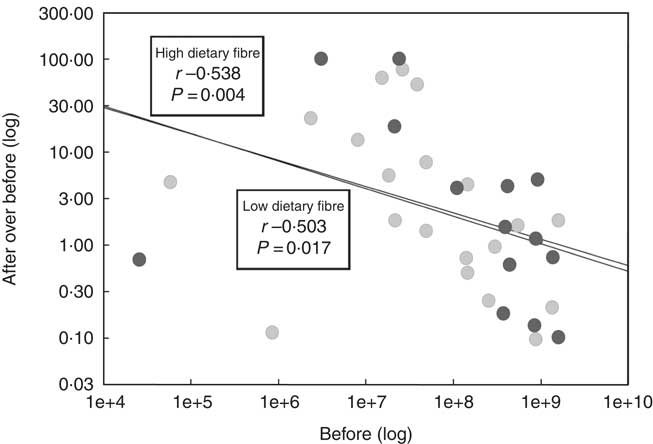
The quantitative PCR data were used to determine whether there was a correlation between baseline bifidobacteria concentrations and change in bifidobacteria concentrations due to the prebiotic intervention. A significant correlation was demonstrated for both the LDF (P=0·017) and HDF (P=0·004) groups. The strength of the correlation was similar between the dietary fibre groups (Fig. 8).
The correlation between baseline bifidobacteria concentrations (before (log)) and change in bifidobacteria concentrations (after over before (log)) during the prebiotic intervention between the low (![]() ) and high dietary fibre (
) and high dietary fibre (![]() ) groups. Bifidobacteria concentrations were determined using quantitative PCR.
) groups. Bifidobacteria concentrations were determined using quantitative PCR. ![]() , Regression. P values<0·05 are considered significant as analysed by a Pearson’s rank correlation test.
, Regression. P values<0·05 are considered significant as analysed by a Pearson’s rank correlation test.
Discussion
In the present study, the inulin-type fructan prebiotic led to several microbial changes in the whole cohort including an increase in Bifidobacterium and a decrease in Coprococcus, Dorea, Ruminococcus (Lachnospiraceae family) and Oscillospira relative abundances. There was also a trend towards an increase in Faecalibacterium relative abundance. Previous inulin-type fructan prebiotic intervention studies have demonstrated similar results with increases in Bifidobacterium and/or Faecalibacterium being reported in a number of studies( Reference de Preter, Vanhoutte and Huys 14 , Reference Dewulf, Cani and Claus 36 – Reference Ramnani, Gaudier and Bingham 39 ). SCFA concentrations did not differ after the prebiotic intervention. In vitro studies have shown that inulin-type fructan prebiotics lead to an enhanced production of butyrate( Reference Scott, Martin and Duncan 40 , Reference Jung, Jeon and Han 41 ); however, this result is often not replicated in human prebiotic intervention studies( Reference Holscher, Bauer and Gourineni 35 , Reference Costabile, Kolida and Klinder 38 , Reference Ramnani, Gaudier and Bingham 39 ). This is not overly surprising as over 95 % of the SCFA produced in the human colon are used by the microbiota that reside within the gut, are rapidly utilised by colonocytes and are absorbed into the hosts’ systemic circulation( Reference Scheppach 42 , Reference Belenguer, Duncan and Calder 43 ). In addition, there were no significant changes in appetite ratings during the prebiotic intervention phase in the whole cohort.
Interestingly, categorisation into LDF and HDF groups led to a number of distinctions in gut microbiota response within each dietary fibre group. In the LDF group, the only significant genus level microbiota change elicited by the inulin-type fructan prebiotic was an increase in Bifidobacterium relative abundance. In the HDF group, the inulin-type fructan prebiotic led to a significant increase in the relative abundance of Bifidobacterium and Faecalibacterium and a significant reduction in Coprococcus, Dorea and Ruminococcus (Lachnospiraceae family). The LDF group appeared to harbour a gut microbiota community that was more resilient to change and, therefore, less responsive to the inulin-type fructan prebiotic than the HDF group. A study conducted by Eid et al.( Reference Eid, Osmanova and Natchez 17 ) demonstrated that individuals with an average dietary fibre intake of 18 g/d hosted gut microbiota that were more stable to a palm date intervention. In their study, individuals with an average dietary fibre intake of 18 g/d were classified as HDF, whereas in the present study LDF consumers had an average dietary fibre intake of 18 g/d. A recent study, which used germ-free (gnotobiotic) mice colonised with human gut microbiota from donors with two varying dietary patterns (typical American style dietary pattern (AMER) or a plant-rich, energy-restricted diet with optimal nutrient composition (CRON)), demonstrated that mice inoculated with AMER microbiota were less responsive to the CRON type diet when compared with mice inoculated with CRON microbiota( Reference Griffin, Ahern and Cheng 18 ). A recent in vitro batch fermentation study demonstrated that donors with healthier dietary patterns harboured gut microbiota that were better equipped at utilising fermentable carbohydrates found in grains compared with donors with less healthy dietary patterns( Reference Brahma, Martínez and Walter 44 ). Therefore, the HDF group in the present study may have gut microbiota consortia that are metabolically more capable of utilising high amounts of fermentable substrates as their habitual diet is already high in these substrates.
The between-dietary fibre group comparison demonstrated that there were several bacterial genera that responded in a distinctive manner between the LDF and HDF groups. The inulin-type fructan prebiotic led to an increase in the relative abundance of Faecalibacterium and an unknown genus of Ruminococcaceae, and minimal change in Lactobacillus relative abundance in the HDF group. In the LDF group, the inulin-type fructan prebiotic led to an increase in the relative abundance of Lactobacillus, minimal change in Faecalibacterium relative abundance and a reduction in the relative abundance of an unknown genus of Ruminococcaceae. It is likely that the whole cohort bacterial taxa results may have changed if the number of LDF and HDF participants recruited were different. In the present study, the data from more HDF than LDF consumers (twenty and fourteen participants, respectively) were used in the analysis. If the proportion of recruited HDF to LDF participants differed from the present study, then this could have had implications on the whole cohort results. For example, if more LDF than HDF consumers were recruited, the prebiotic may have led to a significant increase in the relative abundance of Lactobacillus.
Host-specific responses, such as appetite rating changes and gastrointestinal symptoms, were significantly influenced by the inulin-type fructan prebiotic in the HDF group only. The HDF group reported a significantly higher frequency of moderate flatulence, an increase in fullness and satisfaction after lunch and a reduction in hunger after dinner owing to the inulin-type fructan prebiotic. One of the key differences in gut microbiota response to the prebiotic intervention between dietary fibre groups was the significant increase in Faecalibacterium relative abundance observed only in the HDF group. Butyrate and CO2 are primary metabolic by-products of indigestible substrate fermentation by Faecalibacterium in the colon( Reference Henson and Phalak 45 ). A primary component of flatus is CO2 gas( Reference Levitt 46 ) and butyrate has been shown to be involved in regulating appetite-associated gut hormones( Reference Lin, Frassetto and Kowalik 47 ). Therefore, it is plausible that the significant change in appetite ratings and the increased frequency of moderate flatulence experienced by the HDF group after the prebiotic intervention may be associated with the increased abundance of Faecalibacterium. Nevertheless, further investigation is required to demonstrate whether a link between Faecalibacterium and host response in healthy individuals exists.
Consideration towards inter-individual variability in gut microbiota responsiveness will be particularly important when researching the prebiotic potential of a given dietary intervention for the first time. If a greater proportion of participants with less responsive gut microbiota communities are recruited, then it may appear that the dietary intervention does not have an influence on the gut microbiota, which may not be representative of the true prebiotic efficacy of the dietary intervention for all participants. Gaining additional insight into the factors that influence gut microbiota responsiveness, so they can be controlled for more effectively, will help determine the true prebiotic efficacy of a dietary intervention and provide better consistency of results between studies.
Quantitative PCR data were used to investigate whether a correlation between baseline bifidobacteria concentrations and prebiotic-driven change in bifidobacteria concentrations exists in our study cohort. We also aimed to determine whether the strength of the correlation differed between the LDF and HDF groups. A significant correlation did exist between baseline bifidobacteria concentration and prebiotic-driven change in bifidobacteria concentration, with lower baseline bifidobacteria concentrations being correlated with a more pronounced bifidogenic response. The strength of the correlation did not differ between the LDF and HDF groups, suggesting that habitual dietary fibre intakes do not have an influence on the correlation. The majority of previous studies are in agreement with our results as they have also observed that lower baseline bifidobacteria concentrations lead to a more pronounced increase in bifidobacteria in response to a dietary intervention( Reference Tuohy, Finlay and Wynne 12 – Reference Bouhnik, Raskine and Champion 16 ).
There are a number of strengths of this study including the robust study design: a randomised, double-blind, placebo-controlled, cross-over human intervention study. This is also the first study to recruit participants based on pre-defined habitual dietary fibre intake categories to demonstrate what influence habitual dietary fibre intake has on gut microbiota responsiveness. Another strength of this study is the utilisation of next-generation sequencing technology, which allowed for the characterisation of the whole microbial community rather than focusing on changes that occur in only select bacterial taxa. A limitation of the present study is that the interpretation of our results is limited to inulin-type fructan prebiotic interventions – in particular, a mixed inulin:fructo-oligosaccharide prebiotic. Numerous other fermentable carbohydrates have a proven prebiotic effect, including galacto-oligosaccharides (GOS); however, the impact of habitual dietary fibre intake on the responsiveness of the gut microbiota to other prebiotics has not been published previously, nor was it investigated here. The microbially derived enzymes, fructanase (responsible for fructan fermentation) and β-Galactosidase (responsible for GOS fermentation)( Reference Sonnenburg, Zheng and Joglekar 48 ), are encoded on various bacteria and therefore the diet-dependent effects on prebiotic specificity may be different for different prebiotics( Reference Wilson and Whelan 49 ). The influence habitual dietary fibre intake has on the responsiveness of the gut microbiota to other dietary interventions, such as GOS, energy restriction, increased resistant starch and high-wholegrain diets, will need to be researched in the future.
In conclusion, it is difficult to predict how the gut microbiota will respond to a dietary intervention. Gaining a better understanding of the factors implicated in inter-individual variability in gut microbiota responsiveness may help improve dietary intervention success and subsequently enhance human health outcomes. In this study, we identified that individuals with HDF intakes have a greater gut microbiota response to an inulin-type fructan prebiotic. These individuals also experienced greater benefits in appetite but reported more gastrointestinal symptoms. Future studies aiming to modulate the gut microbiota using an inulin-type fructan prebiotic should take habitual dietary fibre intake into account either when recruiting participants or during data analysis to help minimise the influence inter-individual variability in gut microbiota responsiveness has on study outcomes.
Acknowledgements
The authors would like to take the opportunity to thank the participants who were involved in this study, Ying Jin for collecting blood sample for the study, Anne Broomfield for assisting with the intervention randomisation and taking BodPod measurements, Halina Stoklosinski for conducting the SCFA analysis, Paul Blatchford for reviewing the manuscript and providing assistance with bioinformatics when required and Duncan Hedderley for providing bio-statistical support for this study.
This work is supported by the Foods for Health programme (C11×1312). The funds for the Foods for Health programme were provided to several collaborating New Zealand organisations, including The New Zealand Institute for Plant & Food Research Limited, by the Ministry of Business, Innovation and Employment, New Zealand Government.
The authors contributions were as follows: G. H. was involved in the conception, study design, participant recruitment, running of the study, sample processing, data collection, analysis and interpretation, as well as the writing of the manuscript. L. B., C. B., R. M. and J. C. were involved in the conception, study design and data interpretation. K. W. was involved in the study design and provided expertise relating to the Fructan-FFQ. All authors contributed to the development and approval of the manuscript.
The authors declare that there are no conflicts of interest.
Supplementary Material
For supplementary material/s referred to in this article, please visit https://doi.org/10.1017/S0007114517003440


