


1. Introduction
Evaporation of droplets is ubiquitous in the world around us. However, despite the apparent simplicity of the geometry, the dynamics involved is typically very complex. Gaining a theoretical understanding of the process is thus of particular importance due to the key role droplet evaporation plays in everything from inkjet printing, to the spreading of pesticides on leaves, to diagnostic applications of blood drying (Brutin & Starov Reference Brutin and Starov2018; Mampallil & Eral Reference Mampallil and Eral2018). As a result, determining the evaporative flux of liquid from the free surface into the surrounding gas has become a key goal of modellers, as this will drive the internal fluid motion, and consequential dynamics of the droplet.
However, even within well-established regimes such as diffusion-limited evaporation, finding analytical expressions for the evaporative flux is difficult, while numerical simulations can be expensive and challenging. In diffusion-limited evaporation, vapour diffuses away from the free surface of the droplet sufficiently quickly that the process may be taken to a reasonable approximation to be steady, so that the concentration of vapour satisfies a mixed boundary value problem for Laplace's equation. Mathematically, this is a notoriously challenging problem, with singularities induced at the contact line of the droplet. Perhaps unsurprisingly, the solution – and hence, the flux – depends strongly on the geometry of the droplet. Exact solutions are scarce: some examples of known solutions for the evaporative flux of droplets in isolation include the flat disk (Weber Reference Weber1873; Copson Reference Copson1947), flat ellipse (Boersma & Danicki Reference Boersma and Danicki1993), spherical cap (Popov Reference Popov2005) and ellipsoidal cap (Kellogg Reference Kellogg1929) but few others.
For more complicated geometries where techniques such as separation of variables and transform methods fail, we can make progress when the droplet profile is such that it may reasonably be treated as thin. For many situations, once a droplet has been deposited onto the substrate, its contact line becomes pinned on surface roughnesses so that the thin assumption is equivalent to assuming that a typical contact radius, say  $R$, is much larger than the initial thickness of the droplet, say $H$, so that $H/R\ll 1$. Pinning persists for the majority of the evaporation (Hu & Larson Reference Hu and Larson2002) and, indeed, may be further enhanced in solute-laden droplets when solute particles accumulate at the edge of the droplet (see, for example, Orejon, Sefiane & Shanahan Reference Orejon, Sefiane and Shanahan2011; Weon & Je Reference Weon and Je2013), so that the thin assumption continues to hold.
When a droplet is thin, the Laplace problem may be linearised into a half-space problem, so that the most sensible starting point for finding the evaporative flux is to use a Green's function formulation to relate the evaporative flux on the droplet to the known vapour saturation concentration through an integral equation. Various different approaches for expanding the Green's function kernel may then be used to invert the integral. For simpler geometries, the solution may be found exactly, such as a disk (Sneddon Reference Sneddon1966) or – for suitable saturation concentrations – for an ellipse (Kellogg Reference Kellogg1929; Galin, Moss & Sneddon Reference Galin, Moss and Sneddon1961). However, for more complicated geometries, we must again turn to numerical and approximate solutions (see, for example, Borodachev & Galin Reference Borodachev and Galin1974; Okon & Harrington Reference Okon and Harrington1979).
This is particularly problematic due to the numerous uses of these evaporative models, such as in the explanation of the famous ‘coffee ring’ effect (Deegan et al. Reference Deegan, Bakajin, Dupont, Huber, Nagel and Witten1997, Reference Deegan, Bakajin, Dupont, Huber, Nagel and Witten2000; Han & Lin Reference Han and Lin2012; Thiele Reference Thiele2014): in many practical situations, the liquid contains a non-volatile component and the pertinent quantity of interest is the final distribution of this component once the liquid has fully evaporated. Common examples of applications include colloidal patterning and the fabrication of microscale electronics (see, for example, Harris et al. Reference Harris, Hu, Conrad and Lewis2007; Choi et al. Reference Choi, Stassi, Pisano and Zohdi2010); fabrication techniques using inkjet printing (Layani et al. Reference Layani, Gruchko, Milo, Balberg, Azulay and Magdassi2009) including printing organic light-emitting diode (OLED) screens (Eales et al. Reference Eales, Routh, Dartnell and Simon2015); optical mapping of DNA (Jing et al. Reference Jing1998); pesticide application (Basi, Hunsche & Noga Reference Basi, Hunsche and Noga2013) and blood analysis (see Smith & Brutin (Reference Smith and Brutin2018) and the references therein). These models typically couple the flow of liquid, and hence the solute, inside the droplet to the evaporative flux (Deegan et al. Reference Deegan, Bakajin, Dupont, Huber, Nagel and Witten1997; Dey, Doumenc & Guerrier Reference Dey, Doumenc and Guerrier2016; Moore, Vella & Oliver Reference Moore, Vella and Oliver2021; Wray et al. Reference Wray, Wray, Duffy and Wilson2021), which is determined by the dominant evaporative process (Murisic & Kondic Reference Murisic and Kondic2011), which in turn depends on material and thermodynamic properties of the liquid, the surface the droplet lies on, and the surrounding atmosphere. While we focus on diffusion-limited evaporation here, other models may be suitable for different rate-limiting processes (Murisic & Kondic Reference Murisic and Kondic2011; Wilson & D'Ambrosio Reference Wilson and D'Ambrosio2022). This has resulted in a rapidly moving field examining numerous extensions to this problem, including residues from droplets on inclines (Du & Deegan Reference Du and Deegan2015), multiple droplets in proximity (Wray, Duffy & Wilson Reference Wray, Duffy and Wilson2020; Wray et al. Reference Wray, Wray, Duffy and Wilson2021), diffusive effects (Moore et al. Reference Moore, Vella and Oliver2021; Moore, Vella & Oliver Reference Moore, Vella and Oliver2022), jamming effects (Popov Reference Popov2005) and numerous attempts at control (Mampallil & Eral Reference Mampallil and Eral2018). However, a critical avenue is the behaviour of non-circular droplets, with the only existing studies being numerical (Freed-Brown Reference Freed-Brown2015; Sáenz et al. Reference Sáenz, Wray, Che, Matar, Valluri, Kim and Sefiane2017) or considering the early stages of deposit formation (Moore et al. Reference Moore, Vella and Oliver2022). This is particularly surprising given the ubiquity of square/rectangular (Mai & Richerzhagen Reference Mai and Richerzhagen2007) and hexagonal (Huo et al. Reference Huo, Shao, Dong, Liang, Bi, He, Li, Gao and Song2020) droplets in contexts such as the printing of active matrix organic light-emitting diode (AMOLED) screens.
Here, we build upon the approach of Fabrikant (Reference Fabrikant1986), which presents an approximate solution for an arbitrary droplet geometry. In Fabrikant (Reference Fabrikant1986), the form of the evaporative flux is prescribed and related to an expansion of the surface concentration. However, for many problems in evaporation, we actually require the opposite – the surface concentration is the input and we seek a pointwise representation of the evaporative flux, which can then be used in analysis of the internal flow dynamics and (when applicable) the solute transport.
In this paper, we address this deficiency. We begin by formulating a problem for nearly circular droplets in § 2, before presenting and analysing the Green's function formulation in § 3. We find an asymptotic solution for the evaporative flux valid up to second order in terms of the perturbation parameter, which we show to be in excellent agreement to full numerical simulations of the diffusion problem. In § 4, we utilise our results for the specific application of determining the flow dynamics and final residue for large, nearly circular solute-laden droplets, finding predictions of the effect of geometry on the ‘coffee ring’ effect that are in agreement with previous studies (such as Freed-Brown Reference Freed-Brown2015; Sáenz et al. Reference Sáenz, Wray, Che, Matar, Valluri, Kim and Sefiane2017; Moore et al. Reference Moore, Vella and Oliver2022). Finally, given potential applications in, for example, printing OLEDs, we extend our analysis to consider regular polygonal droplets in § 5.1, and more complex shapes in § 5.2, presenting results for the evaporative flux for general droplets, as well as the internal flow and transport dynamics for large droplets. The results are again shown to be in excellent agreement with numerical simulations.
We finish by noting that the results given herein are, to our knowledge, fundamentally new results in potential theory. As a result, while we present them in the context of evaporating droplets, we anticipate that they will be of interest to researchers in areas such as nanobubbles and nanodroplets (Lohse et al. Reference Lohse2015), electrical contact resistance (Holm Reference Holm2013), thermostatics (Lee & Chien Reference Lee and Chien1994), flow through a porous membrane (Fabrikant Reference Fabrikant1985) and electrodynamics (Jackson Reference Jackson1999), among many others. These include famous open problems, such as the capacitance of a square electrode at uniform voltage (Douglas, Zhou & Hubbard Reference Douglas, Zhou and Hubbard1994; Wintle Reference Wintle2004), the magnetic polarisability of rhomboid apertures (De Meulenaere & Van Bladel Reference De Meulenaere and Van Bladel1977), the impressions of rectangular stamps (Borodachev & Galin Reference Borodachev and Galin1974) and the thermal conductance and electrical contact resistance of square patches (Argatov Reference Argatov2011).
2. Problem formulation
Consider a droplet of liquid of constant density  $\rho$ and surface tension $\gamma$ lying on a flat substrate. We work in cylindrical polar coordinates $(r,\theta,z)$ with the substrate lying in the plane $z=0$. The contact line of the droplet is located at $r=a_{0}a(\theta )$, where $a_{0}$ is the mean radius. The surface of the droplet is denoted by $\mathcal {S}$. The configuration is shown schematically in figure 1.
A schematic showing (a) a top-down and (b) a side-on view of a thin, nearly circular droplet evaporating into the surrounding atmosphere. The droplet lies on a substrate in the plane  $z = 0$ and its pinned contact line is given by $r = a_{0}a(\theta ) = a_{0}(1 + \epsilon \cos {n\theta })$ where $0<\epsilon \ll 1$. We seek the evaporative flux of liquid vapour, $J$, from the droplet free surface, $\mathcal {S}$.

We assume that the droplet is thin so that, to leading order in the droplet aspect ratio  $\delta = h_{0}/a_{0}$, where $h_{0}$ is the maximum initial thickness of the droplet, it appears to be flat (Dunn et al. Reference Dunn, Wilson, Duffy, David and Sefiane2008). We shall also assume that evaporation is taking place in the diffusion-limited regime (Sultan, Boudaoud & Amar Reference Sultan, Boudaoud and Amar2005), so that the local mass flux from the droplet $J$ may be calculated from the vapour concentration $c$ (Popov Reference Popov2005). In the far field, $c$ approaches the constant value $c_\infty$, while on the surface of the droplet it takes the constant saturation value ${c_{sat}}$.
The system is non-dimensionalised according to
 \begin{equation} c=c_\infty+({c_{sat}}-c_\infty)\hat{c}, \quad J=\frac{D({c_{sat}}-c_\infty)\hat{J}}{a_0}, \quad (r,z)=a_0(\hat{r},\hat{z}), \end{equation}
where  $D$ denotes the diffusion coefficient of vapour in the atmosphere and carets denote dimensionless quantities. Immediately dropping the caret notation, the vapour concentration satisfies Laplace's equation
 \begin{equation} \nabla^2c=0 \ \mbox{in} \ z>0,\end{equation}
subject to appropriate boundary conditions on  $z=0$, namely
 \begin{equation} c=1 \text{ on }\mathcal{S}_{p};\quad \frac{\partial c}{\partial z}=0 \text{ outside }\mathcal{S}_{p},\end{equation}
where  $\mathcal {S}_{p}$ is the projection of $\mathcal {S}$ onto the plane $z = 0$ ( justified by the fact that $\delta \ll 1$) and the far-field condition
 \begin{equation} c\to0\ \text{as}\ \sqrt{r^2+z^2}\to\infty.\end{equation}
Once  $c$ has been determined, the flux $J(r,\theta )$ is given by
 \begin{equation} J ={-}\left.\frac{\partial c}{\partial z}\right|_{z = 0}\end{equation}
for  $(r,\theta )\in \mathcal {S}_{p}$.
3. Evaporative flux
This problem may be posed in a Green's function formulation as
 \begin{equation} c(r,\theta,z) =\frac{1}{2{\rm \pi} }\iint_{\mathcal{S}_{p}} G(r',\theta',0;r,\theta,z)J(r',\theta')r'\, \mathrm{d} r'\, \mathrm{d} \theta',\end{equation}
where the standard Green's function for Laplace's equation with a Neumann condition on  $z' = 0$ is
 \begin{equation} G(r',\theta',z';r,\theta,z) ={-}\frac{1}{4{\rm \pi} }\left(\frac{1}{|\boldsymbol{r}-\boldsymbol{r}'|} + \frac{1}{|\bar{\boldsymbol{r}}-\boldsymbol{r}'|}\right),\end{equation}
where  $\boldsymbol {r} = (r\cos \theta,r\sin \theta,z)$, $\boldsymbol {r}' = (r'\cos \theta ',r'\sin \theta ',z')$ and $\bar {\boldsymbol {r}}$ is the image point of $\boldsymbol {r}$ in the plane $z' = 0$. Hence, by evaluating (3.1) and (3.2) on the droplet free surface, we find from (2.3) that
 \begin{equation} 1 =\frac{1}{2{\rm \pi} }\iint_{\mathcal{S}_{p}} \frac{J(r',\theta')}{\sqrt{r^2+r'^2-2rr'\cos(\theta-\theta')}}r'\,\mathrm{d} r'\,\mathrm{d} \theta'.\end{equation}
We examine the evaporation of a nearly circular droplet with a monochromatic contact line of the form
 \begin{equation} a(\theta)=1+\epsilon \cos n\theta, \end{equation}
where  $n\in \mathbb {N}_{\geq 2}$. Note that $n=1$ corresponds to a translation of the interface and so, even for the non-monochromatic shapes discussed in § 5.1, this mode can be ignored without loss of generality by appropriate selection of the centre of the droplet. Following Fabrikant (Reference Fabrikant1986) and Fabrikant (Reference Fabrikant1991) we make use of the identity
 \begin{equation} \frac{1}{\sqrt{r^2+r'^2-2rr'\cos(\theta-\theta')}} =\frac{2}{{\rm \pi} }\int_0^{min(r,r')} \frac{\mathrm{d}\kern0.7pt x}{\sqrt{r^2-x^2}\sqrt{r'^2-x^2}}L \left(\frac{x^2}{rr'},\theta-\theta'\right), \end{equation}
where
 \begin{equation} L(k,\psi)= \frac{1}{1-k\,{\rm e}^{{\rm i}\psi}}+\frac{1}{1-k\,{\rm e}^{-{\rm i}\psi}}-1 \end{equation}
as first derived by Copson (Reference Copson1947). This allows the Green's function to be written as a composition of Abel-type operators and  $L$-functions, which are easier to treat analytically, allowing (3.3) to be re-written as
 \begin{align} &1=\frac{1}{{\rm \pi} ^2}\int_0^r \frac{\mathrm{d}\kern0.7pt x}{\sqrt{r^2-x^2}} \int_0^{2{\rm \pi} }\,\mathrm{d} \theta'\int_x^{a(\theta')} \frac{r'\,\mathrm{d} r'}{\sqrt{r'^2-x^2}}\nonumber\\ &\quad\times\left[ 1+2 \sum_{j=1}^{\infty}\left( \frac{x^2}{r'r} \right)^j \cos j(\theta-\theta') \right]J(r',\theta')\end{align}
on  $\mathcal {S}_{p}$. Note that this is formally only valid in a circle inscribed inside $r=a(\theta )$, but we shall see that the resulting solution does an excellent job of capturing the evaporative flux even outside of this circle (as is seen, for example, in the numerical validation in §§ 3.1 and 5.1). This has solution
 \begin{gather} J(r,\theta)=\frac{2}{{\rm \pi} }\frac{a}{\sqrt{a^2-r^2}} \{1+\epsilon f_1(r;n)\cos n\theta+\epsilon^2 [f_{20}(r;n)+f_{22}(r;n)\cos 2n\theta ]\}, \end{gather}
 \begin{gather}f_1(r;n)=r^2\frac{1-r^{n-2}}{1-r^2}, \end{gather}
 \begin{gather}f_{20}(r;n)=\frac{2r^4(2-r^{n-2} )-(n-2)(1-r^2)}{4 (1-r^2)^2}, \end{gather}
 \begin{gather}f_{22}(r;n)=\frac{2r^4(1-r^{n-2})+2(1+n) ( 1-r^2)r^{2n}-3r^2(1-r^{2n} )}{4 (1-r^2)^2}, \end{gather}
valid up to  $O(\epsilon ^{2})$, as may be verified via direct substitution into (3.7). This result constitutes the main contribution of the present paper. It shall be shown that this allows for a wide range of newly (asymptotically) accessible shapes of droplets to be treated analytically.
The leading coefficient  $2a/{\rm \pi} \sqrt {a^2-r^2}$ in (3.8) is the ansatz used by Fabrikant (Reference Fabrikant1986). While formally only asymptotically accurate at leading order (and thus equivalent to $1/\sqrt {1-r^2}$ away from the contact line), this form exhibits the correct square root singularity exactly at the contact line (Jackson Reference Jackson1999). The numerator, and the exact form of the denominator, result in the evaporative flux being smooth at $r=0$ (if the prescribed contact line is smooth). Certain quantities, such as the integral flux, can be reasonably approximated by this leading-order solution (Fabrikant Reference Fabrikant1986, Reference Fabrikant1991). However, high accuracy spatial resolution of the flux requires the higher-order corrections given in (3.8)–(3.11). Note that, for example, under the Fabrikant ansatz the contours of constant evaporative flux given by $a/\sqrt {a^2-r^2}=c$ are $r=a\sqrt {1-c^{-2}}$, so that all evaporative flux contours are exactly scaled copies of the contact line, which is generally in stark contrast to the solutions given by direct numerical simulations, as we see for various droplet geometries in figures 2, 5 and 8.
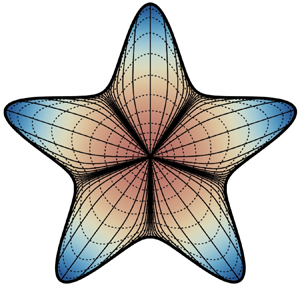
Validation of (3.8) with  $\epsilon = 0.1$ and, from top to bottom, for $n = 3,4,5,6$. (a,c,e,g) Contour plots of the evaporative flux, $J$, where the dashed (black) curve is (3.8) and the solid (grey) curve is according to the results of COMSOL. The solid red curve represents the pinned edge of the droplet. (b,d,f,h) Plots of $J$ between $r=0$ and the nearest/furthest points on the contact line according to COMSOL (solid curve), leading-order solution (dash-dotted curve), first-order solution (dotted curve) and second-order solution (dashed curve) for $J$.
$J$.

It is well known that the late-time dynamics of solute transport in the coffee ring effect is governed by the evaporative flux about the stagnation point in the droplet interior (here, at its centre) (Witten Reference Witten2009). Therefore, for reference, we note that the evaporative flux given by (3.8) satisfies
 \begin{equation} J=\frac{2}{{\rm \pi} }\left[1-\frac{\epsilon^2}{4} ( n-2 )\right]+O(r^2)\text{ as } r\to 0.\end{equation}
Notably, the effect of small azimuthal variations in the droplet contact set are significantly weaker for  $n = 2$ than for other modes. Moreover, a key factor in determining properties of the developing coffee ring in the diffusion-limited evaporative regime is the behaviour of the flux $J$ local to the contact line (Moore et al. Reference Moore, Vella and Oliver2021, Reference Moore, Vella and Oliver2022; Sáenz et al. Reference Sáenz, Wray, Che, Matar, Valluri, Kim and Sefiane2017). For reference, this asymptotic behaviour of $J$ close to the contact line is given explicitly in § 4.2.2. For moderate values of $\epsilon$ and/or $n$, this expansion quantitatively demonstrates that the flux is enhanced close to regions of high curvature of the contact line and inhibited at regions of lower curvature. However, we note briefly that $J$ can diverge (unphysically) towards negative infinity if $\epsilon$ and/or $n$ are chosen to be too large.
A feature of the model not seen in circular contexts is that the contact angle is non-uniform. In the non-thin case, this would result in a varying strength of singularity in the flux at the contact line. However, in this context it is sufficient to assume that the contact angle is zero, so long as  $\delta \ll \epsilon$. In fact, this is a weaker assumption than another we have implicitly made: when linearising the mixed boundary value problem (2.2)–(2.4) onto $z = 0$, errors are $O(\delta )$, so that these are negligible up to second order in our expansion for the evaporative flux provided that $\delta \ll \epsilon ^{2}$. To proceed to even higher orders in $J(r,\theta )$ would necessarily introduce a more stringent restriction on the droplet aspect ratio.
The total flux of liquid into the surrounding air,  $F$, is given by
 \begin{equation} F=\iint_{\mathcal{S}}J\,\mathrm{d} S = 4+\epsilon^2n+O(\epsilon^4).\end{equation}
We note that this result can be determined more rapidly via the reciprocal theorem (Fabrikant Reference Fabrikant1987).
3.1. Validation
In order to validate these results, we compare against direct numerical simulations (DNS) of the full system (2.2)–(2.5) computed using COMSOL Multiphysics (see Appendix A for further details). Results are displayed for  $\epsilon = 0.1$ and different values of $n$ in figure 2. In figure 2(a,c,e,g), we show contour plots comparing the second-order asymptotic prediction given by (3.8) (dashed curves) and the numerical solution (solid curves). It is clear that, even for a relatively large value of $\epsilon$, the agreement is very good, which can be further seen when viewing the evaporative flux along rays of constant $\theta$, as shown in figure 2(b,d,f,h). This agreement holds even close to the contact line, where the flux diverges and we may expect the asymptotic approach to break down due to the caveats surrounding Fabrikant's decomposition.
We can probe the accuracy of (3.8) in further detail by considering the error metric
 \begin{equation} e(\theta;n)=\frac{1}{0.99+\epsilon \cos(n\theta)}\int_{r=0}^{0.99+\epsilon \cos(n\theta)} \left| \frac{J_{asy}-J_{num}}{J_{num}} \right| \mathrm{d} r, \end{equation}
where  $J_{asy}$ and $J_{num}$ are the evaporative fluxes according to asymptotic solutions and direct numerical calculations, respectively. Essentially, $e(\theta,n)$ represents an average relative error in the flux prediction along a radial ray. Note that the ray is truncated just inside the contact line – although past the circle at which the Fabrikant decomposition should break down – due to the sensitivities associated with the evaporative flux singularity in the COMSOL simulations. Using this metric, we find that, for two specific examples with $\epsilon =0.1$,
 \begin{gather} e(0;3) = 1.62\times10^{{-}3}, \quad e({\rm \pi} /3;3)= 1.93\times 10^{{-}3}; \end{gather}
 \begin{gather}e(0;4)=3.02\times10^{{-}3}, \quad e({\rm \pi} /4;4)= 2.72\times 10^{{-}3}, \end{gather}
where the values of  $\theta$ have been chosen since these represent the points furthest and closest to the centre of the droplet, respectively. Clearly, this is further support to the veracity of the asymptotic prediction (3.8). Similar levels of agreement persist for other values of $n$.
$n$.
4. Application to gravity-dominated droplets
Up to this juncture, all of our analysis holds for any thin droplet – i.e. where the contact radius is much larger than the initial maximum thickness of the droplet. However, to explore the findings of the previous sections in an application, we now turn our focus to large droplets where surface tension is dominated by gravity. Such droplets are often called ‘pancake’ (or ‘puddle’) droplets, since the free surface is approximately flat over the bulk of the contact set (Rienstra Reference Rienstra1990), aside from a thin boundary region near the contact line where surface tension is relevant; throughout this analysis we shall assume that surface tension is sufficiently small that this boundary region plays a lower-order role in the analysis so that we may neglect it. We shall periodically revisit the consequences of this assumption in the sequel.
4.1. Internal flow dynamics
We begin by considering the evaporation-driven flow within the droplet. The analysis of this section holds for pure liquids but also, as we discuss shortly, for droplets containing a solute, provided that it is sufficiently dilute.
As described in § 2, the droplet is thin, with aspect ratio  $\delta =h_0/a_0\ll 1$; as result, to leading order, the droplet free surface $h(r,\theta,t)$, the depth-averaged liquid velocity $\boldsymbol {u}(r,\theta,t) = u(r,\theta,t)\boldsymbol {e}_r+v(r,\theta,t)\boldsymbol {e}_\theta$ and the liquid pressure $p(r,\theta,z,t)$ satisfy the thin-film equations, which, as discussed by, for example, Hocking (Reference Hocking1983), Oliver et al. (Reference Oliver, Whiteley, Saxton, Vella, Zubkov and King2015), are given in dimensional form by
 \begin{equation} \frac{\partial h}{\partial t} + \boldsymbol{\nabla}\boldsymbol{\cdot} (h\boldsymbol{u}) ={-}\frac{J}{\rho}, \quad \boldsymbol{u} ={-}\frac{h^{2}}{3\mu}\boldsymbol{\nabla} p, \quad p = p_{{atm}} + \rho g(h-z) - \gamma\nabla^{2}h, \end{equation}
where  $\boldsymbol {\nabla } = \boldsymbol {e}_{r}\partial /\partial r + \boldsymbol {e}_{\theta }(1/r)\partial /\partial \theta$ is the two-dimensional gradient operator, $\mu$ is the liquid viscosity, $p_{{atm}}$ is the ambient pressure of the surrounding gas and $g$ is the magnitude of acceleration due to gravity. Note that the second term in the pressure equation is the hydrostatic pressure, while the final term comes from the curvature of the droplet.
The system (4.1) is non-dimensionalised using the scalings
 \begin{gather} r=a_0 \hat{r}, \quad z =\delta a_0 \hat{z}, \quad t=t_{ref}\hat{t}, \quad h=\delta a_0 \hat{h}, \end{gather}
 \begin{gather}\boldsymbol{u}=u_{ref}\boldsymbol{\hat{u}}, \quad p-p_{{atm}}=\rho g a_0 \delta \hat{p}, \end{gather}
where  $t_{ref}$ and $u_{ref}$ are reference time and velocity scales, given by
 \begin{equation} t_{ref}=\frac{\rho \delta a_0^2}{D(c_\text{sat}-c_\infty)}, \quad u_{ref}=\frac{a_0}{t_{ref}}=\frac{D(c_\text{sat}-c_\infty)}{\rho \delta a_0}. \end{equation}
Hence, dropping the caret notation immediately, we find that
 \begin{equation} \frac{\partial h}{\partial t} + \boldsymbol{\nabla}\boldsymbol{\cdot} \left(h\boldsymbol{u}\right) ={-}J, \quad \boldsymbol{u} ={-}\frac{{Bo}}{{Ca}}\frac{h^{2}}{3}\boldsymbol{\nabla} p, \quad p = h-z - \frac{1}{{Bo}}\nabla^{2}h, \end{equation}
where
 \begin{equation} {Bo} = \frac{\rho g a_{0}^{2}}{\gamma} \quad \mbox{and} \quad {Ca} = \frac{\mu u_{{ref}}}{\delta^{3}\gamma}, \end{equation}
are the Bond and capillary numbers, respectively.
Assuming the droplet is sufficiently large that  ${Bo}\gg 1$ – and, for the sake of rigour, that ${Bo}\gg {Ca}$, although for many typical configurations, the capillary number will be small, (see for example, Moore et al. (Reference Moore, Vella and Oliver2021), for a discussion) – we seek an expansion of the form
 \begin{gather} p =h_0 - z +
\textit{Bo}^{-1} p_0 + O({Bo}^{{-}2}), \quad h = h_0 +
O({Bo}^{{-}1}), \notag\\ \boldsymbol{u} = \boldsymbol{u}_0
+ O({Bo}^{{-}1}) \quad {\rm as}\ \textit{Bo} \rightarrow 0.
\end{gather}
\begin{gather} p =h_0 - z +
\textit{Bo}^{-1} p_0 + O({Bo}^{{-}2}), \quad h = h_0 +
O({Bo}^{{-}1}), \notag\\ \boldsymbol{u} = \boldsymbol{u}_0
+ O({Bo}^{{-}1}) \quad {\rm as}\ \textit{Bo} \rightarrow 0.
\end{gather}
To leading order, clearly we must have  $\boldsymbol {\nabla } (h_0-z) = 0$ so that $h_0=h_0(t)$. Proceeding to the next order, we see that the velocity is given by
 \begin{equation} \boldsymbol{u}_0 ={-}\frac{h_0^{2}}{3{Ca}}\boldsymbol{\nabla} p_0, \end{equation}
where the pressure perturbation  $p_0(r,\theta,t)$ is related to the free surface evolution and the evaporative flux via the thin-film equation
 \begin{equation} \frac{\mathrm{d} h_0}{\mathrm{d} t}-\frac{h_0^3}{3{Ca}}\nabla^2p_0={-}J \quad \mbox{for}\ 0< r<1+\epsilon\cos n\theta, \; 0\leq \theta<2{\rm \pi} .\end{equation}
We require a suitable boundary condition to solve this: a physically reasonable one is to impose no flux of liquid through the pinned contact line
 \begin{equation} -\boldsymbol{n}\boldsymbol{\cdot} \frac{h_0^3}{3{Ca}}\boldsymbol{\nabla} p_0 = 0 \ \mbox{on}\ r = 1+\epsilon\cos n\theta, \, 0\leq \theta<2{\rm \pi}, \end{equation}
where  $\boldsymbol {n}$ is the outward-pointing unit normal to the contact line.
Hence, given the evaporative flux (3.8), the leading-order flow dynamics reduces to solving (4.9) and (4.10), which we shall now pursue. In so doing, we drop the subscript notation on the leading-order variables for brevity.
4.1.1. Free surface profile and droplet lifetime
To determine  $h(t)$, we consider the usual liquid mass conservation equation ${\rm d}V/{\rm d}t=-F$, which yields
 \begin{equation} \frac{\mathrm{d} }{\mathrm{d} t}\left[ h(t)\int_{\theta=0}^{2{\rm \pi} }\int_{r=0}^{1+\epsilon \cos(n\theta)}r\,\mathrm{d} r\,\mathrm{d} \theta \right]={-}\int_{0}^{2{\rm \pi} }\int_{0}^{1+\epsilon\cos n\theta} rJ(r,\theta)\,\mathrm{d} r\,\mathrm{d} \theta ={-}(4+\epsilon^{2}n), \end{equation}
by (3.13). Hence, evaluating the integral on the left-hand side of (4.11), we find
 \begin{align} &{\rm \pi}\left(1+\frac{\epsilon^2}{2}\right)\frac{\mathrm{d} h}{\mathrm{d} t}+O(\epsilon^{3}) ={-}(4+\epsilon^2n)+O(\epsilon^{3})\nonumber\\ &\quad \implies h=1-\frac{t}{{\rm \pi} }(4+\epsilon^2(n-2))+O(\epsilon^{3}). \end{align}
We therefore find that the droplet lifetime – that is, the time at which all the liquid has fully evaporated – is given up to second order in  $\epsilon$ by
 \begin{equation} t=t_f=\frac{{\rm \pi} }{4}\left(1-\frac{\epsilon^2}{4}(n-2)\right). \end{equation}
Notably, as for the expansion of the evaporative flux in the vicinity of the internal stagnation point of the droplet (3.12), the perturbations to the free surface evolution and the droplet lifetime are significantly smaller for the  $n = 2$ case than for $n>2$. We also note that the conservation condition (4.11) guarantees the existence of a solution to the Neumann problem (4.9)–(4.10).
4.2. Liquid pressure
The liquid pressure may now be calculated from (4.9)–(4.10). To simplify the algebra, we write
 \begin{equation} p=\frac{3{Ca}}{h^3}\left[ \frac{\dot{h}}{4}r^2+\frac{2}{{\rm \pi} }Q \right] \implies \nabla^2Q=\frac{{\rm \pi} }{2}J.\end{equation}
4.2.1. Outer region
In the bulk of the droplet where  $1-r = O(1)$, the expression (3.8) for evaporative flux may be expanded as $J(r,\theta ) = J_{0}(r) + \epsilon J_{1}(r,\theta ) + \epsilon ^{2} J_{2}(r,\theta ) + \cdots$ as $\epsilon \rightarrow 0$, where
 \begin{gather} J_{0}(r) = \frac{2}{{\rm \pi} \sqrt{1-r^{2}}}, \end{gather}
 \begin{gather}J_{1}(r,\theta) = \frac{2}{{\rm \pi} (1-r^{2})^{3/2}}\left((1-r^{2})f_{1}(r;n) - r^{2}\right)\cos{n\theta}, \end{gather}
 \begin{align} J_{2}(r,\theta) &= \frac{1}{{\rm \pi} (1-r^{2})^{5/2}}\left[2(1-r^{2})^{2}(f_{20}(r;n) + f_{22}(r;n)\cos{2n\theta})\vphantom{\frac{r^{2}}{2}}\right. \nonumber\\ &\quad+\left.\frac{r^{2}}{2}(1+\cos{2n\theta})(3-2f_{1}(r;n)(1-r^{2}))\right], \end{align}
where  $f_{1}$, $f_{20}$ and $f_{22}$ are given by (3.9)–(3.11). This suggests seeking a solution for $Q$ of the form
 \begin{equation} Q(r,\theta) = Q_0(r)+\epsilon (C_{O10} + Q_1(r)\cos n\theta)+\epsilon^2(Q_{20}(r)+Q_{21}(r)\cos 2n\theta) + \cdots \end{equation}
as  $\epsilon \rightarrow 0$. We find that
 \begin{gather} Q_0(r) = C_{O0}-\sqrt{1-r^2}+\tanh ^{{-}1} (\sqrt{1-r^2})+\log{r}, \end{gather}
 \begin{gather}Q_1(r;n) = C_{O11} r^n+\frac{1}{4} r^{n+2} \varGamma (n) \, _2\tilde{F}_1\left(\frac{3}{2},n+1;n+2;r^2\right)- \frac{r^n}{2 n \sqrt{1-r^2}}, \end{gather}
 \begin{gather}Q_{20}(r;n) = C_{O20}+\frac{1}{4} \left(n \log (\sqrt{1-r^2}+1)+\frac{1}{\sqrt{1-r^2}}\right), \end{gather}
 \begin{align} &Q_{21}(r;n) = C_{O21} r^{2 n}-\frac{r^{2 n} ((2 n-1) r^2-2 n)}{16 n (1-r^2)^{3/2}} \nonumber\\ &\quad +\frac{r^{2 n} (r^2)^{{-}2 n} ((2 n-1) B_{r^2}(2 n+2,-\frac{3}{2})-2 (n+1) B_{r^2}(2 n+1,-\frac{3}{2}))}{32 n}, \end{align}
where  $B_{x}(\alpha,\beta ) = \int _{0}^{x}t^{\alpha -1}(1-t)^{\beta -1}\,\mbox {d}t$ is the incomplete beta function and $_2\tilde {F}_1(a,b;c;d) = {}_2F_1(a,b;c;d)/\varGamma (c)$ is the regularised hypergeometric function. The constants $C_{O0}$, $C_{O10}$ and $C_{O20}$ are arbitrary undetermined functions of time (recall that the pressure is determined by solving a Neumann problem). On the other hand, the coefficients $C_{O11}$ and $C_{O21}$ must be determined by matching to an inner region in the vicinity of the contact line where our naïve expansions for $J$ and $Q$ break down.
4.2.2. Inner region
We introduce the local variable
 \begin{equation} r=1-\epsilon \bar{r}. \end{equation}
Let us write  $J = J^{(i)}(\bar {r},\theta )$ and $Q = Q^{(i)}(\bar {r},\theta )$ in the inner region. Upon substituting the scaling (4.23) into the evaporative flux (3.8) and expanding as $\epsilon \rightarrow 0$, we find that the local expansion of the evaporative flux is given by
 \begin{equation} J^{(i)}(\bar{r},\theta)=\frac{1}{\sqrt{\epsilon}} (J_0^{(i)}(\bar{r},\theta)+\epsilon J_1^{(i)}(\bar{r},\theta)+\epsilon^2J_2^{(i)}(\bar{r},\theta) +\cdots),\end{equation}
where
 \begin{gather} J_0^{(i)}(\bar{r},\theta)=\frac{\sqrt{2}}{{\rm \pi} \sqrt{\cos (n \theta )+\bar{r}}}, \end{gather}
 \begin{gather}J_1^{(i)}(\bar{r},\theta)=\frac{(2 n-1) \cos (n \theta )+\bar{r}}{2 \sqrt{2} {\rm \pi}\sqrt{\cos (n \theta )+\bar{r}}}, \end{gather}
 \begin{gather}J_2^{(i)}(\bar{r},\theta)=\frac{-4 (2 n (2 n\!-\!5)\!+\!3) \bar{r} \cos (n \theta )\!+\!(3\!-\!4 n (3 n\!+\!1)) \cos (2 n \theta )\!-\!4 (n\!-\!1) n\!+\!6 \bar{r}^2\!+\!3}{32 \sqrt{2} {\rm \pi}\sqrt{\cos (n \theta )\!+\!\bar{r}}}. \end{gather}
Then, upon substituting this and the scaling (4.23) into the Poisson equation (4.9), we find that
 \begin{equation} \left(\frac{1}{\epsilon^2}\frac{\partial ^2}{\partial \bar{r}^2}-\frac{1}{1-\epsilon \bar{r}}\frac{\partial }{\partial \bar{r}}+\frac{1}{(1-\epsilon \bar{r})^2}\frac{\partial ^2}{\partial \theta^2}\right) Q^{(i)}=\frac{{\rm \pi} }{2}J^{(i)} \end{equation}
for  $\bar {r} > -\cos {n\theta }, 0\leq \theta <2{\rm \pi}$, while the no-flux condition (4.10) is given by
 \begin{equation} -1-\epsilon \cos n\theta-\frac{1}{\epsilon}\frac{\partial Q^{(i)}}{\partial \bar{r}} +\epsilon\frac{\partial ^2Q^{(i)}}{\partial \theta^2}+\epsilon^2\frac{2-n}{4}=0 \ \mbox{on} \ \bar{r} ={-}\cos{n\theta}, \ 0\leq\theta<2{\rm \pi} . \end{equation}
Together, these suggest that we seek an inner expansion of the form
 \begin{equation} Q^{(i)}(\bar{r},\theta)=C_{O0}+\epsilon( Q^{(i)}_0(\bar{r},\theta)+\epsilon^{1/2}Q^{(i)}_{1/2} (\bar{r},\theta)+\epsilon Q^{(i)}_1(\bar{r},\theta)+\cdots) \end{equation}
as  $\epsilon \rightarrow 0$. Proceeding order by order in the standard way, we find the first five inner solutions are given by
 \begin{gather} Q^{(i)}_0(\bar{r},\theta)=C_{I0}(\theta)-\bar{r}, \end{gather}
 \begin{gather}Q^{(i)}_{1/2}(\bar{r},\theta)=C_{I1/2}(\theta)+\frac{2\sqrt{2}}{3} (\cos (n \theta )+\bar{r})^{3/2}, \end{gather}
 \begin{gather}Q^{(i)}_1(\bar{r},\theta)=C_{I1}(\theta)-2 \bar{r} \cos (n \theta )-\frac{\bar{r}^2}{2}, \end{gather}
 \begin{gather}Q^{(i)}_{3/2}(\bar{r},\theta)=C_{I3/2}(\theta)+\frac{((10 n-1) \cos (n \theta )+9 \bar{r}) (\cos (n \theta )+\bar{r})^{3/2}}{15 \sqrt{2}}, \end{gather}
 \begin{align} Q^{(i)}_2(\bar{r},\theta)&=C_{I2}(\theta)-\tfrac{1}{6} \bar{r} (6 \cos (n \theta ) (C_{I0}''(\theta )+\bar{r})-6 n \sin (n \theta ) C_{I0}'(\theta )\nonumber\\ &\quad +3 \cos (2 n \theta )+3 \bar{r} C_{I0}''(\theta )+2 \bar{r}^2+3). \end{align}
 It remains to determine the constants  $C_{O11}$, $C_{O21}$ from the outer region (4.19) and the functions $C_{Ij}(\theta )$ from the inner. This may be done by using a standard matching procedure (using, for example, an intermediate variable), and we find that
 \begin{gather} C_{O11}=\frac{2}{n}-\frac{\sqrt{{\rm \pi} } \varGamma (n)}{ 2\varGamma (n+\frac{1}{2})}, \end{gather}
 \begin{gather}C_{O21}=\frac{1}{8} \left[\frac{2}{n}+\sqrt{{\rm \pi} } \left(\frac{4 \varGamma (n+1)}{\varGamma (n+\frac{1}{2})}-\frac{\varGamma (2 n+1)}{\varGamma (2 n+\frac{1}{2})}\right)-8\right], \end{gather}
 \begin{gather}C_{I1/2}(\theta)=C_{I3/2}(\theta)=0, \end{gather}
 \begin{gather}C_{I0}(\theta)= C_{O10} + \left(\frac{2}{n}-\frac{\sqrt{{\rm \pi} } \varGamma (n)}{\varGamma (n+\frac{1}{2})}\right) \cos (n \theta), \end{gather}
 \begin{gather}C_{I1}(\theta)=C_{O20} + \frac{\cos(2n\theta)}{4} \left[\frac{1}{n}-4+\sqrt{{\rm \pi} } \left(\frac{2 n \varGamma (n)}{\varGamma (n+\frac{1}{2})}-\frac{\varGamma (2 n+1)}{\varGamma (2 n+\frac{1}{2})}\right) \right]. \end{gather}
The remaining unknown function  $C_{I2}(\theta )$ may be determined by proceeding to higher order in the outer region, but since it is not needed in the present analysis, we shall forgo this.
4.3. Final residue
Having determined the flow dynamics, we may now investigate the transport of an inert, dilute solute within the droplet whose concentration is given by  $\phi = \phi _{{ref}}\hat {\phi }$, where $\phi _{{ref}}$ is the initial (uniform) solute concentration. We shall, once again, drop the caret on the dimensionless variable going forward.
Under the dilute assumption, the flow and solute transport completely decouple and the distribution of the solute may be analysed in detail by considering an appropriate advection-diffusion equation for the solute concentration within the droplet (see, for example, Wray et al. Reference Wray, Papageorgiou, Craster, Sefiane and Matar2014; Sáenz et al. Reference Sáenz, Wray, Che, Matar, Valluri, Kim and Sefiane2017; Moore et al. Reference Moore, Vella and Oliver2021, Reference Moore, Vella and Oliver2022). However, in the present analysis, we shall focus on the final residue at the contact line – the ‘coffee ring’ – which simplifies the mathematics.
Previous studies (Freed-Brown Reference Freed-Brown2015; Sáenz et al. Reference Sáenz, Wray, Che, Matar, Valluri, Kim and Sefiane2017; Moore et al. Reference Moore, Vella and Oliver2022) have demonstrated that asymmetry in the contact line geometry leads to heterogeneities in the coffee ring profile. This holds for both surface tension-dominated and gravity-dominated droplets. In particular, the coffee ring effect is enhanced (respectively, inhibited) in regions where the curvature of the contact line is larger (smaller). This effect can be shown to arise purely due to the geometry of the droplet by considering a uniform evaporative flux (Freed-Brown Reference Freed-Brown2015; Moore et al. Reference Moore, Vella and Oliver2022), but is further exacerbated in regimes where evaporation is diffusion-dominated, due to the enhanced flux in these high-curvature regions (see, for example, Sáenz et al. (Reference Sáenz, Wray, Che, Matar, Valluri, Kim and Sefiane2017), but also note the plots in figure 2).
Here, we investigate this phenomenon quantitatively for a range of different droplet geometries. As stated above, we shall concentrate on the variation of the final residue at the contact line as a function of position. In our analysis, we shall neglect the effects of any solute jamming or coupling between the flow and transport problems – this is very likely to be important at later stages of the evaporative process for a real world scenario, see, for instance, Popov (Reference Popov2005), Kaplan & Mahadevan (Reference Kaplan and Mahadevan2015) and Guazzelli & Pouliquen (Reference Guazzelli and Pouliquen2018) for a discussion of different models for finite particle size effects, and Moore et al. (Reference Moore, Vella and Oliver2021, Reference Moore, Vella and Oliver2022) for a discussion of the limits of the dilute regime – so that, by the time the droplet fully evaporates, all of the solute has been transported to the contact line (Deegan et al. Reference Deegan, Bakajin, Dupont, Huber, Nagel and Witten1997). We may exploit this fact to greatly simplify our calculations.
In the thin-droplet limit, vertical diffusion of solute is sufficiently strong that the distribution of solute is independent of  $z$ to leading order and, as shown by, for example, Wray et al. (Reference Wray, Wray, Duffy and Wilson2021), the solute concentration is advected along particle paths, viz.
 \begin{equation} \frac{\mathrm{d} \phi}{\mathrm{d} t}=\frac{\phi J}{h} \ \text{on} \ \frac{\mathrm{d} r}{\mathrm{d} t}=u, \quad \frac{\mathrm{d} \phi}{\mathrm{d} t}=\frac{v}{r}. \end{equation}
Moreover, since pathlines coincide with streamlines due to the separable nature of time in the flow, we can actually simplify things even further. Consider the situation in figure 3, where two streamlines  $\theta = \psi (r;\theta _i)$ start at the source at the centre of the droplet and, by dryout, reach the contact line at $\theta =\theta _i$ where $i = a, b$, respectively. Then, the total mass accumulated at the contact line between $\theta _a$ and $\theta _b$ is exactly the total initial mass in region $B$. As a result, the density of the final mass accumulated at the contact line, $D$, is given by
 \begin{equation} D=\frac{\mathrm{d} M}{\mathrm{d} s}=\left.\frac{1}{\mathrm{d}s/\mathrm{d}\theta} \frac{\mathrm{d} M}{\mathrm{d} \theta}\right|_{\theta = \theta_a}= \left.\frac{1}{\sqrt{r^2+r_\theta^2}}\frac{\mathrm{d} M}{\mathrm{d} \theta} \right|_{\theta = \theta_a}=\left.\frac{1}{\sqrt{a^2 +a_{\theta}^2}}\frac{\mathrm{d} M}{\mathrm{d} \theta}\right|_{\theta = \theta_a}.\end{equation}
Illustration of the geometrical methodology used to determine the final deposit  $D$ as a function of position around the contact line. The deposit accumulated at the contact line between $\theta _{a}$ and $\theta _{b}$, is precisely the mass located in the region $B$.
$B$.

Thus, we have reduced the problem to determining  $\mathrm {d} M/\mathrm {d}\theta$ at the contact line. Let $\mathscr {A}(\theta _a)$ be the area bounded by $\theta =0$, the contact line, and the streamline $\theta =\psi (r;\theta _a)$, so that in figure 3, $\mathscr {A}(\theta _a)$ corresponds to region $A$. Then
 \begin{align} \left.\frac{\mathrm{d} M}{\mathrm{d} \theta_a}\right|_{\theta_a} &=\lim_{\delta \theta\to0} \left[\iint_{\mathscr{A}(\theta_a +\delta\theta)}\,\mathrm{d} A-\iint_{\mathscr{A}(\theta_a)}\,\mathrm{d} A\right]=\lim_{\delta \theta\to0}\int_{r=0}^{1+\epsilon \cos(n\theta_a)} \int_{\theta=\psi(r;\theta_a)}^{\psi(r;\theta_a+\delta \theta)}r\,\mathrm{d} r\,\mathrm{d} \theta \nonumber\\ &=\int_{r=0}^{1+\epsilon \cos(n\theta_a)} r\frac{\partial \psi}{\partial \theta_a}\,\mathrm{d} r. \end{align}
 Thus, we now need to write  $\psi$ as a function of $\theta _a$ (and $r$), which we pursue using the differential equation
 \begin{equation} \frac{\mathrm{d} \psi}{\mathrm{d} r}=\frac{v}{ru}=\frac{p_\theta}{r^2p_r} \quad \mbox{for}\ 0< r<1+\epsilon\cos{n\theta_a},\end{equation}
subject to  $\psi (1+\epsilon \cos {n\theta _a};\theta _a) = \theta _a$. Given that the pressure solution found in § 4.2 is given in two distinct regions, we find a similar asymptotic structure holds for the streamlines.
4.3.1. Outer region
Since, for a nearly circular droplet, the streamlines will be small perturbations to a radial ray, we seek an asymptotic solution of the form
 \begin{equation} \psi=\theta_a+\epsilon \psi_1+\epsilon^2\psi_2+\cdots, \end{equation}
so that (4.44) gives
 \begin{align} &\frac{\mathrm{d} (\epsilon\psi_1+\epsilon^2\psi_2)}{\mathrm{d} r}= \epsilon\frac{ n Q_1 \sin (n \theta_a)}{r^2 (r-Q_0')}\nonumber\\ &\quad +\epsilon^2 \left[\frac{n^2 Q_1 \cos (n \theta_a)}{r^2 (r-Q_0')}\psi_1+\frac{2 n Q_{21} \sin (2 n \theta_a)}{r^2 (r-Q_0')}+\frac{n Q_1 Q_1' \sin (2n \theta_a) }{2r^2 (r-Q_0')^2}\right], \end{align}
where  $Q_{0}$, $Q_{1}$ and $Q_{21}$ are given by (4.19), (4.20) and (4.22), respectively.
Unfortunately, analytic solutions for  $\psi _1$ and $\psi _2$ are not available for general $n$ – although for a specific $n$, asymptotic solutions and numerical solutions are relatively straightforward to find. Here, for illustrative purposes, we examine the particular case $n=2$. We find
 \begin{equation} \psi_1(r)=\frac{\sin 2\theta_a}{3}\left[P_{O1} + \frac{1}{r^{2}} (\sqrt{1-r^2}+r^2 (\tanh^{{-}1} (\sqrt{1-r^2})+2 \log (r))-1)\right],\end{equation}
where  $P_{O1}$ must be determined by matching. Similarly, at $O(\epsilon ^{2})$, we find
 \begin{align} \psi_2(r)&=\frac{\sin 4 \theta_a}{630} \left[P_{O2}-\frac{4}{r^4}+\frac{3 r^2}{2}-\frac{41+70P_{O1}}{r^2}\right. \nonumber\\ &\quad +35 \log ^2(\sqrt{1-r^2}+1)-5(14P_{O1}-33)\log (\sqrt{1-r^2}+1)\nonumber\\ &\quad +\frac{70 (\sqrt{1-r^2}-1) \log (\sqrt{1-r^2}+1)}{r^2}\nonumber\\ &\quad +\frac{70 \log{r} (\sqrt{1-r^2}+r^2 \log (\sqrt{1-r^2}+1)-1)}{r^2}\nonumber\\ &\quad \left.+\sqrt{1-r^2} \left(\frac{4}{r^4}+\frac{43+70P_{O1}}{r^2}+ \frac{210}{1-r^2}-273\right)\right.\nonumber\\ &\quad \left.+\,35 \log ^2(r)+35(1+2P_{01}) \log{r}\vphantom{\left[P_{O2}-\frac{4}{r^4}+\frac{3 r^2}{2}-\frac{41+70P_{O1}}{r^2}\right.}\right], \end{align}
where  $P_{02}$ again must be determined by matching.
As expected, this asymptotic solution becomes disordered close to the contact line, so we turn to a boundary layer to determine the local streamlines and find the constants  $P_{O1}$ and $P_{O2}$.
4.3.2. Inner region
Again utilising the scaling (4.23) and the expansion (4.30) for  $Q^{(i)}$, we seek an asymptotic solution of (4.44) of the form
 \begin{equation} \psi=\theta_a+\epsilon^{3/2}(\psi^{(i)}_0+ \epsilon^{1/2}\psi^{(i)}_{1/2}+\cdots), \end{equation}
as  $\epsilon \rightarrow 0$. The streamline equation (4.44) becomes
 \begin{align} &-\frac{1}{\epsilon}\frac{\mathrm{d} (\epsilon^{3/2}\psi^{(i)}_0+ \epsilon^2\psi^{(i)}_{1/2})}{\mathrm{d} \bar{r}}=\epsilon^{1/2} \left[ -\frac{\partial Q^{(i)}_0/\partial \theta}{\partial Q^{(i)}_{1/2}/\partial \bar{r}} \right]\nonumber\\ &\quad +\epsilon\left[ -\frac{\partial Q^{(i)}_{1/2}/\partial \theta}{\partial Q^{(i)}_{1/2}/\partial \bar{r}}+\frac{\partial Q^{(i)}_0}{\partial \theta} \left(\frac{\partial Q^{(i)}_{1/2}}{\partial \bar{r}} \right)^{{-}2} \left( \frac{\partial Q^{(i)}_1}{\partial \bar{r}}-\bar{r} \right)\right] \end{align}
for  $\bar {r}>-\cos n\theta _a$, where $Q^{(i)}_0$, $Q^{(i)}_{1/2}$ and $Q^{(i)}_1$ are given by (4.31), (4.32) and (4.33), respectively. This must be solved subject to the boundary conditions
 \begin{equation} \psi_{0}^{(i)}(-\cos{n\theta_a}) = \psi_{1/2}^{(i)}(-\cos{n\theta_a}) = 0. \end{equation}
 The inner problem is tractable for general  $n$: solving successively yields
 \begin{gather} \psi^{(i)}_0(\bar{r})=\sqrt{2}\frac{ \left(\sqrt{{\rm \pi} } \varGamma (n+1)-2 \varGamma \left(n+\frac{1}{2}\right)\right) }{\varGamma \left(n+\frac{1}{2}\right)}\sqrt{\cos (n \theta _a)+\bar{r}}\sin n \theta _a , \end{gather}
 \begin{gather}\psi^{(i)}_{1/2}(\bar{r})=\left({-}n+\frac{\sqrt{{\rm \pi} } \varGamma (n+1)}{\varGamma (n+\frac{1}{2})}-2\right) (\cos (n \theta_a )+\bar{r})\sin n \theta_a. \end{gather}
In the particular case  $n=2$, the first two inner solutions are thus given by
 \begin{gather} \psi^{(i)}_0(\bar{r})=\tfrac{2}{3} \sqrt{2} \sqrt{\cos (2 \theta _a)+\bar{r}} \sin 2 \theta _a , \end{gather}
 \begin{gather}\psi^{(i)}_{1/2}(\bar{r})={-}\tfrac{4}{3} (\bar{r}+\cos (2 \theta_a ))\sin 2 \theta_a. \end{gather}
These can be matched against (4.47)–(4.48) in a similar manner to the pressure, yielding
 \begin{equation} P_{O1} = 1, \quad P_{O2}={-}\tfrac{613}{2}. \end{equation}
 Hence, for  $n = 2$, we may construct a additive composite solution for the streamlines by combining (4.47)–(4.48) and (4.54)–(4.55), which takes the form
 \begin{align} \psi(r) & = \theta_a+\epsilon \psi_1(r)+\epsilon^{2} \psi_2(r)+\epsilon^{3/2}\psi^{(i)}_0\left( \frac{1-r}{\epsilon} \right)+\epsilon^2\psi^{(i)}_{1/2}\left( \frac{1-r}{\epsilon} \right) \nonumber\\ & \quad -\left[ \epsilon\frac{2\sqrt{2}}{3} \sqrt{1-r} \sin 2\theta _a-\epsilon\frac{4}{3} (1-r) \sin2 \theta _a+\epsilon^2\frac{\sin 4 \theta _a}{3\sqrt{2} \sqrt{1-r}} + \frac{4}{3}\cos4\theta_a\right], \end{align}
where the terms in the second line represent the overlap contributions between the outer and inner solution, which have been determined using Van Dyke's matching rule (Van Dyke Reference Van Dyke1964).
4.3.3. Mass determination
Finally, we wish to compute
 \begin{equation} \left.\frac{\mathrm{d} M}{\mathrm{d} \theta}\right|_{\theta=\theta_a}=\int_0^{1+\epsilon \cos n \theta_a}r\frac{\partial \psi}{\partial \theta_a}\,\mathrm{d} r,\end{equation}
and hence the density  $D$ given by (4.42). Since we only have a complete analytical solution for $n = 2$, we shall present the residue calculation in detail for this example. It is straightforward to extend the analysis to a particular $n$, although we are unable to present a closed form solution for general $n$.
$n$.
Given that we have inner and outer solutions for  $\psi$, we can divide (4.58) into two integrals by choosing $0<\epsilon \ll \delta \ll 1$, and then splitting the interval of integration into $(0,1-\delta )$ and $(1-\delta,1+\epsilon \cos 2\theta _a)$, where we use the outer solution for $\psi$ in the first interval, and the inner solution in the second. Thus, the density is given by
 \begin{align} D & = \frac{1}{\sqrt{(1+\epsilon \cos 2\theta_a)^2+(-\epsilon2\sin 2\theta_a)^2}}\int_0^{1+\epsilon \cos n \theta_a}r\frac{\partial \psi}{\partial \theta_a}\,\mathrm{d} r \end{align}
 \begin{align} & \sim \left(1 - \epsilon\cos2\theta_a + \frac{\epsilon^2}{2}(\cos4\theta_a -1)\right)\left[\int_0^{1-\delta} r\frac{\partial }{\partial \theta_a}[\theta_a+\epsilon \psi_1+\epsilon^2 \psi_2 ]\,\mathrm{d} r \right.\nonumber\\ & \quad +\left.\int_{\delta/\epsilon}^{-\cos 2 \theta_a}(1-\epsilon \bar{r})\frac{\partial }{\partial \theta_a}\left[ \theta_c+\epsilon^{3/2}\psi^{(i)}_0+\epsilon^2\psi^{(i)}_2 \right]\left(-\epsilon \,\mathrm{d} \bar{r}\right)\right] \end{align}
 \begin{align} & \sim \frac{1}{2}+ \frac{\epsilon}{6} (1+4\log 2) \cos 2 \theta _a\nonumber\\ & \quad -\epsilon^2\left[ \frac{1+\log 2}{3}+\frac{501+70 {\rm \pi}^2+1116 \log 2-1680 \log ^2 2}{3780}\cos 4 \theta_a \right] \end{align}
as  $\epsilon \rightarrow 0$.
There are several interesting points about the preceding result. Firstly, if  $\epsilon =0$, we retrieve the expected uniform density $D = 1/2$ for a circular droplet. Secondly, when $\epsilon >0$, we see that the coefficient of the $O(\epsilon )$-term in (4.61) is maximised for $\theta _a = 0, {\rm \pi}$ – i.e. where the contact line has highest curvature – and minimised when $\theta _a = {\rm \pi}/2, 3{\rm \pi} /2$ – i.e. where the contact line has lowest curvature. Thus, we see the expected enhancement (respectively, diminishing) of the coffee ring effect along the high-curvature (low-curvature) parts of the contact line.
Thirdly, we note that, in the vicinity of zeros of  $\cos 2\theta _a$, the $O(\epsilon ^2)$-term dominates the $O(\epsilon )$-term in (4.61). Indeed, we moreover find that there are four regions in which the perturbation of the density from the circular solution is $o(\epsilon ^2)$; namely about
 \begin{align} &\theta_a = \frac{{\rm \pi}
}{4} + \epsilon\alpha,\quad \frac{3{\rm \pi} }{4} - \epsilon\alpha,\quad \frac{5{\rm \pi} }{4} + \epsilon\alpha,\quad \frac{7{\rm \pi} }{4} - \epsilon\alpha\nonumber\\ & \text{where} \nonumber\\
& \alpha = \frac{70{\rm \pi} ^2 - 1680\log^2{2} - 144\log{2} -
759}{1260(4\log{2} + 1)}.
\end{align}
\begin{align} &\theta_a = \frac{{\rm \pi}
}{4} + \epsilon\alpha,\quad \frac{3{\rm \pi} }{4} - \epsilon\alpha,\quad \frac{5{\rm \pi} }{4} + \epsilon\alpha,\quad \frac{7{\rm \pi} }{4} - \epsilon\alpha\nonumber\\ & \text{where} \nonumber\\
& \alpha = \frac{70{\rm \pi} ^2 - 1680\log^2{2} - 144\log{2} -
759}{1260(4\log{2} + 1)}.
\end{align} To calculate the cumulative mass,  $M(\theta _a)$, between the ray $\theta = \theta _a$ and the horizontal, we may integrate the density (4.61) around the contact line with respect to arc length $s$. We find that
 \begin{equation} M=\theta_a(\tfrac{1}{2}+\epsilon^2 c_1)+\epsilon c_2 \sin 2\theta_a+\epsilon^2 c_3\sin 4\theta_a,\end{equation}
where the coefficients  $c_1$, $c_2$ and $c_3$ are given in table 1. For reference, we also include numerical estimates of the same coefficients for $\epsilon = 0.2$. We see that, despite the relatively large value of $\epsilon$, the comparison between the numerical and asymptotic predictions of the final residue is good.


Further details of the asymptotic solution for the  $n = 2$ example are shown in figure 4. We plot contours of the evaporative flux (dashed lines), while the liquid pressure (4.14) is given by the shading, with the higher pressure corresponding to darker shading. The pressure gradient drives a volume flux towards the contact lines, with the composite streamlines (4.57) given by the solid curves. Note that the streamlines do not approach the contact line perpendicularly as observed in the surface tension-dominated limit (Sáenz et al. Reference Sáenz, Wray, Che, Matar, Valluri, Kim and Sefiane2017; Wray et al. Reference Wray, Wray, Duffy and Wilson2021). This is due the absence of the $h\sim a-r$ zero of the interface in the present work due to the neglect of the small surface tension boundary layer. In practice, we anticipate that including this boundary layer would result in such behaviour being recovered.
Asymptotic results for the case  $n=2$, $\epsilon =0.2$: the liquid pressure (darker shading corresponds to higher pressure), contours of the evaporative flux (dashed curves) and liquid streamlines (solid curves).

5. Droplets with polychromatic footprints
5.1. Evaporation of droplets with regular polygonal footprints
As discussed previously, it is very desirable to be able to determine the evaporative flux for droplets with non-monochromatic footprints, especially shapes such as polygons. However, exact polygons are problematic due to the presence of sharp corners (and hence Fourier representations that do not decay), and so instead we apply our approach of §§ 3–4 to smoothed polygons. We note that Popov & Witten (Reference Popov and Witten2003) and Zheng, Popov & Witten (Reference Zheng, Popov and Witten2005) discuss the evaporative flux and associated deposition pattern for solute-laden flows in sharp corners in detail.
To utilise our analysis in § 3, we seek a Fourier representation of a smoothed polygon as follows. The parametric equation for a regular  $n$-gon is
 \begin{equation} r=\left| \sec \left( \theta-\frac{2{\rm \pi} }{n}\left\lfloor \frac{{\rm \pi} +n\theta}{2{\rm \pi} } \right\rfloor \right) \right|. \end{equation}
This is evolved under the heat equation
 \begin{equation} \frac{\partial f_s^{(i)}}{\partial t}=\frac{1}{r^2}\frac{\partial ^2f_s^{(i)}}{\partial \theta^2}, \end{equation}
while being normalised to have constant term unity, until the maximum curvature of  $f_s$ does not exceed 10 dimensionless units. This is then taken to be the shape of the droplet $a(\theta )$. An expression for the evaporative flux is then sought in the approximate form
 \begin{align} J(r,\theta)&=\frac{2}{{\rm \pi} }\frac{a}{\sqrt{a^2-r^2}}\left\{1+\sum_{i=1}^{N_1}c_{ni} f_1(r;ni)\cos ni\theta+\sum_{i=1}^{N_2}c_{ni}^2f_{20}(r;ni)\right.\nonumber\\ &\quad \left.+ \sum_{i=1}^{N_3}c_{ni}^2f_{22}(r;ni)\cos 2ni\theta \right\}, \end{align}
where  $f_{1}$, $f_{21}$ and $f_{22}$ are given by (3.9), (3.10) and (3.11), respectively, and $N_1$, $N_2$ and $N_3$ are selected to minimise $e(0,n)+e({\rm \pi} /n,n)$. In all cases we find $N_2=N_3$, and the corresponding $N_1$ and $N_2$ for different polygons are given in table 2. Note that for higher polygons, the additional terms in the series are very small due to the decay of the Fourier coefficients, and we suggest taking $N_1=20$ and $N_2=10$ for good accuracy.
Suitable upper limits for the truncation of the Fourier series representations for the evaporative flux for smoothed polygonal droplets (5.3). In all cases  $N_3=N_2$.

We plot the corresponding fluxes for triangular and square droplets in figure 5 alongside numerical simulations of the full concentration problem (2.2)–(2.4). As with the monochromatic shapes, we see excellent agreement between the asymptotic and numerical results, even with the additional approximations discussed above. In particular, using the error metric defined in (3.14), we find
 $$\begin{gather} e(3,0)=9.6\times10^{{-}3}, \quad e(3,{\rm \pi} /3)=1.2\times10^{{-}2}; \end{gather}$$
 $$\begin{gather}e(4,0)=1.1\times10^{{-}2},\quad e(4,{\rm \pi} /4)=1.9\times10^{{-}2}, \end{gather}$$
indicating strong agreement. These excellent comparisons give us encouragement to utilise the asymptotic results in our considerations of the internal flow dynamics and solute transport.
(a,c) Asymptotic (dashed) and numerical (solid, black) contours of evaporative fluxes; (b,d) comparisons of asymptotic flux (solid curve) and numerical flux (dashed curve) for a smoothed triangular droplet (a,b) and a smoothed square droplet (c,d). In (a,c), the red curves represent the pinned contact line. The contact line shapes, and corresponding fluxes, are determined as described in § 5.1.

5.1.1. Internal flow dynamics of large droplets with regular polygonal footprints
For droplets with polychromatic footprints, we set  $N_2=N_3=0$ when modelling the internal flow dynamics so as to avoid the second-order complications. We shall see that this does not significantly diminish the resulting predictions. To this end, and following the model presented in § 4.1, we find
 \begin{equation} \frac{\mathrm{d} h}{\mathrm{d} t}\approx{-}{\rm \pi} /4, \end{equation}
and the liquid pressure has the expansion
 \begin{equation} Q(r,\theta)\approx Q_0(r)+\sum_{i=1}^N c_{ni}Q_1(r;ni)\cos ni\theta, \end{equation}
where  $Q_{0}$ and $Q_{1}$ are given by (4.19) and (4.20), respectively.
5.1.2. Residue from large droplets with regular polygonal footprints
Once we have determined the pressure, the streamlines terminating at the contact line at  $\theta = \theta _{a}$ satisfy
 \begin{equation} \psi(r) = \theta_a+\psi_1(r), \end{equation}
where
 \begin{equation} \frac{\mathrm{d} \psi_1}{\mathrm{d} r}=\frac{p_\theta}{r^2p_r}\approx \frac{1}{Q_0(r)} \sum_{i=1}^N ni\,c_{ni}Q_1(r;ni)\sin ni\theta, \end{equation}
which must be solved subject to
 \begin{equation} \psi_1|_{r=a}=0. \end{equation}
 In determining  $Q$ and $\psi$, we must first expand the evaporative flux in a Fourier series. However, when expanding
 \begin{equation} J(r,\theta)=\frac{2}{{\rm \pi} }\frac{a}{\sqrt{a^2-r^2}} \left\{1+\sum_{i=1}^{N}c_{ni} f_1(r;ni)\cos ni\theta \right\}, \end{equation}
there are two contributions involving  $\cos ni \theta$: one from expanding the $a$ terms in the leading coefficient, and one from that multiplying $f_1$. While both of these contribute to $Q_1$, in principle the two should be summed separately: the former up to $N=\infty$ and the latter up to $N=N_1$ (in accordance with table 2). However, it turns out that each separate contribution is substantially more complicated than using the two combined. This therefore suggests using two models: a ‘simple’ model where $N=N_1$, and an ‘extended’ model where $N=\infty$. We shall present solutions from both approaches in the sequel and discuss their accuracy and usefulness in reference to full numerical solutions.
Once the pressure and streamlines have been found, we may finally determine the deposit density using
 \begin{equation} D=\frac{1}{\sqrt{a^2+a_{\theta}^2}}\frac{\mathrm{d} M}{\mathrm{d} \theta_a}= \frac{1}{\sqrt{a^2+a_{\theta}^2}}\int_0^a r\frac{\partial \psi}{\partial \theta_a}\,\mathrm{d} r. \end{equation}
In order to facilitate our comparisons, we note that all solutions for the density may be expanded as Fourier series of the form
 \begin{equation} D=d_0+\sum_i d_i \cos ni\theta,\end{equation}
where the upper limit is chosen according to which model is used. We present asymptotic and numerical calculations of the first few coefficients of this series in table 3 for a number of different polygons. Both the simple and extended models are presented for the asymptotic results, while we give numerical results for both smoothed and sharp polygons. Throughout, we see that the asymptotic predictions do a remarkably good job of capturing the coefficients, particularly given that the expression for the evaporative flux was derived in the limit of nearly circular droplets. Finally, we note that, in practice it was found that a mean of the simple model and the extended model gave the best agreement with DNS; we term this the ‘averaged model’, and use it for the remaining comparisons.
Fourier coefficients in the expansion (5.13) for the residue density, according to numerical calculations for the smoothed polygon, the simple approximate model, the extended approximate model and numerical calculations for the sharp polygon. The contact line shapes, and corresponding fluxes, are determined as described in § 5.1. Notably, these coefficients only depend on the geometry of the contact line; there are no other parameters involved.

We give comparisons between the various models for triangles and squares in figure 6 and for pentagons and hexagons in figure 7. In each case, the mass accumulated between  $\theta =0$ and $\theta =2{\rm \pi} /n$ (i.e. for the first period) is plotted for the DNS for the sharp $n$-gon (solid line), the DNS for the smoothed $n$-gon (dashed line) and the averaged model (dotted line). In all cases the smoothed polygon DNS and the averaged model agree very well, essentially obscuring one another for $n\geq 4$. For $n=3$ there is a small deviation close to the corner of the droplet. In all cases the sharp polygon demonstrates a significantly sharper increase in mass close to the corner than for the smoothed polygon.
Comparison plots for triangles (a–d) and squares (e–f), showing (a,e) mass accumulation, with sharp polygon DNS as a solid curve, smoothed polygon DNS as a dashed curve and averaged asymptotic model as a dotted curve; (b,e) pressure (background colour), streamlines (solid curves) and contours of equal evaporative flux (dashed curves); (c,g) residue density according to the averaged asymptotic model; (d,h) the residue according to the smoothed DNS model. In order to aid visualisation of the residue density in (c), (d,g,h), we have plotted the one-dimensional density profile over a distance of 0.2 dimensionless units normally inwards from the contact line.

As in figure 6, for pentagons (a–d) and hexagons (e,f).

The second plot for each shape shows the pressure (coloured background), streamlines (solid line) and contours of evaporative flux (dashed lines). The pressure is highest at the centre and lowest at the corners, driving a flow that is predominantly radially outwards, and preferentially towards the corners, hence the resulting streamlines. As anticipated, the contours of the evaporative flux are approximately circular close to the centre, and better approximate the shape of the contact line further out, as the effects of geometry become more pronounced. This change in contour shape indicates the necessity of the corrective terms in (3.8), compared with the simplified approach of Fabrikant (Reference Fabrikant1986), for which the contours are all scaled versions of the contact line profile.
The final plots show predicted residue densities according to the averaged asymptotic model and the smoothed DNS model. In particular, to aid visualisation, the shape displayed is all points whose  $(x,y)$ coordinates are within $0.2$ dimensionless units of the contact line, and lie between $z=0$ and $z=D$. Again, the agreement is generally quite good, although the triangle and square models show some disagreement along the straight sides. Although the curvature is essentially zero here, the residue is still non-zero, indicating that the residue density is not solely due the curvature of the contact line.
Finally, we note an important detail about the streamlines. In these cases, the streamlines tend to converge towards the corners, as this is where the most liquid mass is being lost due to evaporation. This is in contrast to the case where the system is surface tension-dominated. For example, figure 3(e) of Sáenz et al. (Reference Sáenz, Wray, Che, Matar, Valluri, Kim and Sefiane2017) shows the streamlines diverging close to the corners. This is due to the effect of the interfacial height approaching zero there. We anticipate that, in our problem, similar behaviour would be observed in the small, capillarity-induced boundary layer near the contact line that is not resolved here, where our primary goal was to illustrate the usefulness of the solution for the evaporative flux given by (3.8) and (5.3) in a specific application. Unfortunately, this means that further analysis of this boundary layer would be necessary to facilitate comparisons with experimental results such as those in Sáenz et al. (Reference Sáenz, Wray, Che, Matar, Valluri, Kim and Sefiane2017) to the residues predicted here. However, with  $J(r,\theta )$ to hand, this is now something that can be readily addressed in future studies.
5.2. Droplets with other polygonal footprints
We finish by examining two further polygons. The first is a rectangle, selected as one of the simplest polygons which is not regular. The second is a five-pointed star, selected as a strongly non-convex polygon. Their evaporative fluxes and residues are given in figure 8.
(a,c) Asymptotic (dashed curves) and numerical (solid, black curves) contours of evaporative flux and (b,d) residues for (a,b) a rectangle and (c,d) a five-pointed star. The red curve denotes the pinned contact line of the droplet.

One interesting note is that, despite having the same curvature, the residue for the rectangle at  $\theta =0$ is higher than that at $\theta ={\rm \pi} /2$ by $30.6\,\%$ (for comparison, the contact line at $\theta =0$ is $47.4\,\%$ further away than at $\theta ={\rm \pi} /2$). It is noted that for higher aspect ratios, the agreement between asymptotic solutions and DNS became weaker, especially close to the origin. It is anticipated that this could be alleviated at least in part via the use of Galin's theorem (Sneddon Reference Sneddon1966).
We note that for the star, despite high levels of curvature and strong non-convexity, good agreement is still found for the contours of the evaporative flux, indicating that, at least for smoothed polygons, this method is quite robust. What is more, we actually have large areas of negative curvature here. As expected, the residue is very low in these areas.
Finally, we note that the contours close to the centre of the droplet are approximately circles for the five-pointed star, and ellipses for the rectangle. This is in stark contrast to the solution predicted by the leading-order solution of Fabrikant (Reference Fabrikant1986), which would predict star-like and rectangular contours all the way to the origin. Again, this highlights the necessity and accuracy of the corrections to the evaporative flux derived herein.
6. Conclusions
In the present work, we have examined the evaporation of thin, non-circular droplets in the diffusion-limited regime. The governing equations are a challenging non-rectilinear mixed boundary value potential problem, which has various analogues in other disciplines, including electro-/magnetostatics and contact mechanics. In this work, we have solved the mixed boundary value problem using a novel asymptotic approach. This has yielded an asymptotic expansion for the evaporative flux which is correct up to second order in the small size of the contact line perturbation (3.8) and is shown to be in excellent agreement with full numerical solutions of the mixed boundary value problem.
While the asymptotic solution is nominally valid only for droplets whose contact lines are small, monochromatic perturbations to circles, we have further shown that the solution can be used to determine the evaporative flux from droplets whose contact lines have large, polychromatic disturbances, including shapes such as (smoothed) regular polygons (§ 5.1), and even irregular and non-convex polygons (§ 5.2). Agreement between the asymptotic solution and full numerical solutions was again shown to be very good.
This allows for the analysis of numerous problems in the field of droplets that were previously inaccessible. This includes the classic ‘coffee stain’ or ‘coffee ring’ problem of determining the residue from a solute-laden droplet. In particular, we examine the most analytically tractable case, in which the droplet shape is dominated by gravity, yielding a quasi-static flat interface, and where the contact line is assumed to be pinned (§ 4). For small asymmetries in the contact line, we demonstrated the effects of one particular monochromatic perturbation by finding the final pattern of solute up to second order, which exhibits increased deposition at high-curvature parts of the contact line, in agreement with previous studies of the coffee ring effect (see, for example, Freed-Brown Reference Freed-Brown2015; Sáenz et al. Reference Sáenz, Wray, Che, Matar, Valluri, Kim and Sefiane2017; Moore et al. Reference Moore, Vella and Oliver2022). Such behaviour is accentuated even further in large polygonal droplets, which we demonstrated explicitly for a range of different cases, taking advantage of the aforementioned strong agreement between the asymptotic form of the evaporative flux and full numerical simulations.
While we have focused on the dynamics for droplets with a pinned contact line in this study for illustrative purposes, deposition in other modes of evaporation, such as constant angle, stick-slide or stick-jump modes remains an interesting open problem. Indeed, for many other modes, deposition has yet to be treated analytically even for a circular droplet, save in certain special cases (Freed-Brown Reference Freed-Brown2015). Nonetheless, these can be solved exactly, and the methodology herein could in future be applied to a non-circular droplet.
Notably, close to the contact line, the flow patterns seen inside the large gravity-dominated droplets studied herein are a significant departure from those seen in, for example, the surface tension-dominated droplets analysed by Sáenz et al. (Reference Sáenz, Wray, Che, Matar, Valluri, Kim and Sefiane2017). This is due to the fact that we have ignored the effects of capillarity. As discussed in § 4.3.3, even at large Bond number there is a small boundary layer in which capillarity is significant, and in which the interfacial height  $h$ goes to zero – a phenomenon which also of course occurs in surface tension-dominated droplets. This boundary layer will locally alter the streamlines so that they meet the contact line orthogonally as seen in the experiments of Sáenz et al. (Reference Sáenz, Wray, Che, Matar, Valluri, Kim and Sefiane2017). The surface tension-dominated droplet problem can only be treated analytically in certain special cases; it will form the focus of a forthcoming manuscript.
Finally, we reiterate that, while couched in the context of evaporating droplets here, the fundamental result in this paper is in fact a generic result in potential theory. As a consequence, this work will find applications in numerous fields such as elasticity, thermodynamics, contact mechanics and electrostatics, among many others; some of the corresponding problems in these areas are planned as a follow up to this work.
Declaration of interests
The authors report no conflict of interest.
Appendix A. Numerical methods
A.1. Evaporative flux
Numerical evaporative fluxes were determined by solving (2.2)–(2.4) using COMSOL multiphysics. Under the thin assumption, the droplet was implemented as a two-dimensional surface of the appropriate shape, on which the Dirichlet condition (2.3) was imposed, while extending the problem symmetrically to  $z<0$ guarantees that the Neumann condition on the non-wetted part of the substrate is satisfied automatically. The far-field behaviour (2.4) was imposed by implementing a Dirichlet condition on a large sphere centred at the origin of dimensionless radius $R_{{sph}}\gg 1$. Extensive testing showed that the results were insensitive to the choice of sufficiently large $R_{{sph}}$; we take $R_{{sph}} = 500$ in all our simulations.
A.2. Liquid pressure
Solving the thin-film equation (4.9) subject to (4.10) for the liquid pressure is an under-constrained problem due to the Neumann boundary condition. While this can be resolved in theory via an additional integral constraint, in practice it was easier to use the method of false transients (Mallinson & de Vahl Davis Reference Mallinson and de Vahl Davis1973). This was implemented in both COMSOL and Mathematica for verification, with solutions for all droplets presented in this paper being in excellent agreement.
For the final steps of using the numerical pressure solution to compute masses and corresponding densities, we integrated between suitable streamlines directly in Mathematica.


 Open access