

Vitamin D is required for skeletal health and Ca homeostasis. Increasing evidence suggests a role for vitamin D in other aspects of health and disease prevention(Reference Holick1, Reference Prentice2). Biomarkers link health or disease outcomes to nutrient intake or supply and provide a means to assess nutrient status at the individual or population level(Reference Holick1–Reference Prentice, Goldberg and Schoenmakers3). The most frequently used biomarker of vitamin D status is the serum or plasma concentration of 25-hydroxyvitamin D (25(OH)D). It is not under tight homeostatic control and reflects vitamin D supply from cutaneous synthesis and diet and usage, metabolism, excretion and sequestration into body tissues(Reference Prentice, Goldberg and Schoenmakers3, Reference Seamans and Cashman4). There is considerable debate over the level of 25(OH)D that represents optimal vitamin D status. New tools and biomarkers are needed to link vitamin D supply to tissue requirements and vitamin D metabolism(Reference Brannon, Yetley and Bailey5, Reference Brannon, Yetley and Bailey6). We have proposed the plasma half-life of 25(OH)D as a dynamic marker of vitamin D usage that may be used to assess physiological requirements and to investigate physiological, environmental and genetic influences on vitamin D metabolism(Reference Prentice, Goldberg and Schoenmakers3). The aim is to develop a tracer method for field use in all population groups.
Previous studies have measured 25(OH)D absorption or half-life in human subjects and animals using unlabelled or radiolabelled compounds, but they have limitations. The major disadvantage of unlabelled vitamin D metabolites is that the plasma response cannot be distinguished from endogenous vitamin D metabolites or vitamin D obtained from the diet or cutaneous synthesis during the course of the experiment. As a result, large doses are required that may disturb habitual vitamin D, Ca and P metabolism. The use of radiolabelled compounds is restricted to healthy adults or specific groups of patients and is not suitable for use in vulnerable groups.
Half-life is calculated from the terminal slope of the plasma disappearance curve. After an intravenous or oral bolus dose, there is typically a rapid and transient increase in plasma concentration, followed by a relatively rapid decrease and finally a gradual decline when equilibrium between body pools is assumed. The terminal slope is determined by metabolism to downstream metabolites (including 1,25(OH)2D and 24,25(OH)2D) and catabolic pathways. The relatively long half-life for 25(OH)D3 (10–40 d)(Reference Mawer, Schaefer and Lumb7–Reference Vicchio, Yergey and O'Brien12) is in part determined by the molar excess of vitamin D-binding protein (DBP) and strong binding affinity to DBP that protects 25(OH)D from degradation and provides a circulating store of vitamin D. Vitamin D metabolites with lower binding affinities for DBP have shorter half-lives(Reference Laing, Cooke, Feldman, Pike and Glorieux13, Reference Hollis14). A number of experimental factors may affect the usefulness of methods to determine half-life, including specificity of measurement, size of the tracer dose, rapid mixing with endogenous pool and correctly defined terminal slope. In some studies, the 25(OH)D3 half-life may have been calculated on the basis of data that included time points that represented not only the terminal slope but also the distribution phase(Reference Vicchio, Yergey and O'Brien12), and therefore a faster half-life might have been predicted. In studies where total plasma radioactivity was measured, all vitamin D metabolites were quantified and the presence of shorter- or longer-lived metabolites may have affected the half-life(Reference Batchelor and Compston11, Reference Gray, Caldas and Wilz15). In other studies, tracer molecules were used with labelled atoms in metabolically active positions that can affect 25(OH)D and/or 1,25(OH)2D metabolism in vitro and in vivo (Reference Tanaka and DeLuca16, Reference Halloran, Bikle and Castro17).
Alternatives to radiolabelled tracers are to use either stable isotope or other suitable tracers with similar metabolism, together with modern mass spectrometric methods. Here, we report the use of 25(OH)D2 as a tracer, together with a sensitive liquid chromatography (LC)-tandem MS method(Reference Ding, Schoenmakers and Jones18), in a pilot study to investigate vitamin D metabolism. We aimed to characterise the absorption, distribution and terminal slope of the plasma response to an oral dose of 25(OH)D2, a readily available and cost-effective tracer. In addition, the effect of the dose on vitamin D, Ca and P metabolism was evaluated. The study was performed at MRC Keneba, a field station in rural Gambia at latitude 13°N, where there is no or only limited seasonality in vitamin D status due to the year-round UVB exposure from the sun(Reference Prentice, Schoenmakers and Jones19), and thus subjects are expected to be in a steady state for vitamin D status for the duration of the study. Furthermore, the dietary intake of vitamin D2 was expected to be absent or very low in this population. We used 25(OH)D2 rather than the parent compound, vitamin D2, in order to minimise inter-individual differences in absorption, tissue distribution and hydroxylation.
Methods
Subjects
The subjects were twelve healthy males, aged between 18 and 23 years (mean 19·8 years) and with a weight of 56·5 (sd 6·5) kg and BMI of 19·1 (sd 1·7) kg/m2. The study was conducted according to the guidelines laid down in the Declaration of Helsinki and all procedures involving the subjects were approved by the joint Gambian Government-Medical Research Council's ethics committee. Trained fieldworkers explained the study to the subjects in their native language and informed written consent was obtained. Exclusion criteria were recent illness (within last week), a broken bone within the last 3 years, known bone, kidney or liver disease, taking any prescription medicines or a Hb less than 100 g/l. Fieldwork was performed during March and April 2009.
Dose preparation
25(OH)D2 (product number: 17 937; purity ≥ 98 %; Sigma-Aldrich, Poole, UK) was weighed and dissolved in olive oil. The solution was protected from light and mixed on a rotary mixer at room temperature. Aliquots were frozen at − 20°C and were used within 2 weeks of preparation. Each dose consisted of 80 nmol (33 μg) 25(OH)D2 in 810 μl olive oil.
Study protocols
The volunteers were divided into two groups, the ‘absorption’ group (n 6) and the ‘half-life’ group (n 6), with different sample timings but otherwise identical protocols. The size of the dose and sampling protocols were chosen based on data from the few previous estimates of absorption, kinetics and turnover that used unlabelled and radiolabelled compounds in human subjects and animals, combined with compartmental modelling(Reference Gray, Weber and Dominguez9–Reference Batchelor and Compston11, Reference Sitrin and Bengoa20–Reference Hidiroglou23). Biochemical markers of vitamin D, Ca and P metabolism and liver and kidney function were measured in fasting blood and urine samples collected at baseline (day 0) and on day 15 after the dose. After voiding of the first morning urine, a 2 h fasting urine was collected from approximately 07.00 hours. The subject was asked to drink 500 ml of water at both 30 min and 1·5 h in the 2 h period (total water intake, 1000 ml). Blood was collected 1 h into the urine collection. On day 1 (within 5 d of the baseline sample), the 25(OH)D2 dose was administered in the morning at approximately 07.30 hours after an overnight fast. The dose was removed from the freezer, protected from light and brought to room temperature on a rotary mixer. Each dose was pipetted onto a small piece of local white bread. The volunteer ate the bread under supervision followed by a standardised meal of bread with mayonnaise (Armanti brand; NGM International Ltd, Rotterdam, The Netherlands). Water was provided ad libitum. Subjects were supervised for 5 h following the dose and were allowed to sit or move about freely within the field station but were asked to refrain from lying down or exercise during this period to minimise the influence of gastric emptying. After 5 h, a meal was provided. Blood samples in the first group were collected from an in-dwelling cannula inserted into a forearm or by venepuncture directly before and every 2 h after administration of the dose for a total of 12 h. After the blood sample at 12 h, a meal was provided and the volunteer was free to leave. Further fasting blood samples were collected after 24 and 48 h and on day 15 following the dose. For individuals in the second group, fasting blood samples were collected by venepuncture at approximately 08.00 hours on day 3 (corresponding to the 48 h sample in the absorption group), 4, 5, 6, 9, 12, 18 and 21.
Sample collections and laboratory analyses
Blood samples were collected into tubes containing EDTA or lithium heparin (S-Monovettes; Sarstedt Limited, Leicester, UK) and immediately placed on ice. Lithium-heparin blood samples for the measurement of ionised Ca (iCa) were measured within two minutes of collection using an ABL77 blood gas analyser (Radiometer, Brønshøj, Denmark) and the remaining samples were placed on ice. Corrected iCa values at pH 7·4 were used. Plasma was separated within 30 min of collection in a refrigerated centrifuge at 1800 g for 20 min, and stored at − 70°C. Collected urine was mixed thoroughly, and non-acidified and acidified (HCl, 10 ml/l, laboratory reagent grade, SG 1.18, Fisher Scientific, Loughborough, UK) aliquots were taken and stored at − 20°C. After completion of the study, samples were packed and shipped on dry ice to MRC Human Nutrition Research, Cambridge for analysis. All assays were performed in duplicate with the exception of parathyroid hormone (PTH). Total Ca, P, Cr, total alkaline phosphatase, albumin and cystatin C were measured in heparinised plasma using colorimetric methods on the Kone Lab 20i clinical chemistry analyser platform (Kone, Espoo, Finland). On the same platform, urinary Ca (uCa), phosphate (uP) and creatinine (uCr) were measured in acidified urine. Within- and between-assay CV for all Kone assays were < 2 and < 4 %, respectively. Concentrations of uCa and uP are expressed as a ratio relative to uCr to adjust for urine volume. EDTA plasma was used for the analysis of PTH by immunoassay (Immulite; Siemens Healthcare Diagnostics Limited, Camberley, UK). Between-assay CV was 4·7 %. Total plasma 1,25(OH)2D was measured with a RIA (IDS Limited, Tyne and Wear, UK). Within- and between-assay CV were 7·5 and 9·0 %. Cross-reactivity of the assay was 100 and 91 % for 1,25(OH)2D3 and 1,25(OH)2D2, respectively. Assay performance was monitored using kit and in-house controls and under strict standardisation according to ISO 9001:2000. Quality assurance of 25(OH)D, 1,25(OH)D and PTH assays was performed as part of the Vitamin D External Quality Assessment Scheme (www.deqas.org) and the National External Quality Assessment Scheme (www.ukneqas.org.uk), and was within the accepted limits.
MS
25(OH)D2 and 25(OH)D3 were measured using ultra-performance LC-tandem MS(Reference Ding, Schoenmakers and Jones18). In brief, plasma proteins were precipitated with acetonitrile, dried and then reconstituted in deionised water, subjected to solid-phase extraction and, again, dried. The samples were then derivatised with 50 μl 4-phenyl-1,2,4-triazoline-3,5-dione (0·5 mg/ml) solution in acetonitrile. Then, 10 μl were injected into the ultra-performance LC system (Waters, Elstree, Herts, UK) consisting of Acquity UPLC BEH C18 1·7 μm, 2·1 × 50 mm columns (Waters) and a mobile-phase gradient of 0·1 % formic acid and 5 mm-methylamine in water and 0·1 % formic acid in methanol. For MS/MS analysis, a QTRAP triple quadrupole linear ion trap system (MDS Analytical Technologies, Concord, Canada) was operated in the electrospray ionisation positive ion multiple reaction monitoring mode. d6-25(OH)D2 and d6-25(OH)D3 were used as stable isotope-labelled internal standards (Chemaphor Limited, Ottawa, Canada). Ion transitions monitored were 619 m/z → 298 m/z for 25(OH)D2, 625 m/z → 298 m/z for d6-25(OH)D2, 607 m/z → 298 m/z for 25(OH)D3 and 613 m/z → 298 m/z for d6-25(OH)D3. Intra- and inter-day CV were 1·6 and 3·7 % for 25(OH)D2 and 3·8 and 5·8 % for 25(OH)D3(Reference Ding, Schoenmakers and Jones18). The CV of duplicate measurements of the samples in the present study was less than 3 % for both 25(OH)D2 and 25(OH)D3.
Data handling
Data modelling and statistics were performed in Microsoft Excel 2003 (Microsoft Corporation, Seattle, WA, USA) and Data Desk 6.0 (Data Description, Ithaca, NY, USA). Within- and between-group differences were analysed with paired and unpaired t tests, respectively.
In order to describe the absorption and initial distribution of 25(OH)D2, we used the following equation:
where q A is the amount of 25(OH)D2 in a single compartment, F is the input constant, k A is the fractional rate constant of loss and T is the duration of the input. This model assumes a single compartment, a constant input of the 25(OH)D2 dose and first-order disappearance. Initial estimates of the model parameters were then subsequently adjusted with the Solver function in Excel to minimise the differences between the modelled (predicted) and observed data. The absorption parameter T is equivalent to T max (the time taken to reach the maximum plasma concentration, C max). C max was calculated from the absorption parameters F, T and k A using the following equation:
Plasma 25(OH)D2 half-life was calculated from the following equation:
From visual inspection of the logarithmically transformed curves, k B (the slope of terminal disappearance)(Reference Shipley and Clark24) was identified to commence from day 6. k B was then derived from data obtained between days 6 and 21 and was calculated from the slope of the line of best-fit of the natural logarithm of 25(OH)D2 concentration against time.
Results
Biochemical markers of vitamin D, calcium and phosphate metabolism
There were no significant differences in any of the subjects or biochemical parameters between the groups at day 0 or 15, thus the groups were combined for further analysis of biochemical parameters (Table 1). There were no significant changes in plasma iCa, total Ca, P, PTH and 1,25(OH)2D, or uCa/uCr and uP/uCr between days 0 and 15 (Table 1). A significant decrease was observed in total alkaline phosphatase (P = 0·012) and a significant increase in plasma creatinine (P = 0·047), but not in cystatin C. However, all values for kidney and liver function were within the normal clinical range and changes were small and clinically insignificant. No biochemical abnormalities were detected and values were comparable with other data obtained from this age group and population(Reference Schoenmakers, Ginty and Jarjou25). Total 25(OH)D was calculated as the sum of 25(OH)D2 and 25(OH)D3 plasma concentrations. There was no significant difference in total 25(OH)D or 25(OH)D3. The plasma concentration of 25(OH)D2 increased significantly from 1·1 (sd 0·5) at day 0 to 3·1 (sd 0·2) nmol/l at day 15 (P>0·0001). During the study, there were no reports of side effects or sickness.
(Mean values and standard deviations, n 12)

25(OH)D, 25-hydroxyvitamin D; 1,25(OH)2D, 1,25-dihydroxyvitamin D; PTH, parathyroid hormone; iCa, ionised calcium; TALP, total alkaline phosphatase; uCr, urinary creatinine.
† There were no significant differences between the absorption group (n 6) and the half-life group (n 6) in any of the subjects or biochemical characteristics.
‡ Mean values were significantly different from baseline values (day 0): *P ≤ 0·0001; **P = 0·047; ***P < 0·05 (paired t test).
§ Corrected value at pH 7·4.
Absorption, distribution and terminal slope of 25-hydroxyvitamin D2
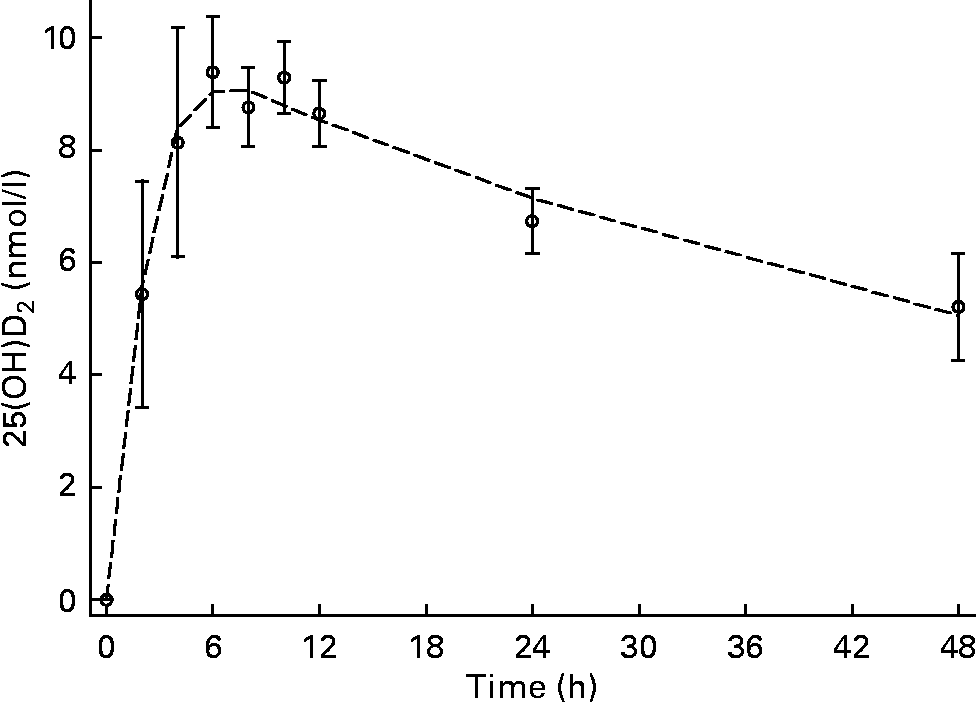
Low but detectable concentrations of 25(OH)D2 were observed in all subjects and time points; therefore, all subsequent concentrations used for data modelling and half-life calculations were corrected for baseline 25(OH)D2. C max was 9·6 (sd 0·9) nmol/l and was observed at T max, 4·4 (sd 1·8) h (Figs. 1 and 2). The input constant, F, was 2·6 nmol/h. The initial disappearance rate constant (k A) calculated from the peak of the absorption curve and using the remaining data points after T max until 48 h was 0·36 (sd 0·14). Individual plasma response curves are plotted in Fig. 2 and highlight the consistent pattern between individuals. For the second group sampled between days 3 and 21, values are plotted on a semi-logarithmic scale. From a visual inspection of 25(OH)D2 concentration against time (Figs. 3 and 4), a linear relationship was observed from day 6 onwards. The plasma concentration of 25(OH)D2 (baseline subtracted) decreased from 3·4 nmol/l at day 6 to 1·5 nmol/l at day 21. This terminal disappearance phase (k B) between days 6 and 21 had a slope of 0·05 (sd 0·01). The mean half-life as calculated from individual slopes was 13·4 (sd 2·7) d. Individual plasma curves (Fig. 4) highlight again the consistent pattern between individuals and clearly show that by day 6, 25(OH)D2 disappearance was in the terminal phase in all subjects.
Plasma appearance and disappearance over 48 h after an oral dose of 25-hydroxyvitamin D2 (25(OH)D2) in the absorption group. Values are means (n 6), with standard deviations represented by vertical bars, and the mean modelled plasma concentration represented by a dashed line (n 6).
Plasma appearance and disappearance over 48 h after an oral dose of 25-hydroxyvitamin D2 (25(OH)D2) in six subjects (A–F) in the absorption group. ○, Observed plasma concentration of 25(OH)D2; —, modelled plasma curve.

Semi-logarithmic plot of plasma concentration between days 3 and 21 after an oral dose of 25-hydroxyvitamin D2 (25(OH)D2) in the half-life group (n 6). Values are means, with standard deviations represented by vertical bars, and the terminal slope (0·05 (sd 0·01)) calculated from day 6 onwards represented by a dashed line.

Semi-logarithmic plot of plasma disappearance from days 3 to 21 after an oral dose of 25-hydroxyvitamin D2 (25(OH)D2) in six subjects (H–M) in the half-life group. ○, Observed plasma concentration of 25(OH)D2; —, line of best fit between days 6 and 21.

We explored relationships between C max, T max and half-life and selected physiological and biochemical parameters. A significant positive correlation was found between C max and BMI (r 0·87; P = 0·02) but not with height (r 0·03; P = 0·96) and weight (r 0·73; P = 0·10). There was no association between either T max or C max and baseline 25(OH)D3 plasma concentration. There were no significant relationships between half-life and measures of plasma iCa, total Ca, P, PTH, 1,25(OH)D or 25(OH)D3 at day 15.
Discussion
The half-life of 25(OH)D may provide a useful biomarker to investigate vitamin D requirements. In the present pilot study, we characterised the absorption, distribution and terminal disappearance of 25(OH)D2 as a tracer to investigate vitamin D metabolism and to obtain baseline data for future studies. The protocol was feasible under field conditions and was well accepted by the subjects. The absorption parameters obtained in the present study indicated that the dose was consistently well absorbed. The data showed that the terminal slope commenced at day 6. The increase in the plasma concentration of 25(OH)D2 at the commencement of the terminal slope was 3·4 nmol/l, approximately 6 % of the total plasma concentration of 25(OH)D. This, together with the lack of evidence of significant changes in Ca, P or vitamin D metabolism, demonstrates that there was no perturbation of the steady state.
The absorption and half-life of 25(OH)D3 in healthy individuals have been measured in a number of studies (summarised in Tables 2 and 3). Absorption studies frequently used very large unlabelled doses that may have perturbed normal vitamin D metabolism (Table 2). Studies reporting 25(OH)D3 half-lives using unlabelled, radiolabelled and stable isotope-labelled compounds after oral or intravenous administration have reported widely different values (Table 3). Nevertheless, within-study comparisons demonstrated differences in 25(OH)D3 half-life between controls and anephrics(Reference Gray, Weber and Dominguez9) and between individuals on either a high- or normal-fibre diet(Reference Batchelor and Compston11). The wide variation between methods may have been caused by methodological differences and limitations in the experimental design or quantification techniques, such as an improperly defined terminal slope or measurement of total radioactivity.
(Mean values and standard deviations or standard errors)

NR, not reported.
* To convert nmol/l to μg/l, multiply by 0·400 for 25(OH)D3 and 0·412 for 25(OH)D2.
† sd 1·8 h.
‡ sd 0·9 nmol/l.
§ sd 33 nmol/l.
∥ se 0·5 h/l.
¶ se 0·9 nmol/l.
(Mean values and standard deviations or standard errors)

i.v., intravenous; LC, liquid chromatography; NR, not reported; RA, radioactivity.
* Values are expressed as standard errors.
† Pre- and post- background subtraction of 25(OH)D.
There are advantages to using oral 25(OH)D3 rather than vitamin D3 to measure 25(OH)D3 half-life that are based on a number of factors which relate to differences in absorption, tissue distribution and hepatic metabolism(Reference Davies, Mawer and Krawitt21, Reference Krawitt and Chastenay26–Reference Mawer, Backhouse and Holman29). In view of the similarities in the absorption and distribution of vitamin D2 and vitamin D3(Reference Armas, Hollis and Heaney30–Reference Thacher, Obadofin and O'Brien32), these advantages may also apply to 25(OH)D2. Absorption of 25(OH)D3 is greater, faster and more consistent than that of vitamin D3(Reference Ovesen, Brot and Jakobsen33). Net absorption of vitamin D3 in healthy human subjects has been reported to be between 55 and 99 % of the dose(Reference Davies, Mawer and Krawitt21, Reference Thompson, Lewis and Booth34), whereas 25(OH)D3 absorption ranged from 88 to 100 % in healthy subjects. This may be related to the difference in absorption mechanism, i.e. for vitamin D3, this is primarily into the enterocytes and the lymph system whereas the primary route for 25(OH)D3 absorption is via the portal vein(Reference Maislos, Silver and Fainaru35, Reference Sitrin, Pollack and Bolt36), although another study has suggested that the absorption mechanism is the same for vitamin D and 25(OH)D(Reference Dueland, Pedersen and Helgerud37). Differences in the principal absorption mechanism are also supported by evidence from studies in patients with various gastrointestinal disorders affecting chylomicron formation, in which absorption of vitamin D is affected to a greater extent than 25(OH)D(Reference Sitrin and Bengoa20, Reference Davies, Mawer and Krawitt21, Reference Krawitt and Chastenay26). Vitamin D metabolites in the circulation are predominantly bound to DBP; however, a proportion of an oral dose, particularly for the less-polar vitamin D, will initially be associated with chylomicrons that may further influence initial metabolism and sequestration into body tissues. Therefore, in terms of delivering the maximum and most consistent plasma response from a minimum tracer dose, 25(OH)D is more effective than vitamin D.
For the determination of 25(OH)D half-life, the use of a tracer or labelled 25(OH)D rather than tracer or labelled precursor (i.e. vitamin D) is also likely to reduce variability because factors are removed that will influence the rate of appearance of 25(OH)D in the circulation. The appearance of 25(OH)D after a bolus dose of vitamin D is determined by the rate and extent of hepatic hydroxylation and sequestration and release of vitamin D from body stores. Little is known about the relationship between the serum concentration of vitamin D and its tissue distribution. Appreciable amounts of vitamin D may be taken up by tissues (principally adipose tissue) and this may be influenced by the plasma concentration of 25(OH)D and saturation of the 25-hydroxylase enzyme(Reference Heaney, Horst and Cullen38). The majority of 25(OH)D is found in plasma, with smaller amounts in fat and fat-free mass(Reference Mawer, Backhouse and Holman29, Reference Heaney, Horst and Cullen38). The potential slow release of tracer vitamin D from body stores and the consequent further and additional hepatic production of labelled 25(OH)D into the circulation would cause fluctuations in labelled 25(OH)D concentration and may distort the 25(OH)D half-life. The use of tracer 25(OH)D prevents the continued production of labelled 25(OH)D from labelled vitamin D and allows the establishment of faster equilibrium between body pools. In some earlier studies, increased variability may have been caused by measurement of total radioactivity that included the vitamin D3 dose and all downstream metabolites (predominantly 25(OH)D3, 1,25(OH)2D3 and 24,25(OH)2D3), and therefore affected the accuracy of the calculated half-life. However, it was reported that between 4 and 40 d after a dose of vitamin D3 or 25(OH)D3, more than 80 % of radioactivity is associated with 25(OH)D3. Up to 5 % remains associated with vitamin D3 and up to 10 % with more polar metabolites(Reference Smith and Goodman8, Reference Gray, Weber and Dominguez9). Modern LC-MS/MS, as used in the present study, enhances the measurement specificity.
In the present study, as expected, the oral dose increased 25(OH)D2 concentrations (Figs. 1 and 2). C max was 9·6 (sd 0·9) nmol/l and occurred at T max, 4·4 (sd 1·8) h. These data support the notion of rapid and efficient absorption in the upper gastrointestinal tract. The results of absorption parameters C max and T max from the present study are similar to those previously observed for 25(OH)D3 (Table 2). This observation is consistent with comparisons of vitamin D2 and vitamin D3 absorption where no differences have been observed in the initial plasma response after oral doses(Reference Armas, Hollis and Heaney30–Reference Thacher, Obadofin and O'Brien32, Reference Trang, Cole and Rubin39). The small standard deviations in the absorption parameters demonstrate limited variation in absorption between individuals and in comparison with previous 25(OH)D3 absorption studies (Table 2). Although the analysis was restricted to six subjects, we observed a significant positive correlation between C max and BMI and a similar but not significant correlation between C max and weight. However, a negative correlation with fat-free mass (and potentially fat mass) may be expected because of the potentially larger dilution volume and/or tissue absorptive capacity in subjects with more fat-free mass or fat mass. Although we did not measure body composition in the present study, the body habitus of the study subjects is consistent with that measured previously in this population with relatively little fat mass(Reference Davies40).
We identified the terminal phase to commence from day 6 (Figs. 3 and 4) and the terminal plasma half-life of 25(OH)D2 was determined to be 13·4 (sd 2·7) d (range 9·6–17·3 d). This is somewhat less than half-lives reported earlier in healthy individuals after doses of radiolabelled vitamin D3 or 25(OH)D3 (Table 3), which ranged from 10 to 40 d. The only study that used a stable isotope-labelled compound has reported a value of 10·4 d(Reference Vicchio, Yergey and O'Brien12). Half-life was not associated with the underlying plasma concentration of 25(OH)D3 and may not be surprising given the relatively narrow range of concentrations (range 38·4–69·0 nmol/l). This observation is consistent with some studies(Reference Batchelor, Watson and Compston41, Reference Davies, Heys and Selby42) but not with others(Reference Mawer, Schaefer and Lumb7, Reference Hidiroglou and Karpinski43), and is an area that requires further investigation. The short half-life in the present study may be due to differences in half-life between 25(OH)D2 and 25(OH)D3, the study population or the experimental approach between the present and other studies (Table 3). Evidence from studies using unlabelled compounds suggests that 25(OH)D2 is cleared more rapidly from plasma than 25(OH)D3(Reference Armas, Hollis and Heaney30, Reference Romagnoli, Mascia and Cipriani31, Reference Trang, Cole and Rubin39), and this is thought to be due to their relative binding affinities for DBP(Reference Laing, Cooke, Feldman, Pike and Glorieux13, Reference Hollis14, Reference Nilsson, Ostberg and Peterson44). Alternatively, correction for 25(OH)D2 concentration at baseline and subsequent inconsistent intake during the study period may have introduced variability in plasma concentrations of 25(OH)D2. In the absorption phase, fluctuation in 25(OH)D2 plasma concentration is likely to have had only a very minor effect because of the higher concentration from the dose and shorter time period. However, fluctuations in vitamin D2 intake may have contributed more significantly to variability in 25(OH)D2 half-life because of the lower concentrations during the terminal slope. In addition, the unexpected baseline levels of 25(OH)D2 and subsequent subtraction may have introduced additional error in the determination of half-life. This population in rural Gambia is known to have a low dietary Ca intake (300–400 mg/d)(Reference Schoenmakers, Ginty and Jarjou25, Reference Yan, Schoenmakers and Zhou45), a high fibre intake and elevated 1,25(OH)2D and secondary hyperparathyroidism(Reference Schoenmakers, Ginty and Jarjou25), and are consistent with the findings of the present study. All these factors are known to increase 25(OH)D turnover(Reference Batchelor and Compston11, Reference Clements, Davies and Hayes46, Reference Clements, Johnson and Fraser47). Furthermore, longitudinal bone growth and bone mineral accrual still occurs in Gambian men of this age(Reference Lo, Jarjou, Poppitt, Christiansen and Overgaard48), thus their tissue requirement for Ca and vitamin D may be higher than an older age group(Reference Prentice, Ward, Schoenmakers, Anderson, Garner and Klemmer49–Reference Krabbe, Transbol and Christiansen51). Total 25(OH)D was calculated as the sum of 25(OH)D2 and 25(OH)D3 concentrations as measured by LC-MS/MS. In the present study, the mean baseline total 25(OH)D plasma concentration was about 55 nmol/l. Notwithstanding known assay differences(Reference Binkley, Krueger and Cowgill52, Reference Roth, Schmidt-Gayk and Weber53), this value is somewhat lower than previous measurements in this and other age groups in The Gambia(Reference Schoenmakers, Ginty and Jarjou25) and Guinea-Bissau(Reference Wejse, Olesen and Rabna54), and may be surprising given the year-round ability for cutaneous vitamin D production and plentiful sunshine(Reference Prentice, Schoenmakers and Jones19). The relatively low values could be attributable to a number of causes as discussed above (i.e. skeletal development and low Ca intake).
Plasma 25(OH)D3, total 1,25(OH)2D, PTH, Ca, iCa and P and uCa and uP did not change from baseline, indicating that the tracer did not perturb Ca, P and vitamin D metabolism. This contrasts with another study in which a much higher dose (1 mg) resulted in elevated uCa and hydroxyproline but without changes in plasma values of Ca or P(Reference Haddad and Rojanasathit10). This indicates alterations of Ca and bone metabolism and the resultant half-life may therefore not be reflective of habitual vitamin D turnover(Reference Haddad and Rojanasathit10).
25(OH)D2 can only be used as a tracer in a population with absent or very low 25(OH)D2 plasma concentration, or after a period of weeks or months of vitamin D2 depletion, and thus its use may be not be suitable in all populations, although recent evidence suggests that circulating plasma levels in the UK are similar to those observed in the present study (H. Macdonald, personal communication). This study was performed in a rural Gambian village where vitamin D2 intake was not expected. This was supported by recent work from Guinea-Bissau in which 25(OH)D2 measured by LC/MS was detected in only seven out of 856 subjects(Reference Wejse, Olesen and Rabna54). Surprisingly, however, low but detectable concentrations of 25(OH)D2 (ranging from 0·6 to 2·5 nmol/l) were found in all baseline samples from all subjects. An explanation for this observation may be the non-listing of vitamin D2 as an additive to products available in local shops (such as margarine, milk powder or mayonnaise), the availability of other fortified food through food aid programmes or, alternatively, ingestion from plant- or fungi-derived vitamin D2 from sun-drying and/or fungal contamination of food crops. The presence of vitamin D2 has been demonstrated in sun-dried alfalfa at a concentration of 48 ng/g(Reference Horst, Reinhardt and Russel55). An alternative explanation is an interfering compound co-extracted with the vitamin D metabolites. However, given the specificity of the tandem MS method, this seems unlikely since such an interfering compound would have the same retention times and the same precursor and product ions.
There are some differences in the metabolism of 25(OH)D2 and 25(OH)D3 that may limit the comparability of the measured half-lives of the two forms. Affinities of 25(OH)D2 and 25(OH)D3 to DBP are not the same and may affect plasma half-life(Reference Hollis14, Reference Nilsson, Ostberg and Peterson44). It is also possible that differences in distribution, either independent of or related to the affinity to DBP, may result in additional differences in clearance. At a molecular level, there are differences in the affinity of CYP24A1, being lower for 1,25(OH)2D2 than for 1,25(OH)2D3(Reference Urushino, Yasuda and Ikushiro56). However, 25(OH)D2 and 25(OH)D3 are metabolised at similar rates by CYP27B1(Reference Jones, Helvig and Petkovich57, Reference Tang, Voo and Nguyen58) and CYP24A1 enzymes(Reference Jones, Helvig and Petkovich57), although differences in the hydroxylation products and downstream metabolites of vitamin D2 and vitamin D3 may exist(Reference Horst, Reinhardt, Satyanarayana Reddy, Feldman, Pike and Glorieux59, Reference Mawer, Jones and Davies60). At the physiological level, however, the majority of evidence suggests no difference in the suppressive effect of 25(OH)D2 and 25(OH)D3 on PTH(Reference Romagnoli, Mascia and Cipriani31, Reference Thacher, Obadofin and O'Brien32, Reference Biancuzzo, Young and Bibuld61–Reference Khazai, Judd and Jeng64).
In conclusion, unlabelled 25(OH)D2, together with sensitive MS, provide a cost-effective and readily available alternative to labelled tracer molecules in populations with expected low or absent plasma 25(OH)D2 but further studies are required to directly compare the metabolism and half-life of 25(OH)D2 and 25(OH)D3 to validate the use of 25(OH)D2. The data from the present study will help refine a field protocol to measure 25(OH)D2 half-life and, given the similarity in absorption between 25(OH)D2 and 25(OH)D3, will underpin the development of a protocol to determine 25(OH)D3 half-life suitable for use in adults and children. In populations with higher Ca intake and therefore lower vitamin D usage, a longer half-life might be expected. Additional studies are required to optimise the duration of sample collection to estimate half-life in different populations. 25(OH)D half-life may be useful as a biomarker of vitamin D metabolism to investigate environmental or physiological factors that may affect vitamin D usage and to better assess vitamin D requirements.
Acknowledgements
This study was funded by the Medical Research Council (MRC), UK. We would like to acknowledge the field and support staff of MRC Keneba field station, in particular Mustapha Sise, Buba Sise and Fabakary Bajo. We also acknowledge Shailja Nigdikar, Janet Bennett and Ann Laidlaw who performed the biochemistry analyses. None of the authors had a personal or financial conflict of interest. K. S. J., I. S., L. J. C. B and A. P. designed the research; K. S. J. conducted the research; S. D. performed the MS; K. S. J., I. S. and L. J. C. B. analysed the data; K. S. J. wrote the manuscript; K. S. J., I. S. and A. P. had primary responsibility for the final content. All authors read and approved the final manuscript.


 Open access