





I. INTRODUCTION
Multifunctional materials are necessarily composite materials, and the strong growth in the use of composites has been greatly influenced by multifunctional design requirements. Carbon nanotubes (CNT) have attracted much attention since their discovery in 1991 due to their unique mechanical and electronic properties. Reference Iijima1 Addition of carbon nanotube enhances the properties of polymer even at very low concentrations due to their large aspect ratio and ultra-high conductivity. Reference Sobha and Narayanankutty2 These CNT based polymer composites have potential uses in many fields, such as strain sensors, damping augmentation, super capacitors, electromagnetic radiation shield coatings, and actuators. Reference Xu and Allen3–Reference Mottaghitalab, Xi, Spinks and Wallace7
Polyaniline (PANI) was discovered over 150 years ago; however, only since the early 1980s has PANI captured the intense attention of the scientific community mainly due to the rediscovery of its high electrical conductivity. Reference Okamoto and Brenner8 Also, PANI is the cheapest polymer among its conducting polymer family, which has a rich chemistry. Narayanankutty Reference Sobha and Narayanankutty2 research group found that the well-dispersed filler in functional MWCNT-PANI/thermoplastic urethane (TPU) composites improved strain sensitivity. They stated that the coating of PANI on functional MWCNT reduced its entanglement and enhanced the interfacial interaction between the nano fillers and TPU, leading to improved strain sensitivity. Other investigators Reference Huang, Long, Tang and Zhang9–Reference Banerjee, Konwar and Kumar11 also showed that PANI composites have superior strain sensitive properties.
MWCNT films have been demonstrated to show the capability of being strain sensors. Reference Li, Levy and Elaadil12,Reference Lin, Rotenberg, Fekrmandi, Ward and Levy13 Also, theoretical analysis showed that the addition of CNTs into a polymer matrix can improve the damping ratio and stiffness of the matrix, Reference Zhou, Shin, Wang and Bakis14 while experiments of different MWCNT composite films verified the theoretical prediction. Reference Xiong, Zheng, Qin, Li, Li and Huang15,Reference Buffa, Abraham, Grady and Resasco16 Herein, the nanocomposites of PANI/MWCNT films were fabricated and their vibration damping properties and their strain sensing properties were studied.
II. EXPERIMENTAL
Preparation of PANI/MWCNT nanocomposites with different compression force
64.375 ± 0.010 mg of MWCNT (Nano-lab www.nano-lab.com: PD15L5-20) with length of 5–20 μm and outer diameter of 15 ± 5 nm were dispersed by sonication in 125 mL of 1 M HCl for 30 min. Then, 1.287 ± 0.003 g of aniline was added and the mixture was sonicated for another 30 min. After that, 1.027 ± 0.003 g of ammonium persulphate (APS) dissolved in 125 mL of 1 M HCl was added at once and polymerization was conducted at 0 °C with water-ice bath under sonication for 4 h. The precipitated products were washed with deionized water. Only 36% of the aniline was converted into the PANI/11% wt MWCNT nanocomposite. The 11% wt MWCNT composition was determined from the prepared nanocomposite based upon simultaneous DSC-TGA (SDT) test.
The pure raw rectangular MWCNT film was prepared by the same frit compression procedure. 454.54 ± 0.005 mg MWCNT was suspended into 3 mL deionized water, then the mixture was simply transferred into the cuboid mold to squeeze out the solvent. In a similar process as that used in preparing the PANI/11% wt MWCNT nanocomposite films, the pure MWCNT film was obtained.
454.54 ± 0.005 mg of obtained PANI/11% wt MWCNT suspension was transferred into a specially built 50 mL cuboid mold [see Fig. 1(a)], which was equipped with frits with a pore diameter of 70 µm (frits purchased from Sigma–Aldrich). To remove the solvent, two different compression forces of 289 ± 3% N and 334 ± 3% N were applied to the plungers, which were measured by FlexiForce adapter [see Fig. 1(c)]. After the solvent was squeezed out, the frits-PANI/11% wt MWCNT sandwich with the cuboid mold was dried at 110 °C in an oven for 12 h. The PANI/11% wt MWCNT composite film was obtained after removing it from the cuboid mold. It should be noted that different PANI/percent weight MWCNT composites were evaluated and the results were presented elsewhere. Reference Lin, Kong and Levy17,Reference Levy21 Based upon those results, the PANI/11% wt MWCNT was chosen because it had the best damping ability while still maintaining the best linear strain behavior under loading.
(a) The frit compression system for making PANI/11% wt MWCNT nanocomposite films. System consists of A: cuboid; B: plungers; C: polypropylene frits and D: composites suspension chamber; (b) photo image of PANI/MWCNT nanocomposites; (c) the schematic image of 289 and 334 N force applied to plungers measured by FlexiForce adapter. The adapter's load measurements have a ±3% error.

III. CHARACTERIZATIONS
A. Morphological characterization of the PANI/11% MWCNT film
Transmission electron microscopy (TEM) and scanning electron microscopy (SEM) were used to evaluate the PANI/11% wt MWCNT film's morphological properties. The sonicated polymerized PANI/11% wt MWCNT which is washed with deionized water and the pure MWCNT which is treated and washed by strong acid (H2SO4:HNO3 = 3:1) were characterized by Phillips CM-200 (FEI Company, Tokyo, Japan), 200 kV TEM. Both dried PANI/11% wt MWCNT composite film and the pure MWCNT film were characterized by JEOL 6330F field emission SEM (JEOL Ltd., Amsterdam, The Netherlands).
B. PANI/MWCNT nanocomposites damping test setup
1. Single side attachment
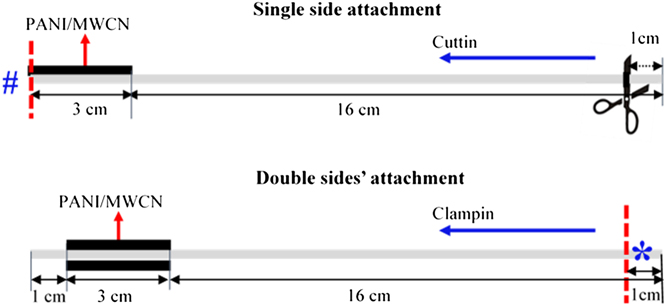
To determine if the “squeezing” load had an effect on the sensor properties when squeezing out the solvent, several levels of loading were used. We report on the two cases of 289 and 334 N applied force, respectively. The force is applied via a FlexiForce adapter. The PANI/MWCNT with dimension of 3 cm × 0.9 cm × 1.9 mm were cut and attached upon 20.5 cm × 0.9 cm × 1.25 mm Aluminum base beam on one side [see Fig. 2] using a very thin layer of glue. The specimen was dried at room temperature for 24 h. The unclamped side was made to vibrate and the damping ratio was determined for various lengths of the beam. The sample size did not change. Free vibration comparisons were made by using either the sample side, #, or the uncovered side, *, alternately, as the fixed support for the cantilever beam. The red dashed lines shown in Fig. 2 defined the locations where the beam was clamped. The side of the Aluminum (Al) base beam that was without the sample was cut and the beam was clamped. The unclamped side was then made to vibrate and a parameter called the damping ratio was determined. This process was repeated after cutting the beam 1 cm at a time, until the cut end was next to the sample. The damping ratios were then compared.
Schematic images for sample attachment. The dimension of samples, Al beams and the locations where samples were attached; the locations of sample side, #, and free end side, *, where the beam was clamped; and also the directions and lengths for both cutting and clamping.
2. “Sandwich” attachment
The sample used in this experiment is with 333.617 N applied “squeezing” force on the PANI/MWCNT. All the dimensions of sample and aluminum base beams, and the methodologies of testing applied to the single side are the same. The only change is that the Aluminum beam was “sandwiched” on both sides with the sample (see Fig. 2).
C. Damping test methodology
The cantilever beams of both single side attached and double sides attached (Fig. 2) were given the same small initial free end displacement and then released for free vibration. Free end displacements were then measured by a laser vibrometer and a two channels digital oscilloscope was used to display and store the signal. Five trials were made for each setup and the mean value of the damping ratio was calculated. This ratio can be related to the logarithmic decrement of consecutive maxima of end displacements and can be correlated to how much vibration energy is removed per cycle by the sample. The higher the damping ratio, the better the sample acts as a damper.
D. PANI/MWCNT nanocomposites strain sensing test
1. Sample setup for drift, static tensile test for the PANI/MWCNT
The sensor was bonded to the center of a 1.55 mm thick 6061-T6 Aluminum rectangular bar using 3M CA100 liquid instant adhesive. Each specimen was held in place by a weight and dried in room temperature for 24 h. The bonding area was prepared to ensure a smooth surface, as is normally defined for a foil strain gage, with no oxide formations on the surface. A foil strain gage, Micro-Measurements N2A-00-10CBE-350, 3 cm long × 0.3 cm wide, was bonded to the opposite side of the substrate. 24 AWG solid wire was used to connect decade resistor boxes manufactured by Eisco Labs in a Wheatstone bridge setup for the sensor or the foil strain gage. Prior to testing, resistance of the sensor and strain gage was measured and the corresponding decade resistance boxes were set to match. The decade resistor boxes have a resolution of about 1 ohm. This causes the initial millivolt potential difference to rarely start at zero. To compensate for this, where appropriate, data points were shifted to allow for comparison of different sensors. Constant voltage was provided during testing by B&K precision power supply (1745A). The voltage supply was set to 5 volts for measured resistance above 20 ohms. For resistance below 20 ohms, the voltage supply was set to 2 volts. Signals from the drift and strain measurement tests were collected using National Instruments NI cDAQ-9172 board and LabView software. Linearity and sensitivity of the sensor were evaluated using quasistatic loadings. These loadings were carried out using a United SSTM-2K model tensile test machine.
2. Drift test procedures for the PANI/MWCNT sensor
The mounted sample was connected to the measurement system and placed in a no load and ambient temperature condition for at least 24 h prior to testing. The test equipment was then turned on, and at least 60 min of data were collected for each sample. The drift test was performed several times for the sake of repeatability.
3. Static test procedures for the PANI/MWCNT sensor
The mounted sample was placed in the tensile testing machine and connected to the measurement system. The system was left idle for at least 1 h prior to testing to remove any accumulated stresses due to mounting. Signal collection was initiated. The tensile test system was set to extend at a rate of 0.00254 ± 0.00127 cm per minute. This way the system was considered to be operating quasistatically. The system was set to increase ramp force at the set extension rate until 1556.88 N of force was achieved. The system was then set to instantaneously reduce load to 0 N. This procedure was repeated multiple times to determine repeatability of the results and hysteresis in the system.
IV. RESULTS AND DISCUSSION
The Young's Modulus for the PANI/MWCNT sensor is discussed elsewhere Reference Lin, Kong and Levy17,Reference Levy21 and will not be discussed in this paper.
A. Morphological characterization of the PANI/MWCNT film
Figure 3 provides the TEM images of pure MWCNT [Fig. 3(a)] and PANI/11% MWCNT [Fig. 3(b)], which shows that the MWCNT and the PANI were integrated to form PANI/11% MWCNT nanocomposites. The MWCNT diameters are 15 ± 5 nm [Fig. 3(a)] depending on measurement location in the TEM image while the diameters of the PANI/11% MWCNT are about 70 nm [Fig. 3(b)]. It indicates that the MWCNT nanofibers were coated with a dense PANI layers. Furthermore, comparing both TEM images shown below, the walls of PANI/11% MWCNT nanofibers were rougher than the walls of MWCNT nanofibers. It indicates that the polymerization of PANI was at least part of the nucleation growth and that the MWCNT was initially acting as the nucleating agent, which led to a new interwoven fibrous structure [Fig. 4(b)].
TEM images of (a) pure MWCNT and (b) PANI/11% MWCNT.

SEM image of (a) pure MWCNT, (b) pure PANI and (c) PANI/11% MWCNT composite films.

Figure 4 is the SEM images of surfaces of pure MWCNT [Fig. 4(a)], pure PANI [Fig. 4(b)], and PANI/11% MWCNT nanocomposites [Fig. 4(c)] films. It shows the different roughness of the three different films surfaces. The pure MWCNT have the roughest surface, while the PANI have the smoothest surface among three films surfaces. The roughness of the nanocomposites PANI/11% MWCNT falls between the two, which means the order of the surfaces roughness of these three films are pure MWCNT > PANI/11% MWCNT nanocomposites > pure PANI. Combined with the results of TEM results shown in Fig. 3, it indicates that during the polymerization of PANI with the presence of MWCNT, the majority of MWCNT have been entrapped into the PANI films.
B. Damping ratios of different compression force of PANI/MWCNT
As we mentioned previously, the frits compression method was used to make PANI/MWCNT rectangular samples. Here, the impact of the 289.134 and 333.617 N “squeezing” force was studied (see Fig. 2) for the configuration of test setup for the Al base beam with single side attachment. The free vibration trial results are shown in Fig. 5.
Damping ratio comparison between 289 and 334 N compression force of PANI/MWCNT composites when clamped on the free end side. Error bars are provided for each test. Force apparatus has a ±3% error.
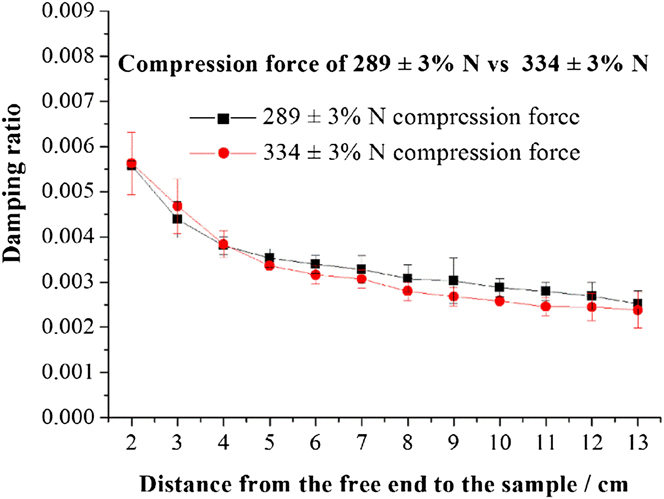
Five trials were run for each of clamping locations listed. Standard deviation is also provided in Fig. 5. The trend of damping ratios increases as the sample covers more of the beam. The effect of both 289 ± 3% N and 334 ± 3% N applied squeezing force on the damping ratios were not a critical factor as is shown in Fig. 5. For every single clamping location, the damping ratios for both 289 ± 3% N and 334 ± 3% N PANI/MWCNT samples had overlapped standard deviation, an indication that the results were not statistically different from each other. Therefore, the compression force used to create the PANI/MWCNT nanocomposites has very little impact on their damping ratios.
C. Damping results for single side attachment
As mentioned previously, the reason for the creation of the composite is for use as a sensor–actuator that also has damping capabilities. To check on the damping capability aspect, several tests were performed. Free vibration trial results are shown in Fig. 6.
Damping ratios of single side attached PANI/MWCNT clamped on the sample side and on the free end side. Error bars are provided for each test.
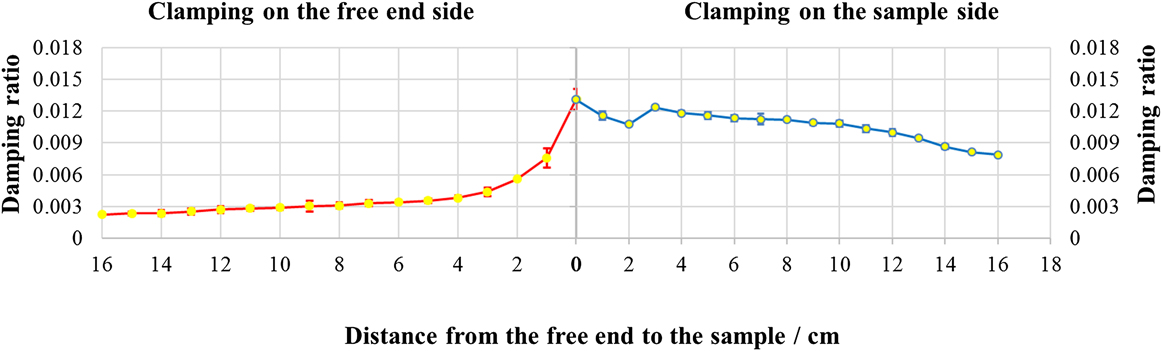
Five trials were run for each of the clamped locations listed. The results showed that the damping ratio increased as the distance from the free end to the sample decreased for clamping on both the free end side, *, and the sample side, # (see Fig. 6, red and blue data respectively). However, when clamped on the sample side, #, damping ratios will decrease as the distance from the free end to the sample is further decreased. After that, it increases again and reaches the highest damping value of 0.0131.
In most cases, the damping ratios, when the beam is clamped on the free end side *, are lower than when clamped on the sample side, #. For example, the highest damping ratios is 0.0131 when clamped on free end side, *, where the distance from sample to the free end is 0 cm. It is the only case for which both clamping conditions (free end side or sample side) are the same. However, when the distance from sample to the free end is 1 cm and clamping is on the free end side, *, the damping ratio is still lower (0.00757) than the damping ratio when clamped on the sample side, #, and the free end is at its furthest (0.00788). Finally, when the sample is symmetric with the ends, the damping ratio values must match.
D. Damping results for “sandwich” attachment
The double sides' attachment setup which is shown in Fig. 2 displayed similar type trends as the damping ratios for single sided attachment [see Fig. 7]. However, the double sides' attachment has overall higher damping ratios compared with single side attachment. It reached the highest damping ratio of 0.019 with double sides' attachment when the sample is 7 cm away from the free end.
Damping ratios of both sides attached PANI/MWCNT clamped on the free end side and on the sample side.
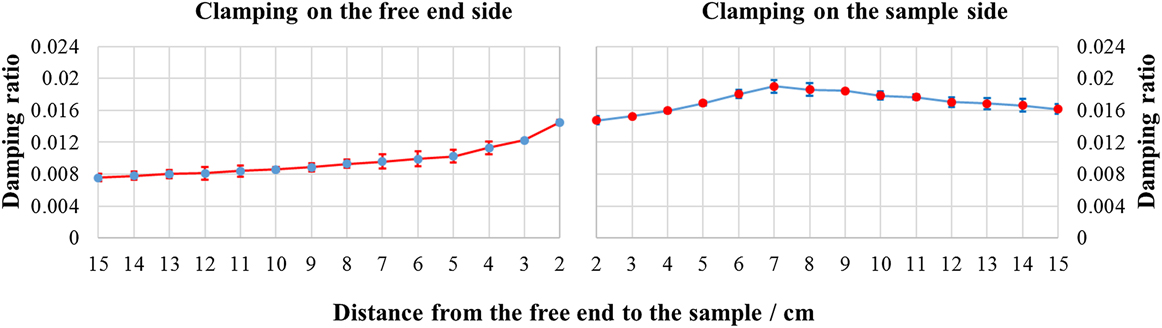
This means that there was more uncovered beam when the maximum damping ratio is reached in this setup that in the single side attachment setup, and, that single side attachment requires almost complete beam coverage to achieve the best damping ratio. Also, sample side clamping, #, damping ratios are higher that free end side, *, clamping damping ratios.
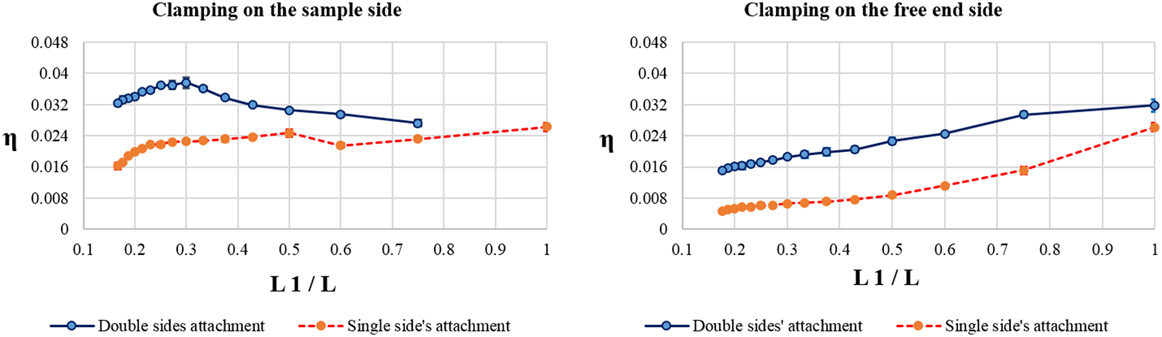
The relationship of loss factor, η and beam coverage L 1/L was discussed for single sided and double sided attachment for both clamping conditions previously discussed. The results are given in Fig. 8. The loss factor, η, is twice the damping ratio for small damping ratios up to 0.3. Reference Rao18 For sample side clamping, η increases with coverage length L 1/L increases. Then η decreases before increasing again as the coverage length L 1/L continues to increase. The trend for double sided attachment is found to follow the trends discussed by Rao Reference Rao18 and Levy and Chen, Reference Levy and Chen19 i.e., higher lost factors occur as sample length to beam length (L 1/L) increases before decreasing as L 1/L tends to 1. For beams clamped on the nonsample side, *, the loss factor, η, increases with coverage length, L 1/L, though its value is several times smaller than its value when the beam is clamped on the sample side, #. This is because the sample, in this case, acts as an end mass to the beam and this modifies the coverage length effects. Reference Rao18
The relationship of loss factor (η) and beam coverage L 1/L between single side and double sided attachment of the PANI/MWCNT sample for both clamping conditions.
E. Dynamic sensing capability of the PANI/MWCNT
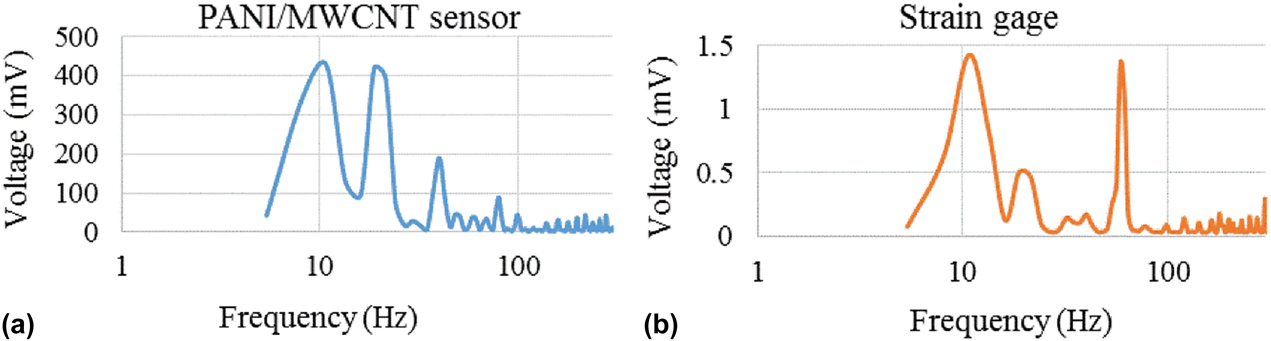
Sensing capability of the sensor was evaluated by inputting a known frequency to the beam with sensor via a test bed to which the beam and sensor were attached. The input signal applied was from 10 to 5000 Hz. Shown here in Fig. 9 are some results of the captured signals up to 1000 Hz.
Frequency response functions of PANI/MWCNT sensor and foil strain gage for 20–1000 Hz. (a) PANI/MWCNT—Magnitude: 418.0301 mV. (b) Foil strain gage—Magnitude: 0.498347 mV. (c) PANI/MWCNT—Magnitude: 28.27814 mV. (d) Foil strain gage—Magnitude: 0.03146 mV. (e) PANI/MWCNT—Magnitude: 6.614911 mV. (f) Foil strain gage—Magnitude: 0.058299 mV. (g) PANI/MWCNT—Magnitude: 0.059545 mV. (h) Foil strain gage—Magnitude: 0.063547 mV.

It is found that the PANI/MWCNT sensor was very much more sensitive than the foil strain gage up until 400 Hz and the signal produced the highest peak in the FRF graphs. Beyond that frequency, either the two produced similar magnitudes or were not the highest peaks distinguishable. The magnitudes listed represent the signal height sensed by the PANI/MWCNT sensor and the strain gage.
Figure 10 represents the superposition of the previous graphs shown in Fig. 9. This is undertaken to show that the PANI/MWCNT sensor is much more sensitive over a larger range of frequencies. For Fig. 10 we note that the magnitudes of the sensed signals are 100 times higher for the sensor than for the strain gage, whereas from 1000 to 5000 Hz (not shown here) the magnitudes for the sensor are on the order of 20 times higher than those sensed by the strain gage.
Superposition of the frequency response functions of the PANI/MWCNT sensor and foil strain gage for low and high frequency. Graphs represent a superposition of the previous graphs to indicate the superior sensitivity of the PANI/MWCNT in the 10–1000 Hz range. (a) FRF—PANI/MWCNT sensor (10–1000 Hz). (b) FRF—Foil strain gage (10–1000 Hz).
F. The drift test of PANI/MWCNT sensor
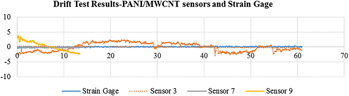
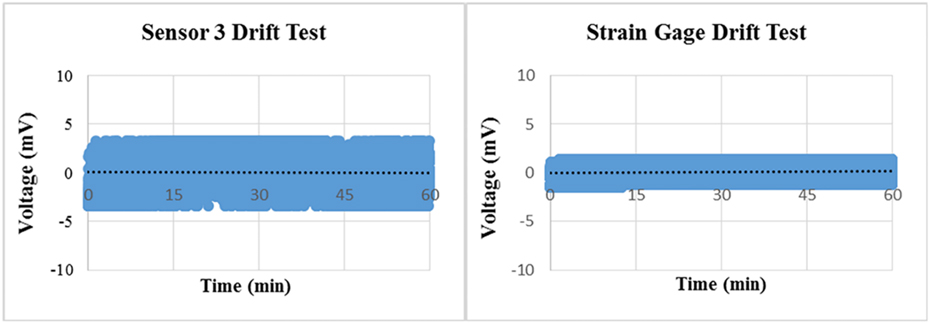
To determine the stability of the sensor, a drift test was used. The drift test was executed for the sample and for the strain gage for a period of 30 min or more (see Figs. 11 and 12). The voltage data were captured and for the sensors were shifted so that average recorded signal value was zero. This allowed for direct comparison of the sensors on the graph. The change in voltage per hour for typical results are also tabulated below (see Table I). The correlation of the data is small because significant noise was generated in the results due to the high sampling rate (see, e.g., Fig. 14). Therefore, other measurements given in succeeding sections do not include the correlation values.
PANI/MWCNT sensor and strain gage drift test. Drift trend lines for typical PANI/MWCNT sensor and strain gage. Vertical scale is in mV; horizontal scale is in minutes.
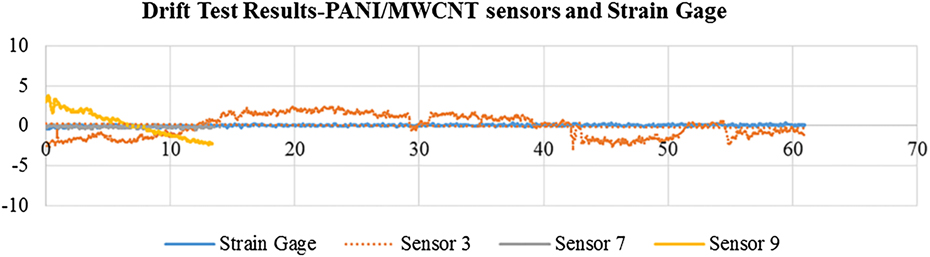
Drift test for PANI/MWCNT (sensor 3) and drift test for strain gage.
Trend line slopes for Fig. 11.

Figure 11 shows typical drift test results for one strain gage and three sample sensors. Sensor 3 data is given as the orange trace in the figure and its trend line is given also by the orange dotted line in the figure. We note that the strain gage (blue trace) showed almost no changes over the test period though there is a slight downward slope to the line. The sample sensors also exhibited very small slopes as well. Table I provides the voltage changes for the same sensors and strain gage of Fig. 11.
Figure 12 show typical sampling data for one of the samples and the strain gage where the sensor sample's voltage changes by −0.1298 mV/h while the foil strain gage changes by −0.0866 mV/h (the black dotted lines in the figs.). The final results of this testing showed that some sensor samples were unstable and had significant drift while others were stable but consistently had a drift that was of the same order of magnitude of the strain gage. This is reasonable since our testing apparatus could not be moved and had no way of isolating our samples from outside vibrations. Foil strain gages are known to be stable in this type of environment.
G. Linearity and repeatability of PANI/MWCNT sensor
Linearity and repeatability are two very important characteristics for strain sensors. It is desirable that the relationship between the applied strain and the output voltage be linear. The source voltage for the sensor and strain gage in Fig. 13 are equivalent.
Voltage-strain curves for the PANI/MWCNT sensor. Note initial linearity of the sensor then marked change in slope in which there is an apparent step, then linear once again at much lower slope.
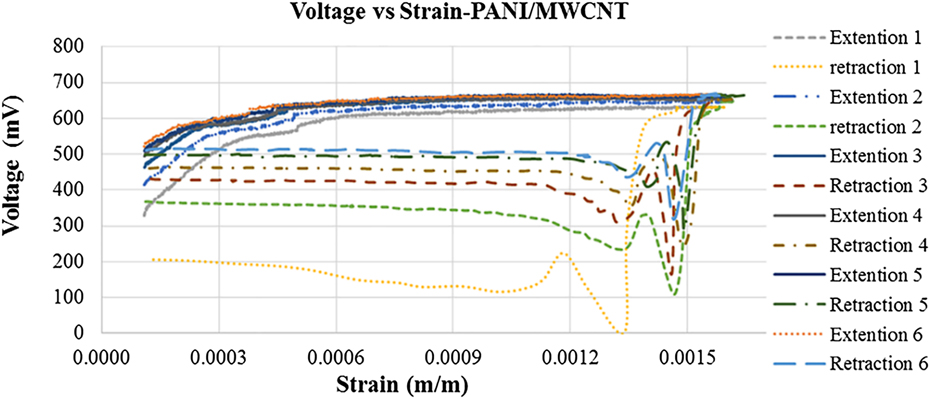
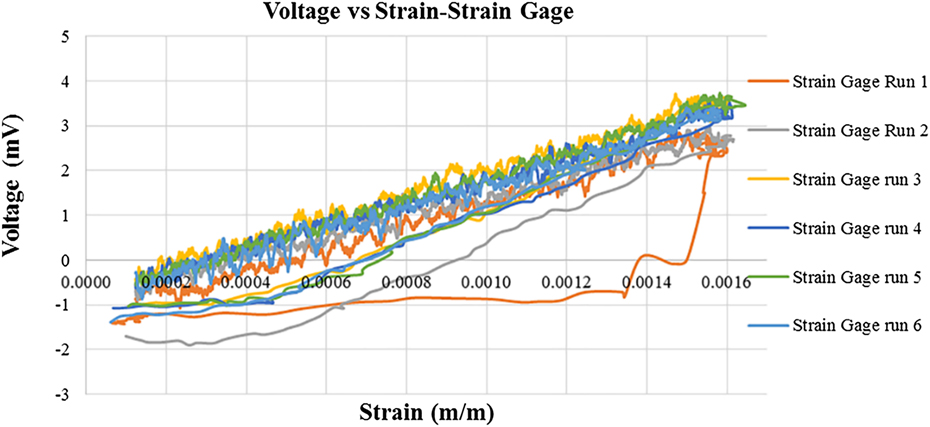
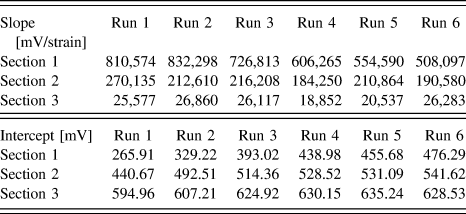
Figures 13 and 14 show typical data for samples that responded as desired. This dataset of one such sample shows six quasistatic loadings and instantaneous unload cycles. This figure also provides typical data obtained from testing both the sample sensor and the strain gauge. Shown are the results of the strain sensing capability of PANI/11% MWCNT composites sensor and this information is compared to the standard foil strain gage. Each test consisted of a 4–5 min preload preparation period, a three minutes loading period and a 3 s unloading period. Generally, both the sensor's and the strain gage's electric resistance change is essentially linear to the applied strain and is related to the gage factor. Whereas the strain gage's gage factor applies over the entire range, for the PANI/11% MWCNT, this must be recalculated over three ranges (see Table II for slope-intercept data).
Voltage-strain curve for strain gage shows linear voltage-strain behavior until unload and returns to same start value.
Slopes and intercepts for the PANI/MWCNT sensor given in Fig. 13.
The first 4–5 min of the test (not shown here) indicate that the system is in pre-load mode and had a residual strain to which both the sensor and strain gage had to adapt before the test is begun. Each unloading occurred about 3 s after releasing the previous load. Again, a “no load” preload period to set up the next test was introduced before the loading was begun. The strain gage appears to have returned to “zero” but the PANI/MWCNT sensor appears to show some hysteresis. The standard foil strain sensor responded quickly according to the load applied to the beam. However, PANI/MWCNT composites sensor did not completely return to “zero”.
As a new load was applied increasing the strain, the PANI/MWCNT composite sensor responded and sensed the strain initially linearly with the input. Yet, the slope for the sensor appears to have 3 distinct regions: rapid change up to strains of 0.0002–0.0004, then a lower slope to about a strain of 0.0004–0.0006, then an even lower slope over the remainder of the test cycle before the load is removed. However, when one evaluates the six cycles we note the similarity of the load-time graphs. We note that the sensor is more sensitive showing changes in voltage that are on several orders larger than those of the strain gage. This is true for all 3 regions. For the strain gage, the results of 6 tests are similar. Therefore, the PANI/MWCNT composite sensor senses similarly to the conventional foil strain gage but the slope of the load displacement curve (i.e., voltage/strain curve) is not uni-valued, though in terms of repeatability and linearity it is repeatable. When one compares the slope of the stress–strain curve in these three regions (not shown here), the slopes are found to be within a few percent of each other.
We also note a small step in the load time curve toward the middle of the second linear region, for every cycle, which indicates that the internal makeup of the PANI/MWCNT undergoes some type of change, perhaps slippage of the MWCNT over each other, thereby reducing the sensor gage factor. However, as seen in the figure this step becomes smaller as the number of cycles are increased. We also note that when the load is suddenly released a “wave-like” behavior appears in the trace and is due to the tensile machine not having an unloading program that uses an unloading rate that is the negative of the loading rate. Therefore, due to the equipment used for this test we could not discern if any hysteretic effect would exist in a complete cycle. Yet, as the sensor cycles through several cycles the unloading trace and the loading trace tend toward stable and similar traces. Lastly, we did not load the system to sensor failure as this test was used as a check for strain sensing repeatability.
V. CONCLUSIONS
A PANI/MWCNT sensor was created to evaluate its morphological properties and sensing and damping capabilities versus a standard foil strain gage. The sensor's damping capability was also compared with a constrained layer damping system. SEM and TEM results showed that this technique produced a coating of PANI onto the MWCNT, which indicated that CNT were well dispersed in the polymer matrix. Free end vibration test results indicated that addition of PANI to the MWCNT added damping capability to the sensor compared to PANI-less MWCNT sensors. Furthermore, the placement of the PANI/MWCNT sensor had an important effect on the amount of damping. Samples placed further away from the support produced lower damping. Double sided sensor placement had much higher damping that the single side attachment. The trends for double sided and single sided attachment were found to follow the trends discussed by Rao, Reference Rao18 and Levy and Chen Reference Levy and Chen19,Reference Chen and Levy20 for constrained viscoelastic material layers.
The PANI/MWCNT sensor's relation between load and displacement or strain cannot be described by a single equation as found for a strain gage. It appears to have three regions in which the relationship is quasilinear. This is in line with an observation reported elsewhere, Reference Levy21 namely, adding too much PANI to the sensor patch destroys the linear sensing capability of the sensor patch.
The dynamic sensing test results showed that the PANI/MWCNT composite sensor was more sensitive than the standard foil strain gage over a very large frequency range, and, that the sensor, when evaluated by the drift test, was stable over at least 20 h, as reported elsewhere. Reference Levy21
Lastly, not all samples created were capable sensors. However, the ones that worked produced repeatable results. In comparison to viscoelastic (VEM) constrained layer dampers, the same size PANI/MWCNT sensor may or may not be a weight saver; but is cheaper to produce.
Conflict of Interest
The authors declare that they have no conflict of interest related to this work.
ACKNOWLEDGMENTS
The authors are grateful to the US Army Research Laboratory and US Army Research Office for the following Grant No. 58940-RT-REP that enabled this work to be possible. One author (HF) thanks Florida International University for the Dissertation Year Fellowship which allowed for his participation in this work.


 Open access

