

1. Introduction
Landscape topography generally reflects the balance between tectonic processes (e.g., rock uplift and active faulting) and erosional processes, which are mainly caused by the climate and lithology. Morphotectonic investigations and quantitative geomorphic analyses might therefore allow us to constrain the relative differences in the rates of rock uplift and thus increase our understanding of active tectonics (e.g., Kirby & Whipple Reference Kirby and Whipple2001, Reference Kirby and Whipple2012; Wobus et al. Reference Wobus, Whipple, Kirby, Snyder, Johnson, Spyropolou, Crosby, Sheehan, Willett, Hovius, Brandon and Fisher2006; Whittaker & Boulton Reference Whittaker and Boulton2012; Ahmad et al. Reference Ahmad, Alama, Ahmad, Afza, Bhat, Bhat and Farooq2018; Saber et al. Reference Saber, Caglayan and Isık2018, Reference Saber, Isik and Caglayan2020; Sukhishvili et al. Reference Sukhishvili, Forte, Merebashvili, Leonard, Whipple, Javakhishvili, Heimsath and Godoladze2020; Valkanou et al. Reference Valkanou, Karymbalis, Papanastassiou, Soldati, Chalkias and Gaki-Papanastassiou2021). Significantly, tectonic geomorphology can also highlight areas of active tectonics and potential seismic hazards in the absence of other data, such as dense geodetic networks and long-term and complete seismic and palaeoseismic records (e.g., Sukhishvili et al. Reference Sukhishvili, Forte, Merebashvili, Leonard, Whipple, Javakhishvili, Heimsath and Godoladze2020).
Active tectonics has an essential role in determining the development of the present-day landscape, which contributes to the topographic development resulting from combined acts of weathering and denudational processes (e.g., Harkins et al. Reference Harkins, Anastasio and Pazzaglia2005; Anand & Pradhan Reference Anand and Pradhan2019). Molnar et al. (Reference Molnar, Anderson and Anderson2007) stated that tectonics has its most important role in causing rapid incisions in valleys and the rapid erosion of hillslopes. Accordingly, in tectonically active regions, drainage patterns are sensitive to tectonic processes such as folding, fracturing, faulting and tilting of the basin deposits over time, which affect the incision, asymmetry and diversion of rivers (Cox Reference Cox1994). The analysis of morphometric indices is one the most useful tools for estimating relative tectonic activity from the shape of the Earth's surface and is widely used as a reconnaissance tool for the differentiation of active zones (e.g., Bull & McFadden Reference Bull, McFadden and Doehring1977; Rockwell et al. Reference Rockwell, Keller, Johnson and Morisawa1985; Wells et al. Reference Wells, Bullard, Menges, Drake, Karas, Nelson, Retter and Wesling1988; Keller & Pinter Reference Keller and Pinter2002; Chen et al. Reference Chen, Sung and Cheng2003; Saber et al. Reference Saber, Caglayan and Isık2018, Reference Saber, Isik and Caglayan2020; Moumeni et al. Reference Moumeni, Nozaem and Dehbozorgi2021).
The evaluation of geomorphic indices in tectonically active basins assists in determining the primary reason for their anomalous behaviour (Anand & Pradhan Reference Anand and Pradhan2019). Practical analyses that are commonly used in morphometric analysis studies include the hypsometric integral/curve (Hi), the stream length–gradient index (Sl), the normalised steepness index (Ksn), the valley floor width–valley height ratio (Vf), the mountain front sinuosity (Smf), the asymmetry factor of the drainage basin (Af) and the basin shape index (Bs) (e.g., Snyder et al. Reference Snyder, Whipple, Tucker and Merritts2000; Burbank & Anderson Reference Burbank and Anderson2001; Azor et al. Reference Azor, Keller and Yeats2002; Keller & Pinter Reference Keller and Pinter2002; Troiani & Della Seta Reference Troiani and Della Seta2008; Kirby & Whipple Reference Kirby and Whipple2012; Saber et al. Reference Saber, Caglayan and Isık2018, Reference Saber, Isik and Caglayan2020). Previous studies have evaluated these geomorphic indices and estimated the tectonic activity rates obtained using different methods (e.g., El Hamdouni et al. Reference El Hamdouni, Irigaray, Fernández, Chacón and Keller2008; Alipoor et al. Reference Alipoor, Poorkermani, Zare and El Hamdouni2011; Saber et al. Reference Saber, Caglayan and Isık2018, Reference Saber, Isik and Caglayan2020; Moumeni et al. Reference Moumeni, Nozaem and Dehbozorgi2021; Valkanou et al. Reference Valkanou, Karymbalis, Papanastassiou, Soldati, Chalkias and Gaki-Papanastassiou2021). The results have been used to determine the index of active tectonics (IAT) (El Hamdouni et al. Reference El Hamdouni, Irigaray, Fernández, Chacón and Keller2008), which uses the average of the values of all the indices, and the improved analytical hierarchy process (AHP) (Alipoor et al. Reference Alipoor, Poorkermani, Zare and El Hamdouni2011), which is based on the relative importance of each index. The AHP method is used to enhance the accuracy of the results obtained from the geomorphic analysis of tectonic activity (Moumeni et al. Reference Moumeni, Nozaem and Dehbozorgi2021). Saber et al. (Reference Saber, Caglayan and Isık2018, Reference Saber, Isik and Caglayan2020) used both methods in the same drainage basins to compare results and to determine the most appropriate method to better reflect the geological/tectonic conditions of the study area.
It is also essential to study structural features to check and compare the results obtained from quantitative analyses. Several studies have focused on the influence of fractures on geomorphic processes and landscape evolution in different regions of the world (e.g., Molnar et al. Reference Molnar, Anderson and Anderson2007; Pelletier et al. Reference Pelletier, Engelder, Comeau, Hudson, Leclerc, Youberg and Diniega2009; Koons et al. Reference Koons, Upton and Barker2012; Lima & Binda Reference Lima and Binda2013; DiBiase et al. Reference DiBiase, Rossi and Neely2018; Scott & Whol Reference Scott and Whol2019). Fault palaeostress analysis is an important method of finding stress tensors and is referred to as an ‘inverse problem’ (e.g., Fleischman & Nemcok Reference Fleischman and Nemcok1991; Angelier Reference Angelier and Hancock1994; Twiss & Unruh Reference Twiss and Unruh1998; Angelier et al. Reference Angelier, Slunga, Bergerat, Stefansson and Homberg2004). This method helps to distinguish the different stress regimes related to tectonic phases in different time periods, where the interactions or reactivation of the faults formed during these phases directly affect the shape of the landscape and surface processes.
The Turkish–Iranian Plateau, which is sometimes described as two separate areas with different tectono-geomorphic features referred to as the Iranian and Anatolian Plateaus (e.g., Ballato et al. Reference Ballato, Stockli, Ghassemi, Landgraf, Strecker, Hassanzadeh, Friedrich and Tabatabaei2013; Khodaparast et al. Reference Khodaparast, Madanipour, Enkelmann, Nozaem and Hessami2020), includes a large number of intra-plate deformation zones formed as a result of the collision of the Arabian and Eurasian Plates (e.g., Şengör & Kidd Reference Şengör and Kidd1979; Jackson Reference Jackson1992; Agard et al. Reference Agard, Omrani, Jolivet and Mouthereau2005; Allen et al. Reference Allen, Blanc, Walker, Jackson, Talebian and Ghassemi2006; Reilinger et al. Reference Reilinger, McClusky, Vernant, Lawrence, Ergintav, Cakmak, Ozener, Kadirov, Guliev, Stepanyan, Nadariya, Hahubia, Mahmoud, Sakr, ArRajehi, Paradissis, Al-Aydrus, Prilepin, Guseva, Evren, Dmitrotsa, Filikov, Gomez, Al-Ghazzi and Karam2006; Isik et al. Reference Isik, Uysal, Caglayan and Seyitoglu2014; Caglayan et al. Reference Caglayan, Isik and Saber2019; Solaymani Azad et al. Reference Solaymani Azad, Nemati, Abbassi, Foroutan, Hessami, Dominguez, Bolourchi and Shahpasandzadeh2019; Saber et al. Reference Saber, Isik and Caglayan2021). In addition, plate boundaries and significant areas of intra-plate deformation are found in NW Iran, including numerous large-scale active fault zones (e.g., Masson et al. Reference Masson, Djamour, Van Gorp, Chery, Tatar, Tavakoli, Nankali and Vernant2006; Berberian Reference Berberian2014; Solaymani Azad et al. Reference Solaymani Azad, Nemati, Abbassi, Foroutan, Hessami, Dominguez, Bolourchi and Shahpasandzadeh2019; Isik et al. Reference Isik, Saber and Caglayan2021; Niassarifard et al. Reference Niassarifard, Shabanian, Solaymani Azad and Madanipour2021; Saber et al. Reference Saber, Isik and Caglayan2021) (Fig. 1b). The strike-slip faults in NW Iran have been proposed to represent the northern boundary of the Iranian–Caledonian palaeorelief (e.g., the Tabriz fault zone; Nabavi Reference Nabavi1974), the borders of the mountain belts (e.g., the North and South Bozgush fault zones; Saber et al. Reference Saber, Caglayan and Isık2018; Isik et al. Reference Isik, Saber and Caglayan2019, Reference Isik, Saber and Caglayan2021), tear faults accommodating differential displacement between two adjacent segments of the belt (e.g., the Sangavar fault; Solaymani Azad et al. Reference Solaymani Azad, Nemati, Abbassi, Foroutan, Hessami, Dominguez, Bolourchi and Shahpasandzadeh2019) and the boundary between two different tectonic blocks (the Aras fault zone; Saber et al. Reference Saber, Isik and Caglayan2020, Reference Saber, Isik and Caglayan2021). Other prominent examples of tectonic structures in NW Iran include the reverse/thrust Moghan fault zone (including different fault segments such as the Angut, Aghlanjigh and Gayabashi faults), the right-lateral strike-slip Ahar fault and the 1997 earthquake seismogenic left-lateral West Ardebil fault.
(a) Map showing the location of the study area and surroundings within the Earth's tectonic plates. Plate boundaries adopted from Cawood et al. (Reference Cawood, Hawkesworth, Pisarevsky, Dhuime, Capitanio and Nebel2018). (b) Map showing the locations of active faults (Hessami et al. Reference Hessami, Jamali and Tabassi2003; Emre et al. Reference Emre, Duman, Özalp, Elmacı, Olgun and Saroglu2013; Saber et al. Reference Saber, Isik and Caglayan2021), earthquake epicentres from 1975 to the present day (Incorporated Research Institutions for Seismology (IRIS) catalogue 2020) and earthquake focal mechanism solutions (Global CMT Centre; Ekström et al. Reference Ekström, Nettles and Dziewonski2012) of NW Iran and its surroundings. AASZ, Alborz–Azerbaijan structural zone; ADF, Akdag fault; AHF, Ahar fault; AFZ, Aras fault zone; AF, Akhuiran fault; AKF, Akera fault; BGFZ, Balıkgolu fault zone; BF, Baskale fault; CF, Çaldıran fault; EF, Ercis fault; DBF, Dogubeyazıt fault; GF, Garni fault; GSKFZ, Guilato–Siahcheshmeh–Khoy fault zone; HSFZ, Horasan Senkaya fault zone; KHF, Khazar fault; KF, Kazbel fault; MF, Maku fault; MFZ, Moghan fault zone; NBFZ, North Bozgush fault zone; PSSFZ, Pambak–Sevan–Sunik fault zone; SAF, Salmas fault; SBFZ, South Bozgush fault zone; SASZ, Southeast Anatolian suture zone; SF, Sangavar fault; SOF, Soltaniyeh fault; SYFZ, Semdinli Yuksekova fault zone; TAF, Talesh fault; TFZ, Tabriz fault zone; TSF, Tasuj fault; ZF, Zanjan fault; VFZ, Van fault zone; WCF, West Caspian fault

The study area is located in a controversial area surrounded by major active fault zones such as the Aras, Tabriz, North and South Bozgush, Talesh, Sangavar and Moghan fault zones (Fig. 1b) (Saber et al. Reference Saber, Isik and Caglayan2020). Our preliminary research based on remote sensing analysis and field observations has revealed that intense fracturing (e.g., faults, shear fractures, joints and veins), representing brittle deformation processes, is a prominent characteristic of the study area. These structures, which show variability in length and orientation, have developed in all lithological outcrops of different ages and exhibit noticeable surface landforms. However, the origin, age and relationship between these structures are unknown and have not been included in previously published work. This overlooked gap motivated us to conduct multidisciplinary studies and find reliable answers to our questions. This study will help us to understand different aspects of fracture development in NW Iran and its impact on landscape formation and Quaternary surface processes.
This study focuses on analysing geomorphic indices of active tectonics to investigate the role of tectonic activity in the development of drainage basins in the Sabalan area. The lack of similar studies in this region or the surrounding areas was the primary motivation behind this study. The approximate size of the study area is 22 km2 × 16 km2. Many previously published studies on a regional scale (e.g., El Hamdouni et al. Reference El Hamdouni, Irigaray, Fernández, Chacón and Keller2008; Alipoor et al. Reference Alipoor, Poorkermani, Zare and El Hamdouni2011; Amine et al. Reference Amine, El Ouardi, Zebari, El Makrini and Habibi2020) and of single structures (e.g., Azor et al. Reference Azor, Keller and Yeats2002; Alipoor et al. Reference Alipoor, Poorkermani, Zare and El Hamdouni2011; Giaconia et al. Reference Giaconia, Booth-Rea, Martínez-Martínez, Azañón, Pérez-Peña, Pérez-Romero and Villegas2012; Özkaymak & Sözbilir Reference Özkaymak and Sözbilir2012; Özkaymak Reference Özkaymak2015; Bhatt et al. Reference Bhatt, Singh, Ansari and Bhatt2020) have successfully identified the effects of tectonic processes in shaping surface landforms in similar areas.
We performed quantitative geomorphic index analysis to evaluate the relative tectonic activity and examine the factors influencing various indices. We investigated the correlation of structural features with the geomorphological results because landscape patterns form as a result of interactions between different factors (e.g., tectonics, lithology and climatic conditions) and tectonism constructs landscapes through crustal movements such as uplift and warping, (e.g., Krummel et al. Reference Krummel, Gardner, Sugihara, O'Neill and Coleman1987; Lifton & Chase Reference Lifton and Chase1992). We analysed the fracture patterns in the study area to understand the types and orientations of different fracture sets, to examine their potential impact on surface processes and to correlate them with the anomalous results of geomorphic indices. The application of fault palaeostress analysis provided the opportunity to evaluate the relationship between the faults that formed during different tectonic phases, the contrasting and perplexing geomorphic and structural features observed in the field and in satellite images, and to explain the impact of faulting on the processes shaping the landscape.
2. Geological and tectonic settings
2.1. Neotectonics of NW Iran
The Iranian Plateau is located between the Arabian Plate to the south and the Eurasian Plate to the north (Fig. 1a). Activities related to the Alpine Orogeny were initiated in NW Iran during the Late Cretaceous. These activities were effective throughout the Paleocene and Eocene, but were more limited during the late Eocene–late Miocene (Oskoi & Rahimzadeh Reference Oskoi and Rahimzadeh1994). Different estimates for the timing of the collision of the Arabian and Eurasian Plates have been suggested from 65 to 5 Ma, such as Late Cretaceous (e.g., Berberian & King Reference Berberian and King1981), late Eocene to middle Miocene (e.g., Dewey et al. Reference Dewey, Hempton, Kidd, Saroglu, Sengor, Coward and Ries1986; Guest et al. Reference Guest, Stockli, Grove, Axen, Lam and Hassanzadeh2006; Vincent et al. Reference Vincent, Morton, Carter, Gibbs and Barabadze2007; Allen & Armstrong Reference Allen and Armstrong2008; Ballato et al. Reference Ballato, Uba, Landgraf, Strecker, Sudo, Stockli, Friedrich and Tabatabaei2010), early Oligocene (e.g., McQuarrie & van Hinsbergen Reference McQuarrie and van Hinsbergen2013), late Oligocene to late Miocene (e.g., Fakhari et al. Reference Fakhari, Axen, Horton, Hassanzadeh and Amini2008) and Pliocene (e.g., Falcon Reference Falcon1974). Many researchers prefer to consider that the collision of the Arabian and Eurasia Plates was initiated at 36–20 Ma (e.g., Zhang et al. Reference Zhang, Xiao, Majidifard, Zhu, Wan, Ao, Chen, Rezaeian and Esmaeili2016), although most of the tectonic responses to the collision occurred after 20 Ma (Su & Zhou Reference Su and Zhou2020).
The right-lateral fault array is active in NW Iran and allows for shortening within the tip of the Arabian promontory (Copley & Jackson Reference Copley and Jackson2006; Allen Reference Allen, Kusky, Zhai and Xiao2010), which has had an essential role in developing surface processes during the Quaternary (e.g., Karakhanian et al. Reference Karakhanian, Trifonov, Philip, Avagyan, Hessami, Jamali, Bayraktutan, Bagdassarian, Arakelian, Davtia and Adilkhanyan2004; Solaymani Azad et al. Reference Solaymani Azad, Nemati, Abbassi, Foroutan, Hessami, Dominguez, Bolourchi and Shahpasandzadeh2019; Saber et al. Reference Saber, Isik and Caglayan2021). The main lateral movement of the crust is accommodated by NW–SE- (e.g., the Tabriz fault zone), N–S- (e.g., the Talesh and Sangavar fault zones), E–W- (e.g., the North and South Bozgush fault zones) and NE–SW- (e.g., the Aras fault zone) striking fault zones, which have produced many destructive earthquakes during historical and instrumental periods (e.g., Berberian Reference Berberian, Giardini and Balassanian1997; Berberian & Yeats Reference Berberian and Yeats1999; Hessami et al. Reference Hessami, Jamali and Tabassi2003; Karakhanian et al. Reference Karakhanian, Trifonov, Philip, Avagyan, Hessami, Jamali, Bayraktutan, Bagdassarian, Arakelian, Davtia and Adilkhanyan2004; Moradi et al. Reference Moradi, Hatzfeld and Tatar2011; Rizza et al. Reference Rizza, Vernant, Ritz, Peyret, Nankali, Nazari, Djamour, Salamati, Tavakoli, Chéry, Mahan and Masson2013; Isik et al. Reference Isik, Saber and Caglayan2021). The formation of seismogenic faults, such as the left-lateral strike-slip fault during the 1997 Golestan earthquake east of Sabalan volcano, indicates the dynamism of the Earth's crust in this region. Different aspects of the tectonics of NW Iran and its surroundings have been included in numerous studies (e.g., Jackson Reference Jackson1992; Berberian & Yeats Reference Berberian and Yeats1999; Nilforoushan et al. Reference Nilforoushan, Masson, Vernant, Vigny, Martinod, Abbasi, Nankali, Hatzfeld, Bayer, Tavakoli, Ashtiani, Doerflinger, Daignieres, Collard and Chery2003; Vernant et al. Reference Vernant, Nilforoushan, Hatzfeld, Abbasi, Vigny, Masson, Nankali, Martinod, Ashtiani, Tavakoli and Chery2004; Masson et al. Reference Masson, Anvari, Djamour, Walpersdorf, Tavakoli, Daignieres, Nankali and Van Gorp2007; Djamour et al. Reference Djamour, Vernant, Nankali and Tavakoli2011; Rizza et al. Reference Rizza, Vernant, Ritz, Peyret, Nankali, Nazari, Djamour, Salamati, Tavakoli, Chéry, Mahan and Masson2013; Madanipour et al. Reference Madanipour, Ehlers, Yassaghi and Enkelmann2017; Saber et al. Reference Saber, Caglayan and Isık2018, Reference Saber, Isik and Caglayan2020, Reference Saber, Isik and Caglayan2021; van der Boom et al. Reference Van der Boon, van Hinsbergen, Rezaeian, Gürer, Honarmand, Pastor-Galan, Krijgsman and Langereis2018; Solaymani Azad et al. Reference Solaymani Azad, Nemati, Abbassi, Foroutan, Hessami, Dominguez, Bolourchi and Shahpasandzadeh2019; Rezaeian et al. Reference Rezaeian, van der Kuijper, Boon, Pastor-Galan, Cotton, Langereis and Krijgsman2020). More recent studies have analysed geomorphic indices to investigate the relative tectonic activity in the active fault-dominated areas of NW Iran (Saber et al. Reference Saber, Caglayan and Isık2018, Reference Saber, Isik and Caglayan2020).
2.2. Sabalan volcano
Sabalan volcano, with elevations up to 4861 m, is one of the Pliocene–Quaternary volcanic cones located on the Turkish–Iranian Plateau (Fig. 1a). According to Stocklin (Reference Stocklin1968), Sabalan volcano belongs to the Neogene–Quaternary volcanic zone in the northwestern Alborz–Azerbaijan structural zone (Fig. 1b). Didon & Gemain (Reference Didon and Gemain1976) suggested that Sabalan volcano is a result of two different tectonic events during two major orogenic cycles. The first was in the Late Cretaceous as a result of the Laramide phase, when the Neotethys Ocean closed. The second event occurred during the post-Neotethys intra-plate deformation related to the convergence of the Arabian and Eurasian Plates (Mousavi et al. Reference Mousavi, Darvishzadeh, Ghalamghash and Vosoughi Abedini2014). Magmatic activity and effusive eruptions in the Azerbaijan region began in the Eocene (Nabavi Reference Nabavi1974). The Eocene volcanism was subsequently interrupted and metamorphosed by monzonite–monzodiorite intrusions in the early Miocene and andesitic lava eruptions in the Pliocene. Sabalan is an enormous stratovolcano with a large central structure built on a structural horst under intrusive and effusive volcanic rocks (Seyed Rahimi-Niaraq et al. Reference Seyed Rahimi-Niaraq, Mohammadzadeh Bina and Itoi2021). The magma output had a significant role in forming a caldera in the central Sabalan volcano in the Pliocene and early Pleistocene (Didon & Gemain Reference Didon and Gemain1976).
2.3. Geology of the study area
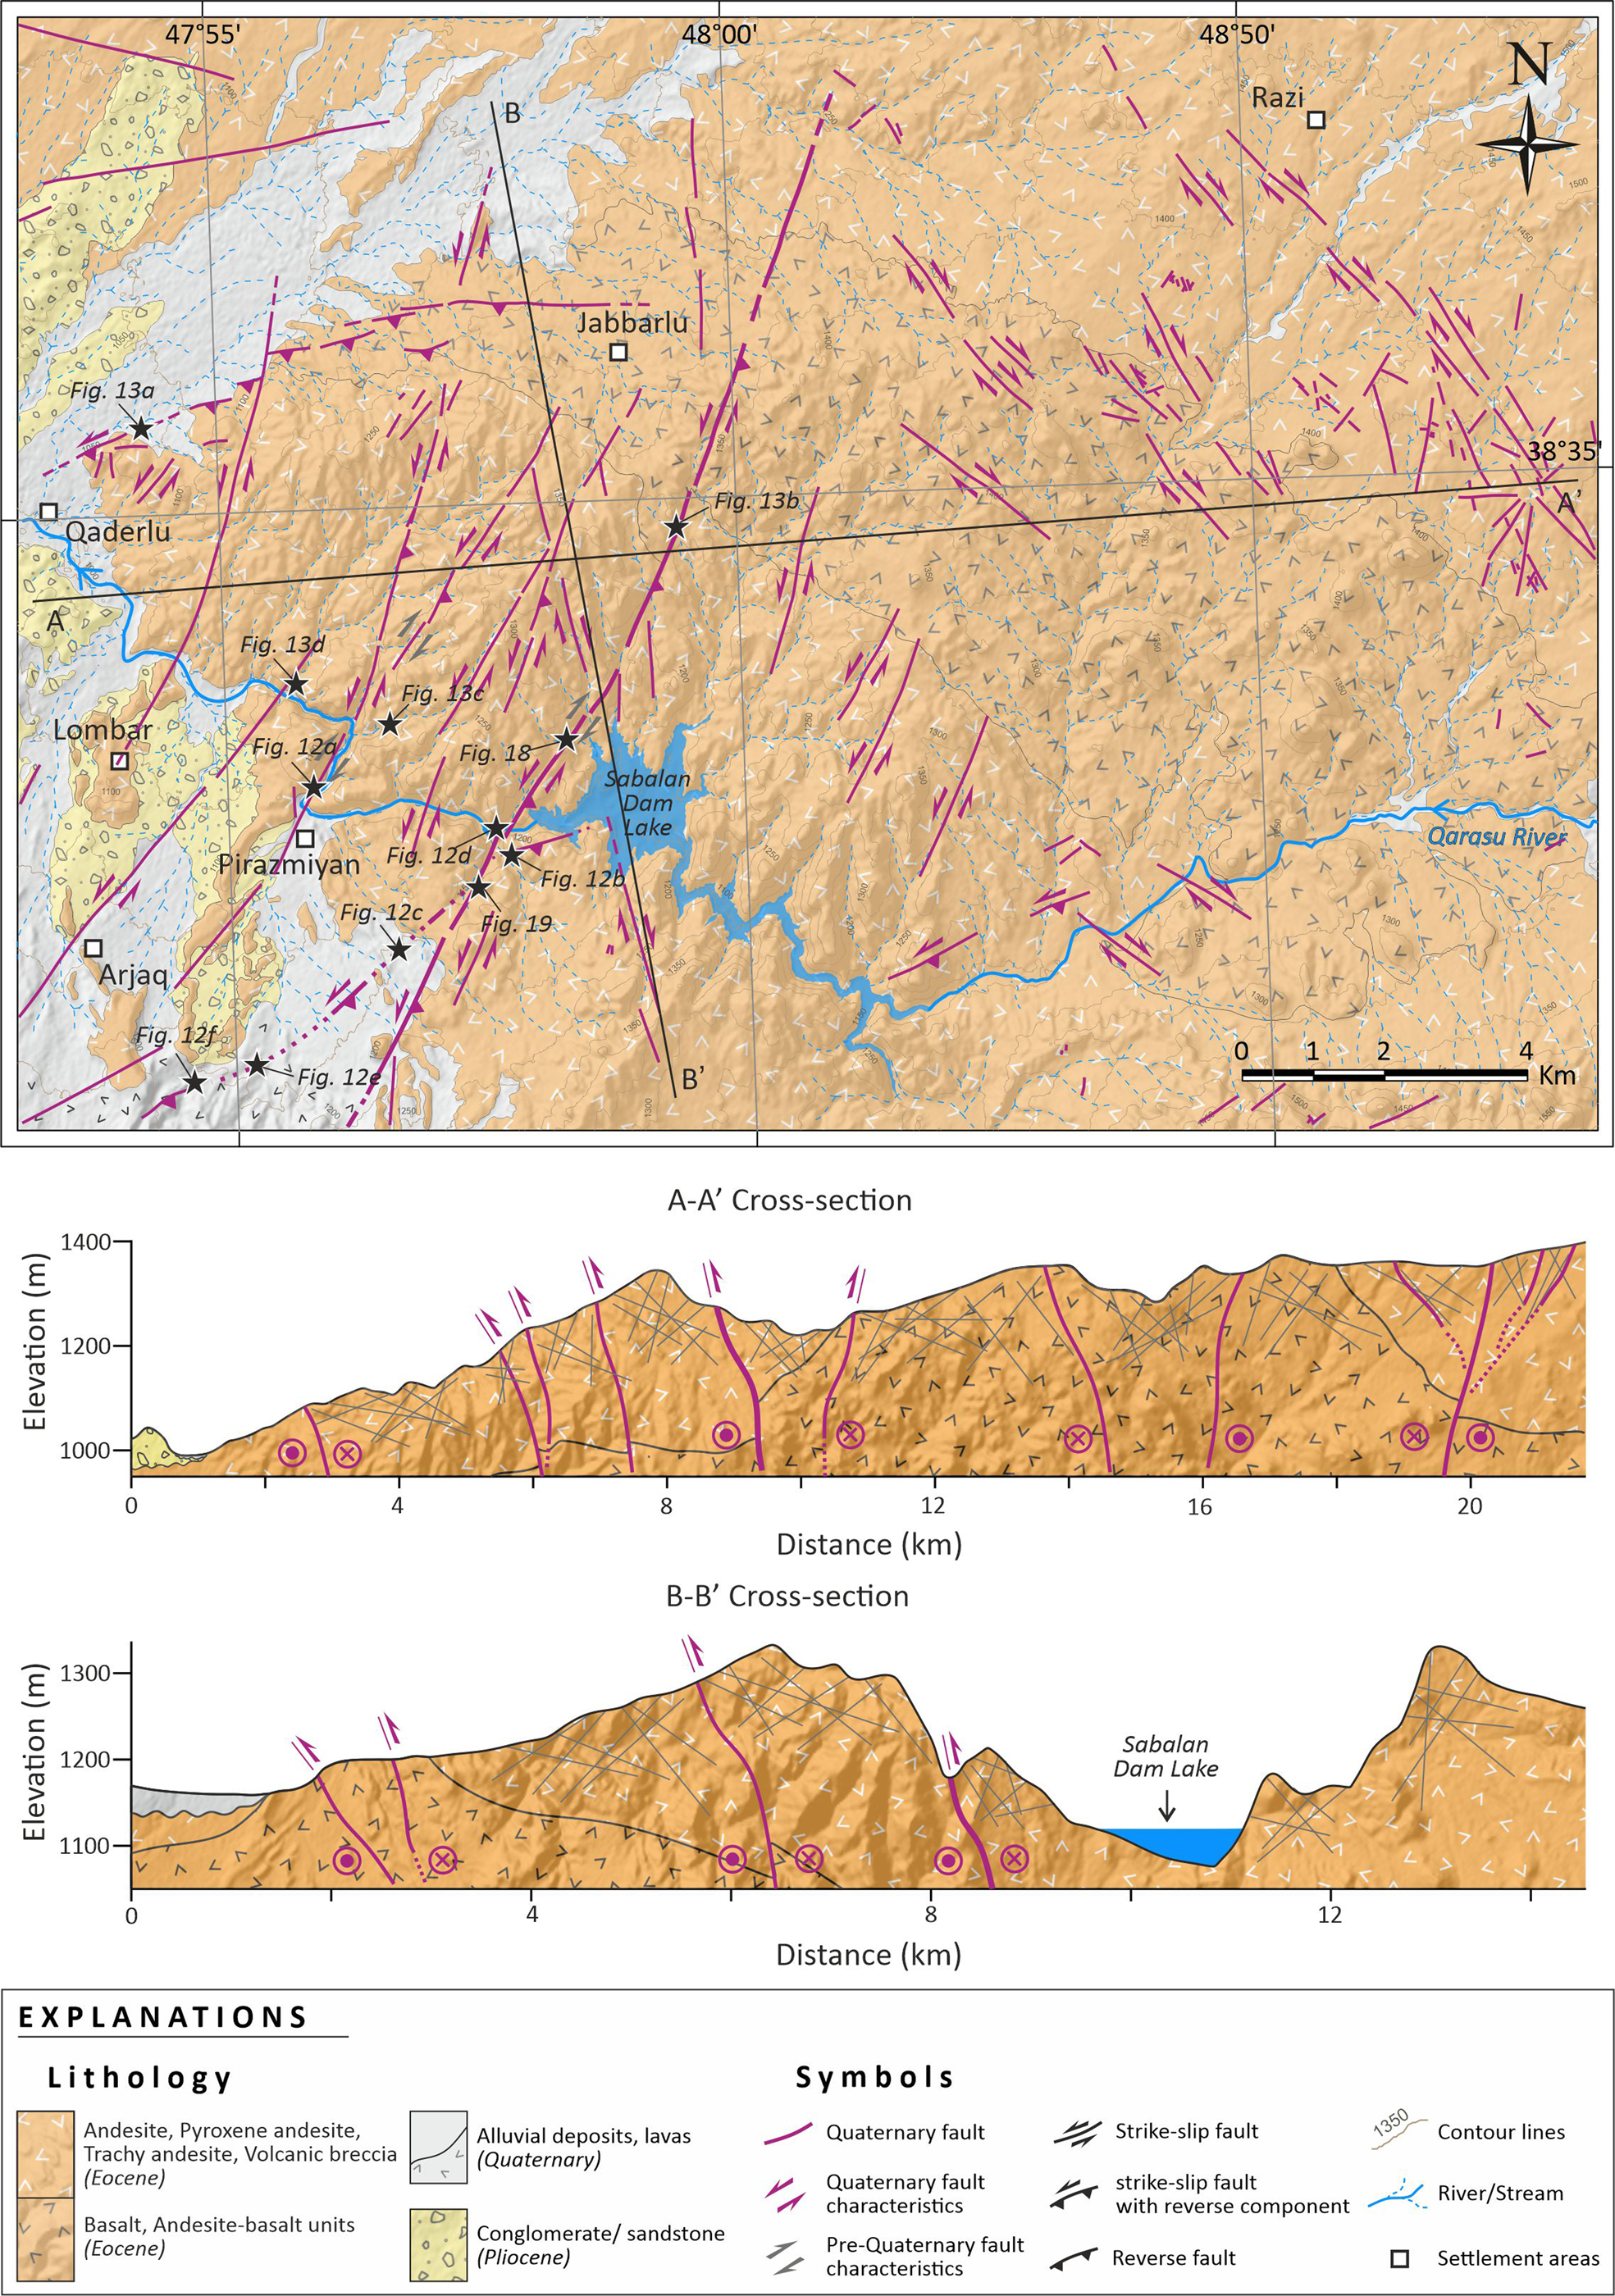
The study area generally contains Eocene volcanic rocks, covering about 85% of the total area (Fig. 2). These units start with basalt and andesite–basalt units at the base and continue as andesite, pyroxene andesite, trachyandesite, volcanic breccia and megaporphyric lavas to the upper parts (Fig. 2). The basaltic rocks mainly have a shoshonitic composition, whereas the amphibole-bearing basalt and andesitic units demonstrate calc-alkaline and adakitic compositions, respectively (Fathollahi & Kheirkhah Reference Fathollahi and Kheirkhah2015). Based on the geochemical data, the basaltic rocks originated from different degrees of partial melting of a heterogeneous lithospheric mantle metasomatised by subduction agents (Fathollahi & Kheirkhah Reference Fathollahi and Kheirkhah2015). By contrast, the adakitic rocks were generated from the partial melting of thickened potassic mafic lower crust metamorphosed to the eclogitic facies (Fathollahi & Kheirkhah Reference Fathollahi and Kheirkhah2015). The Pliocene and Quaternary units mainly consist of volcanogenic conglomerates, volcanic lavas, terrace deposits and unconsolidated alluvial sediments distributed in limited parts of the study area (Fig. 2).
Geological map and cross-sections showing the major lithological and structural features of the study area.
3. Methodology and results
Morphometric indices are valuable tools for estimating relative tectonic activity because they provide an opportunity for rapid assessments. These indices have been widely used in studies of active tectonics (e.g., Bull & McFadden Reference Bull, McFadden and Doehring1977; Keller & Pinter Reference Keller and Pinter2002; Selcuk Reference Selcuk2016; Saber et al. Reference Saber, Caglayan and Isık2018, Reference Saber, Isik and Caglayan2020; Topal Reference Topal2019; Moumeni et al. Reference Moumeni, Nozaem and Dehbozorgi2021). In the present study, the basins and streams were extracted from a digital elevation model (DEM) with a 30 m resolution and satellite images (Google Earth). The geomorphic indices were calculated and analysed using the MATLAB-based TecDEM toolbox (Shahzad & Gloaguen Reference Shahzad and Gloaguen2011) and TopoToolbox (Schwanghart & Scherler Reference Schwanghart and Scherler2014), ArcGIS (10.3) modules and illustrated using graphic programs such as CorelDraw 17.
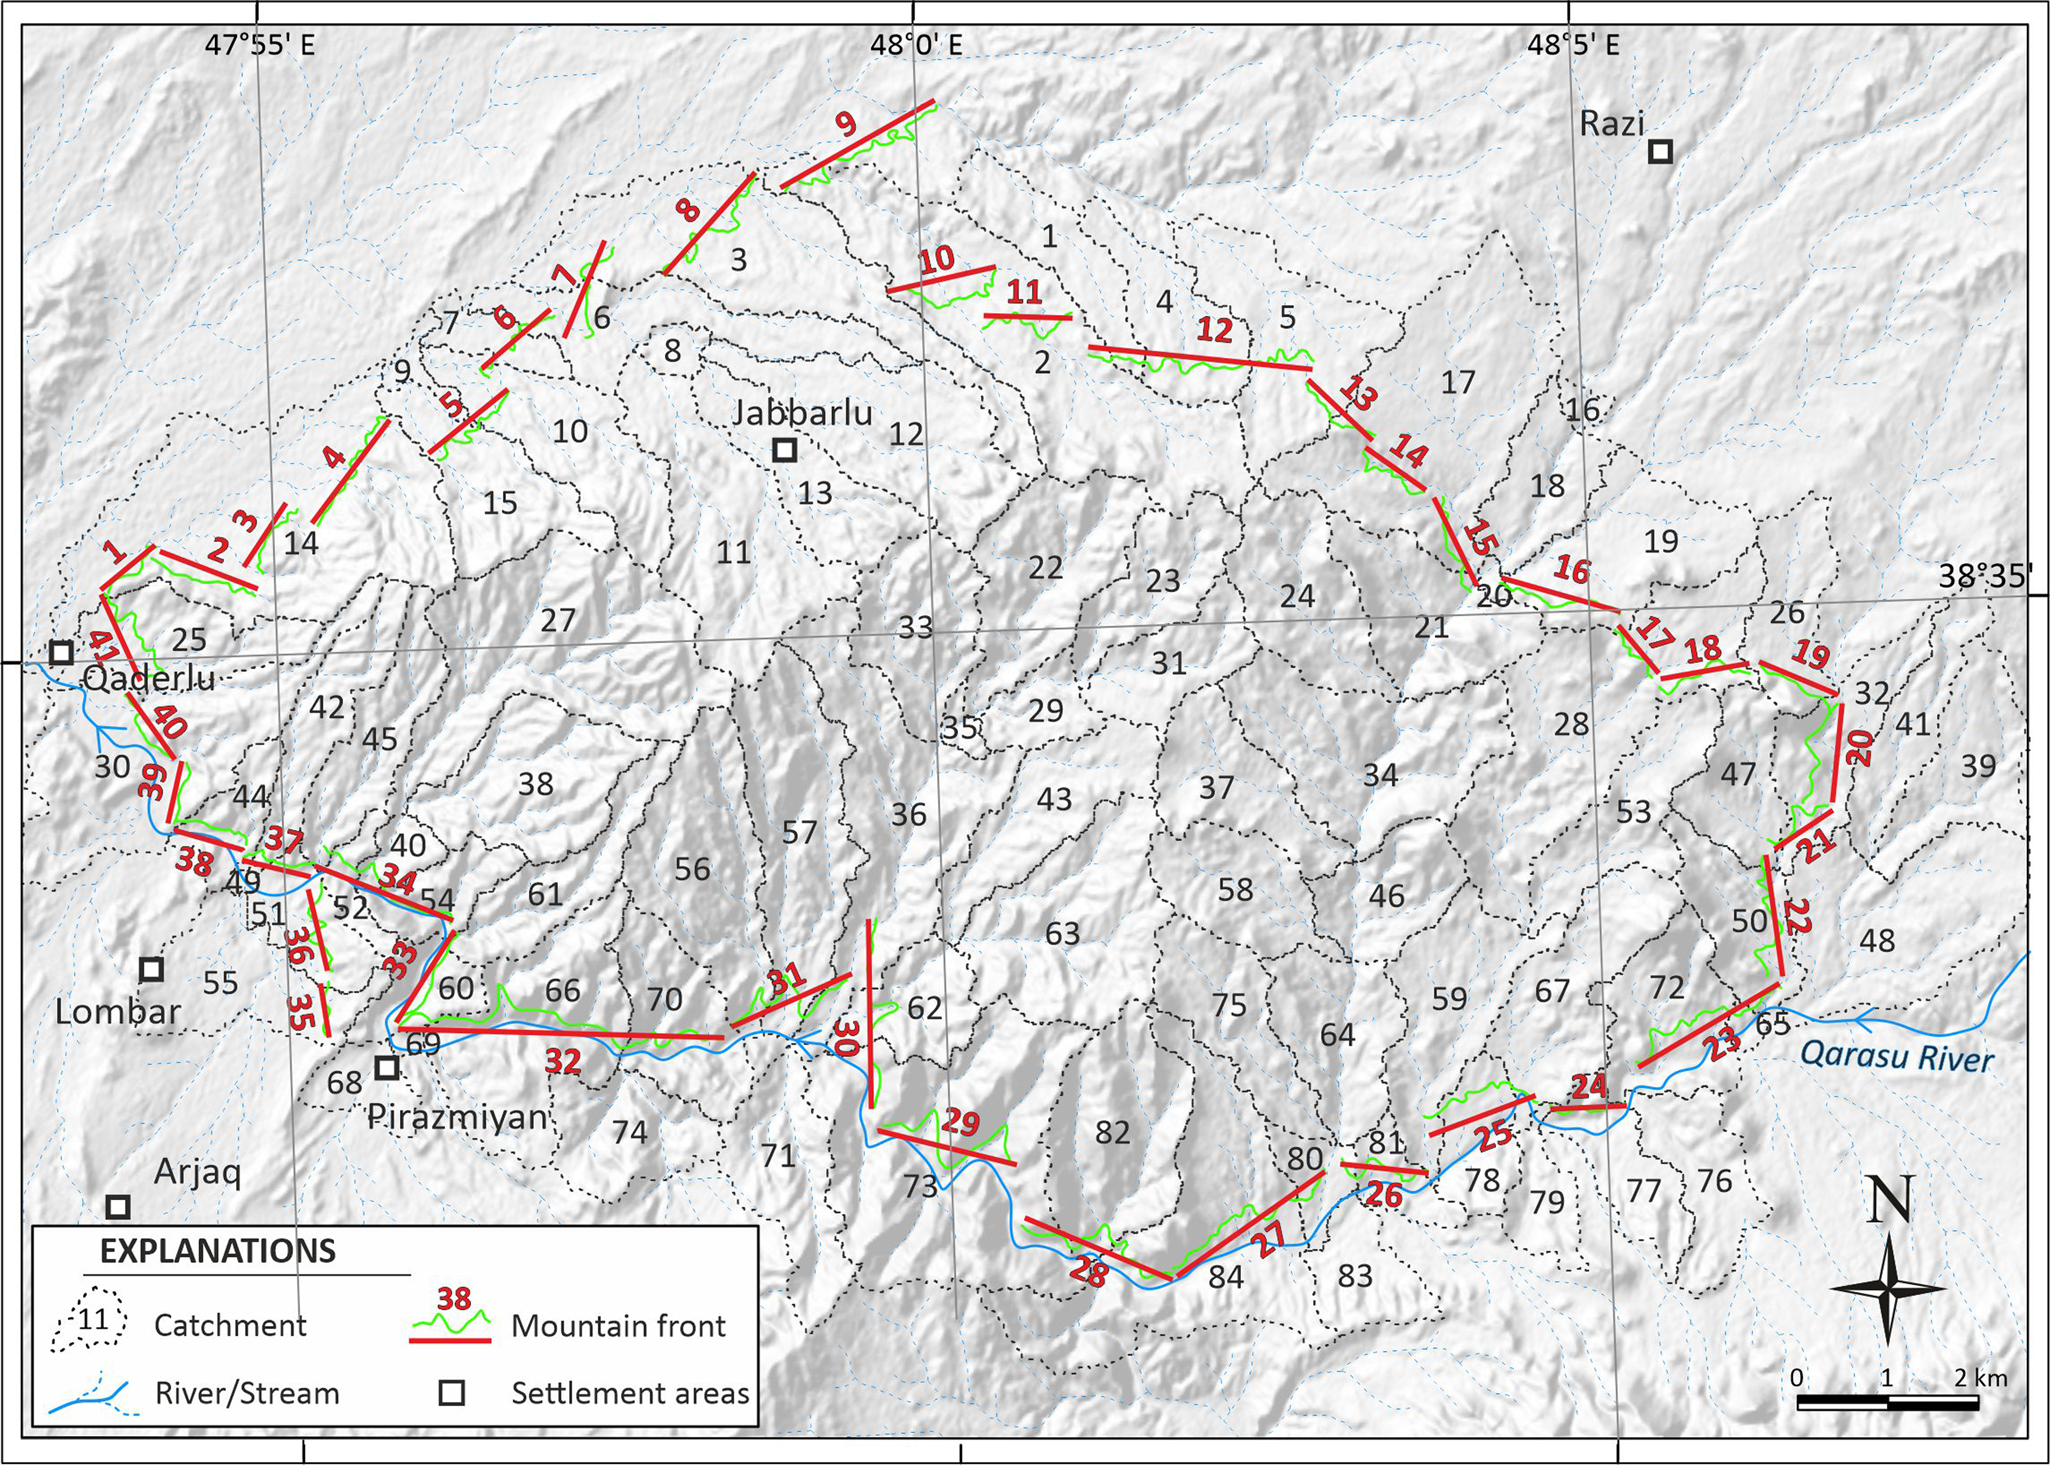
We selected 84 catchments along the study area based on the Strahler order of seven. The hypsometric integral (Hi), stream length–gradient index (Sl), normalised steepness index (Ksn), valley floor width to height ratio (Vf), mountain front sinuosity (Smf), asymmetry factor (Af) and index of drainage basin shape (Bs) were calculated for all 84 catchments (Fig. 3). We also determined the Smf for selected mountain fronts (Fig. 3). Most of the drainage basins are located on uniform Eocene volcanic rocks and the rock resistance level was assumed to be high over the whole study area.
Digital elevation model showing sub-basins in the Sabalan area. The dashed lines and digits indicate basin divides and numbers, respectively. Red and green lines with digits indicate measured mountain fronts.
We separated the faults and other fractures by type and strike and plotted all the data on rose diagrams using Rockworks 16 software. The automatic fracture extraction method was applied using Geomatica 13, ArcGIS 10.3, Rockworks 16 and 12 m ALOS DEM data. To avoid errors, unrelated morphological (e.g., streams, ridge lines and valleys) and artificial (e.g., roads, dams and buildings) lineaments were excluded during fracture analysis. In addition, we used the multiple inverse method (Yamaji Reference Yamaji2000) implemented in MIM software for fault slip data obtained from the field to distinguish different stress regimes.
3.1. Morphometric indices
3.1.1. Hypsometric integral/curve
The value of the HI describes the relative distribution of elevation in a given area of a landscape, such as a drainage basin (Strahler Reference Strahler1952), and is defined as the area beneath the hypsometric curve (Strahler Reference Strahler1952; Keller & Pinter Reference Keller and Pinter2002). With this, the hypsometric curve defines the height/area distribution of the drainage area (Strahler Reference Strahler1952; Keller & Pinter Reference Keller and Pinter2002). To calculate the HI index, we have used a simple equation (Pike & Wilson Reference Pike and Wilson1971; Mayer Reference Mayer and Wallace1986; Keller & Pinter Reference Keller and Pinter2002):
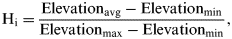
where Hi is the hypsometric integral, Elevationavg is the average elevation, and Elevationmin and Elevationmax are the lowest and highest elevations of the basin, respectively. Here, a hypsometric integral of 1 indicates a young drainage basin, 0.5 indicates an equilibrium basin and 0 indicates maturity in the drainage basin (Panek Reference Panek2004). We categorised the results of this index into three classes: class 1 or convex curves (Hi ≥ 0.5), class 2 (0.4 ≤ Hi < 0.5) and class 3 or concave curves (Hi < 0.4).
The calculated values of Hi in the Sabalan area varied between 0.21 and 0.69 (Fig. 4). Higher values of Hi, representing deeply excavated young drainage basins, were primarily observed in the SW of the study area, which is affected by severe faulting and the intense formation of fractures. By contrast, the Hi values of the drainage basins located in the northern and southeastern study area were primarily low, except for some basins with relatively high values (basins 16, 19, 22, 29, 50, 67 and 83). The highest Hi value of 0.21 was obtained for basin 73, whereas the lowest value was measured as 0.69 for basin 43. Statistically, 19 basins (23%) belonged to class 1, showing convex curves with Hi values >0.5, 23 basins (27%) were categorised as class 2, with straight or S-shaped curves and Hi values of 0.4–0.5, and 42 basins (50%) showed convex curves with Hi <0.4, indicating class 3 tectonic activity.
Map showing the classification of the hypsometric integral values. Diagrams show hypsometric curves for each sub-basin.
3.1.2. Stream length–gradient index
Tectonic processes such as uplift make hill slopes steeper and accelerate erosion in drainage basins (Bull Reference Bull2007). As one of the most widely used morphometric indices, the Sl index is related to erosional and depositional processes and uses a quantitative approach. This index is used to evaluate the relationships between tectonic activity, rock resistance and topography along the drainage basin and is an effective tool with which to assess river channels because it is susceptible to variations in the channel slope (Troiani & Della Seta Reference Troiani and Della Seta2008). The Sl index is defined as (Hack Reference Hack1973; Keller & Pinter Reference Keller and Pinter2002; Bull Reference Bull2007):

where Δh is the change in height of the branch, Δl is the branch length and l is the channel length upstream from the midpoint of the reach to the river head. Sudden changes in the Sl index may represent tectonic uplift or lithological changes along the drainage basin. We correlated anomalous Sl values with lithological and structural features extracted from a detailed geological map of the study area. The anomalies caused by tectonic features were distinguished from those affected by lithological changes in the drainage networks (Fig. 5).
Results of the stream length–gradient (Sl) index analysis in the Sabalan area. The classifications of the Sl index classes are shown in the inset.
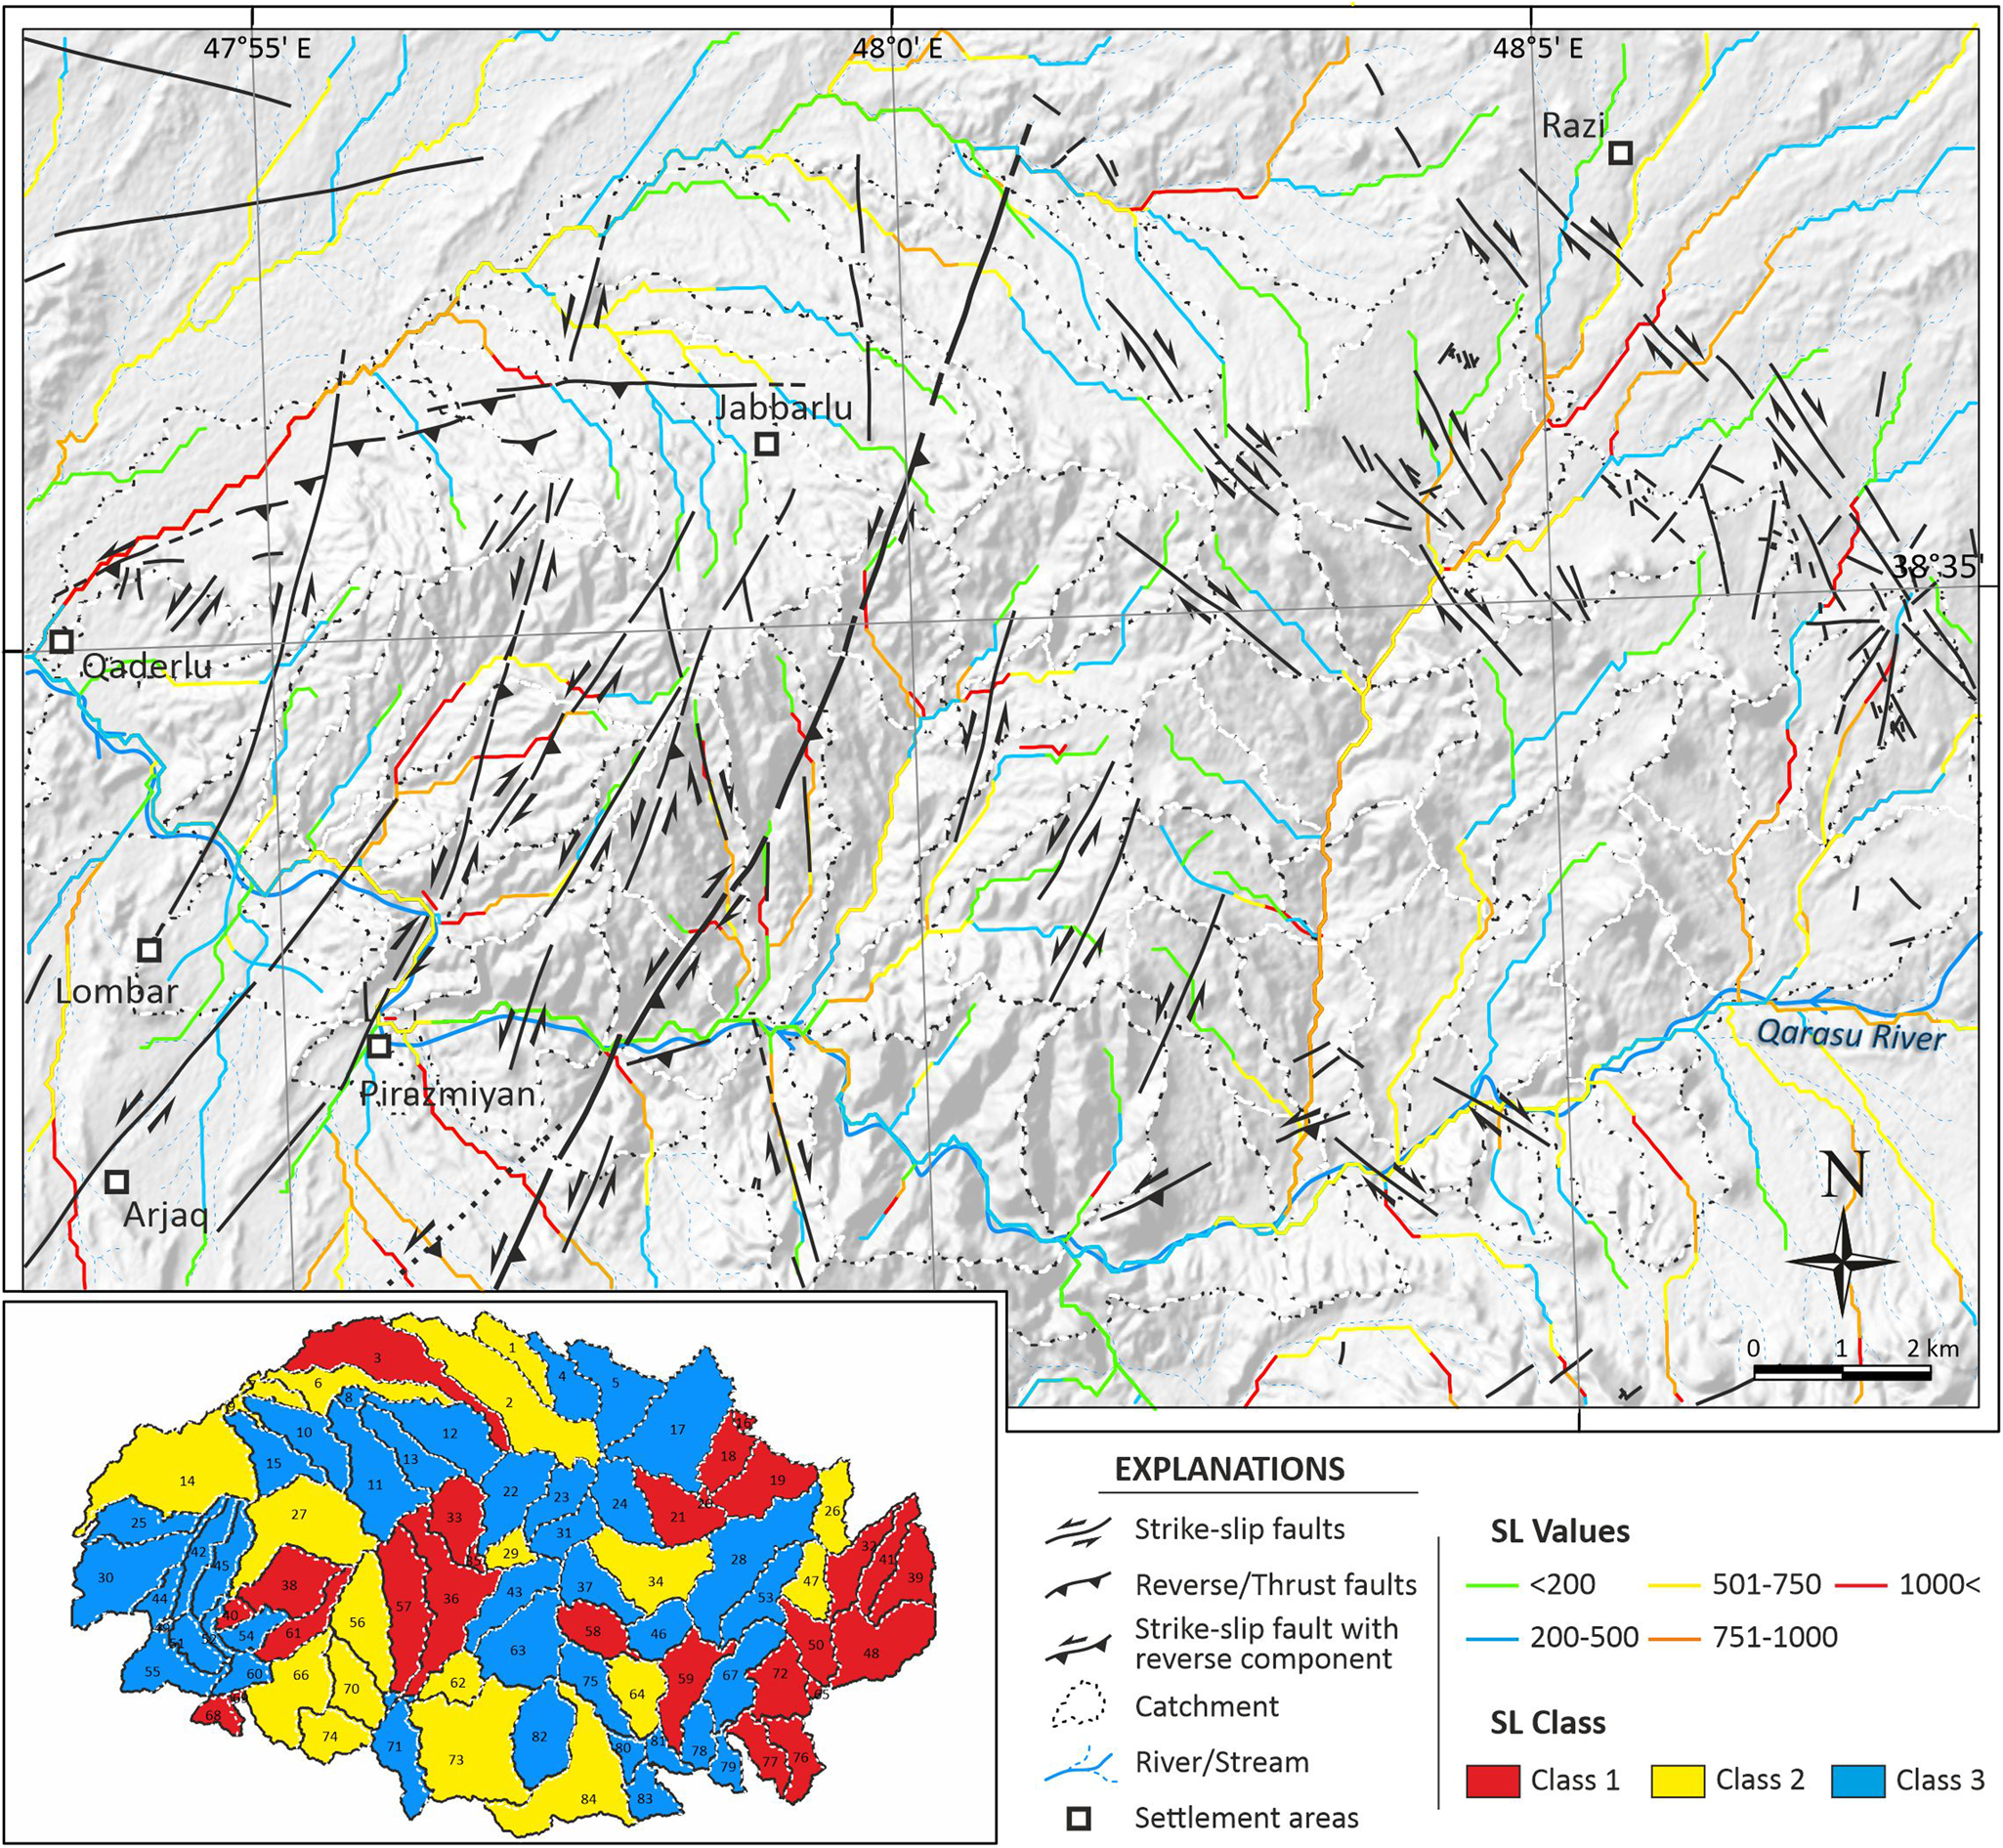
The Sl values vary from 3.1 (basin 5) to 1233 (basin 61) (Fig. 5). Although nearly all of the basins were located on homogenous geological units with similar rock resistance ratios (andesite, andesitic basalt and basalt), the Sl anomalies caused by lithological differences were fairly limited (e.g., basins 3, 6, 7, 8, 9, 10, 14 and 15) and were observed in the contacts between Eocene volcanites and Quaternary deposits. By contrast, the Sl anomalies resulting from tectonic activities such as faulting were dominant (Fig. 5). In the study area, 25 basins (30%) belonged to class 1 with high tectonic activity, 19 basins (19%) fell into class 2 with moderate tectonic activity and 40 basins (40%) were identified as class 3, indicating low tectonic activity (Fig. 5).
3.1.3. Normalised steepness index
The stream profile method has proved to be an invaluable qualitative tool in neotectonic investigations to understand the varied processes contributing to fluvial erosion (Sukhishvili et al. Reference Sukhishvili, Forte, Merebashvili, Leonard, Whipple, Javakhishvili, Heimsath and Godoladze2020). In context, the steepness index is the slope of a channel or channel segment that is normalised to its drainage area (e.g., Hack Reference Hack1973; Flint Reference Flint1974). Thus the steepness index can be described by an empirical power law relationship between slope and area:

where S is the local channel slope, Ksn is the normalised steepness index, A is the upstream contributing drainage area and θ is the channel concavity index (Flint Reference Flint1974). The Ksn index is often used because the concavity index (θ) is relatively insensitive to differences in the rock uplift rate, the climate or the substrate lithology in the steady state, which makes it a useful metric for tectonic geomorphology studies (e.g., Merritts & Vincent Reference Merritts and Vincent1989; Whipple & Tucker Reference Whipple and Tucker1999; Snyder et al. Reference Snyder, Whipple, Tucker and Merritts2000; Kirby & Whipple Reference Kirby and Whipple2001; Sukhishvili et al. Reference Sukhishvili, Forte, Merebashvili, Leonard, Whipple, Javakhishvili, Heimsath and Godoladze2020). This study set θ ref as 0.45 because this is within the range commonly observed in bedrock channels regardless of uplift and erosion rates (θ ref 0.30–0.60; Kirby & Whipple Reference Kirby and Whipple2001; Wobus et al. Reference Wobus, Whipple, Kirby, Snyder, Johnson, Spyropolou, Crosby, Sheehan, Willett, Hovius, Brandon and Fisher2006; Castillo et al. Reference Castillo, Castelli and Entekhabi2014).
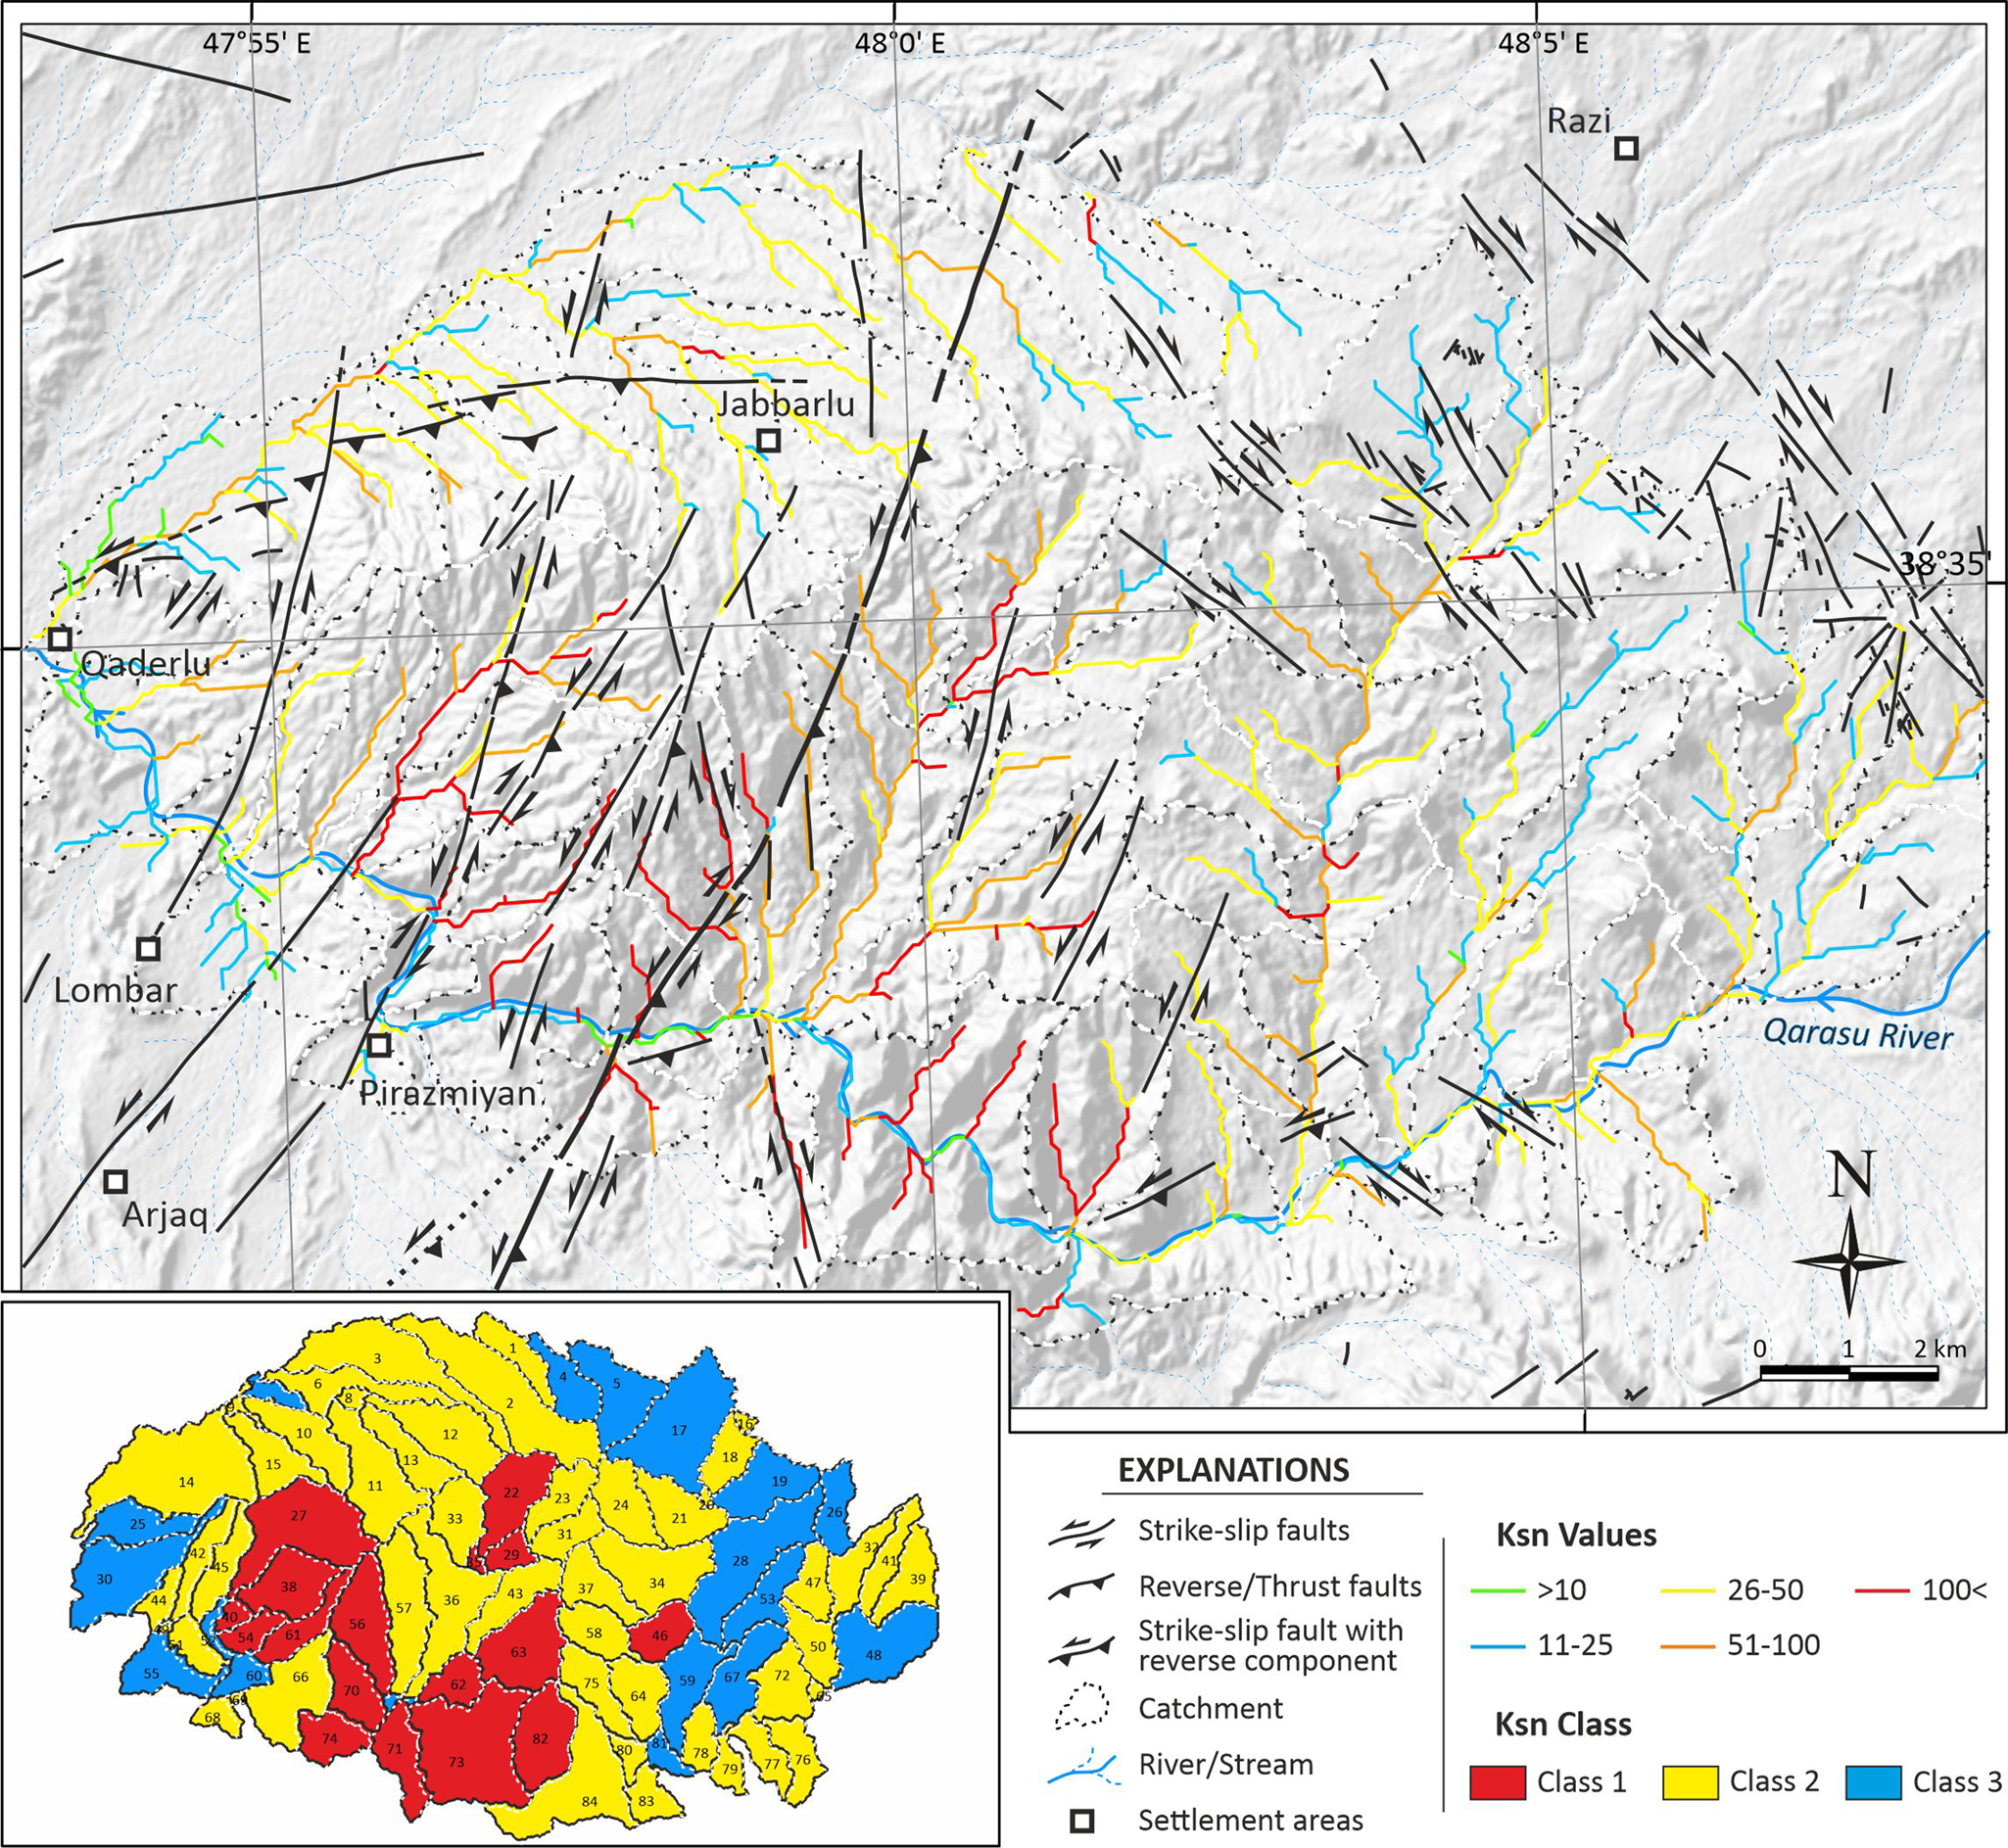
Our Ksn results show a significant concentration of high values in the central and southern study area and relatively lower values in the northern and eastern study area (Fig. 6). Except for some anomalously high Ksn values, steepening areas in the NW part of the study area are mainly restricted to lithologically controlled knickpoints on the downstream end of the channels (e.g., basins 8 and 9). In the central and southwestern study area, the distribution of high Ksn values is mostly related to tectonic activities. In some cases (e.g., basins 27, 38 and 61), high values are not limited to major knick points/knick zones, but are spread along the whole watershed area, demonstrating the probable width of the fault zone or the fractured area. The obtained Ksn values show that 17 basins (20%) belong to class 1, indicating high tectonic activity, whereas 49 (58%) and 18 (22%) basins represent classes 2 and 3, with moderate and low tectonic activity ratios, respectively (Fig. 6).
Distribution of normalised steepness index (Ksn) values in the Sabalan area. The classifications of the Ksn index classes are shown in the inset.
3.1.4. Valley floor width to height ratio
The valley floor width to valley height ratio (Bull & McFadden Reference Bull, McFadden and Doehring1977) is a discrimination index to distinguish U-shaped valleys from V-shaped valleys and is an important morphometric index susceptible to tectonic uplift (Bull Reference Bull2007). This index is calculated using the equation (e.g., Bull Reference Bull1977, Reference Bull2007; Keller & Pinter Reference Keller and Pinter2002):

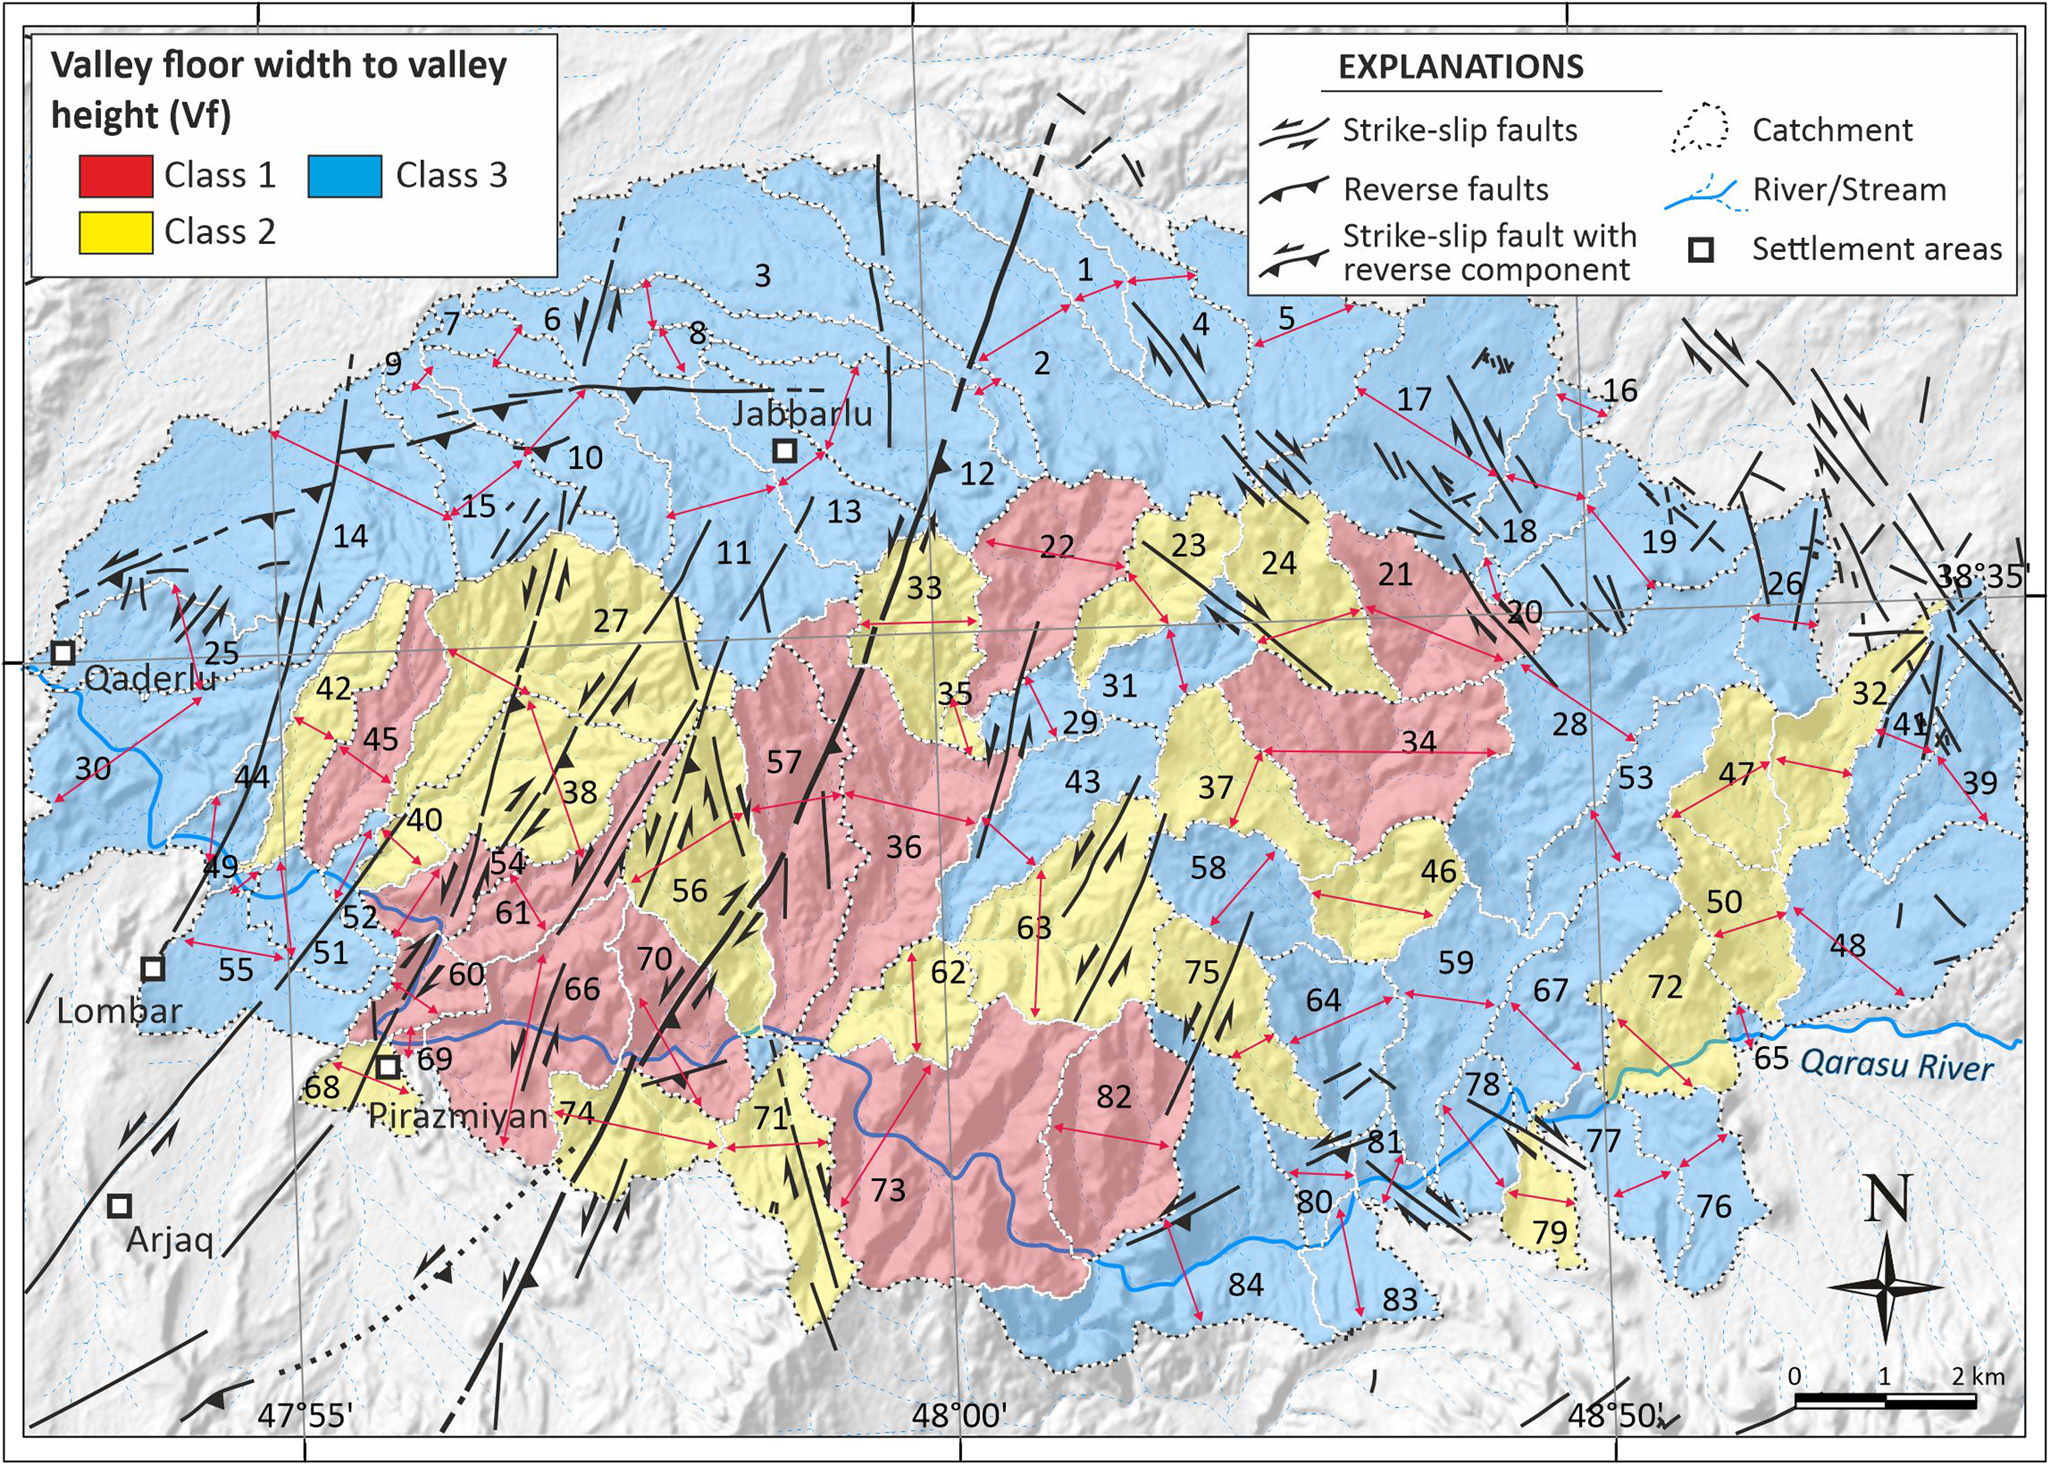
where Vfw is the width of the valley floor, Eld and Erd represent the elevations of the left- and right-hand valley watersheds looking downstream, respectively, and Esc indicates the stream channel or valley floor elevation. V-shaped valleys with low Vf values (<1) indicate that the drainage basins developed in response to uplift events as a result of tectonic activity. By contrast, broad U-shaped or relatively flat valleys with high Vf values (>1) demonstrate valleys with dominant lateral erosion due to base level stability or tectonic quiescence (Silva et al. Reference Silva, Goy, Zazo and Bardají2003).
The Vf values vary from 0.24 (basin 61) to 1.70 (basin 25) (Fig. 7). Most of the measured valleys in the central parts of the study area are deeply excavated V-shaped valleys, whereas the valleys located in the east, north and west represent dominantly U-shaped valleys. These areas also indicate relatively low altitudes in the central parts. Accordingly, 14 basins (17%) belong to class 1 (tectonically active), 22 basins (26%) to class 2 (moderate tectonic activity) and 48 basins (57%) to class 3 (low tectonic activity).
Map of the valley floor width to valley height ratio (Vf) index classification results in the Sabalan area. Red arrows show locations where Vf values were measured.
3.1.5. Mountain front sinuosity
River incision processes generally tend to incise the embayment into a mountain front; by contrast, tectonic forces tend to create straight mountain fronts (Bull & McFadden Reference Bull, McFadden and Doehring1977). The Smf index demonstrates an equilibrium between these two factors. This index is therefore suitable for determining tectonic activity and the morphological evolution of a mountain front controlled by faulting (Keller & Pinter Reference Keller and Pinter2002). It is expressed as:
where Lmf is the length of the mountain front along the foot of the mountain and Ls is the straight-line length of the mountain front (Bull & McFadden Reference Bull, McFadden and Doehring1977; Bull Reference Bull2007). Relatively straight fronts and low values of Smf (values tend to be 1) indicate uplifted mountain fronts with dominant tectonic activity, whereas mountain fronts that exhibit distinct sinuous shapes and higher values of Smf are related to the areas with relatively lower tectonic activity and dominant erosional processes (e.g., Bull & McFadden Reference Bull, McFadden and Doehring1977; Keller & Pinter Reference Keller and Pinter2002; Perez-Pena et al. Reference Perez-Pena, Azor, Azanon and Keller2010; Saber et al. Reference Saber, Caglayan and Isık2018, Reference Saber, Isik and Caglayan2020; Moumeni et al. Reference Moumeni, Nozaem and Dehbozorgi2021).
Although the role of buried/unidentified faults in shaping the uplifted landscape of the study area is unknown, we have calculated Smf values in 41 locations (Fig. 3) based on the linear continuity of the mountain fronts and the design used successfully by Giaconia et al. (Reference Giaconia, Booth-Rea, Martínez-Martínez, Azañón, Pérez-Peña, Pérez-Romero and Villegas2012). The Smf results vary from 1.04 to 1.69, suggesting that tectonic processes are dominant in the measured mountain fronts. Thrity-one (76%) mountain fronts belong to class 1 of tectonic activity and 10 (24%) mountain fronts indicate intermediate tectonic activity of class 2. No measured mountain front belongs to class 3, demonstrating that tectonic activities are more effective than erosional processes in shaping mountain fronts around the Sabalan area.
Comparisons of the Smf and Vf values are commonly used to calculate the relative uplift rate of active mountain fronts (e.g., Rockwell et al. Reference Rockwell, Keller, Johnson and Morisawa1985; Mayer Reference Mayer and Wallace1986; Silva et al. Reference Silva, Goy, Zazo and Bardají2003; Bull Reference Bull2007). We therefore categorised the results into three classes: class 1 (uplift rate >0.5 mm year−1); class 2 (uplift rate 0.5–0.05 mm year−1); and class 3 (uplift rate <0.05 mm year−1) (Rockwell et al. Reference Rockwell, Keller, Johnson and Morisawa1985). Our results indicate that most of the fronts (37 mountain fronts) fall into class 1 and four mountain fronts are in class 2 (Fig. 8).
Chart showing the mountain front sinuosity (Smf) s versus the valley floor width to valley height ratio (Vf) and inferred activity classes. The measured mountain fronts are marked in Fig. 3. Numbers at the top indicate inferred uplift rates (mm year−1) from Rockwell et al. (Reference Rockwell, Keller, Johnson and Morisawa1985).

3.1.6. Asymmetry factor
Active tilting, bedding and foliation directions have an important role in controlling the basin asymmetry (Perez-Pena et al. Reference Perez-Pena, Azor, Azanon and Keller2010; Moumeni et al. Reference Moumeni, Nozaem and Dehbozorgi2021). Tilting might occur in response to fault activities that cause local or regional uplift. We therefore applied asymmetry factor (Af) analysis to assess the asymmetry conditions and detect tilting events, which might be related to active faulting in the study area of the drainage basins. The asymmetry factor is defined as

where Ar is the area of the basin to the right of the trunk stream (looking downstream) and At is the whole area of the drainage basin. For a stream network under stable conditions or with little tilting, the Af value is equal to 50, whereas values more or less than 50 under unstable regimes are considered as tilted drainage basins affected by active tectonics (Keller & Pinter Reference Keller and Pinter2002).
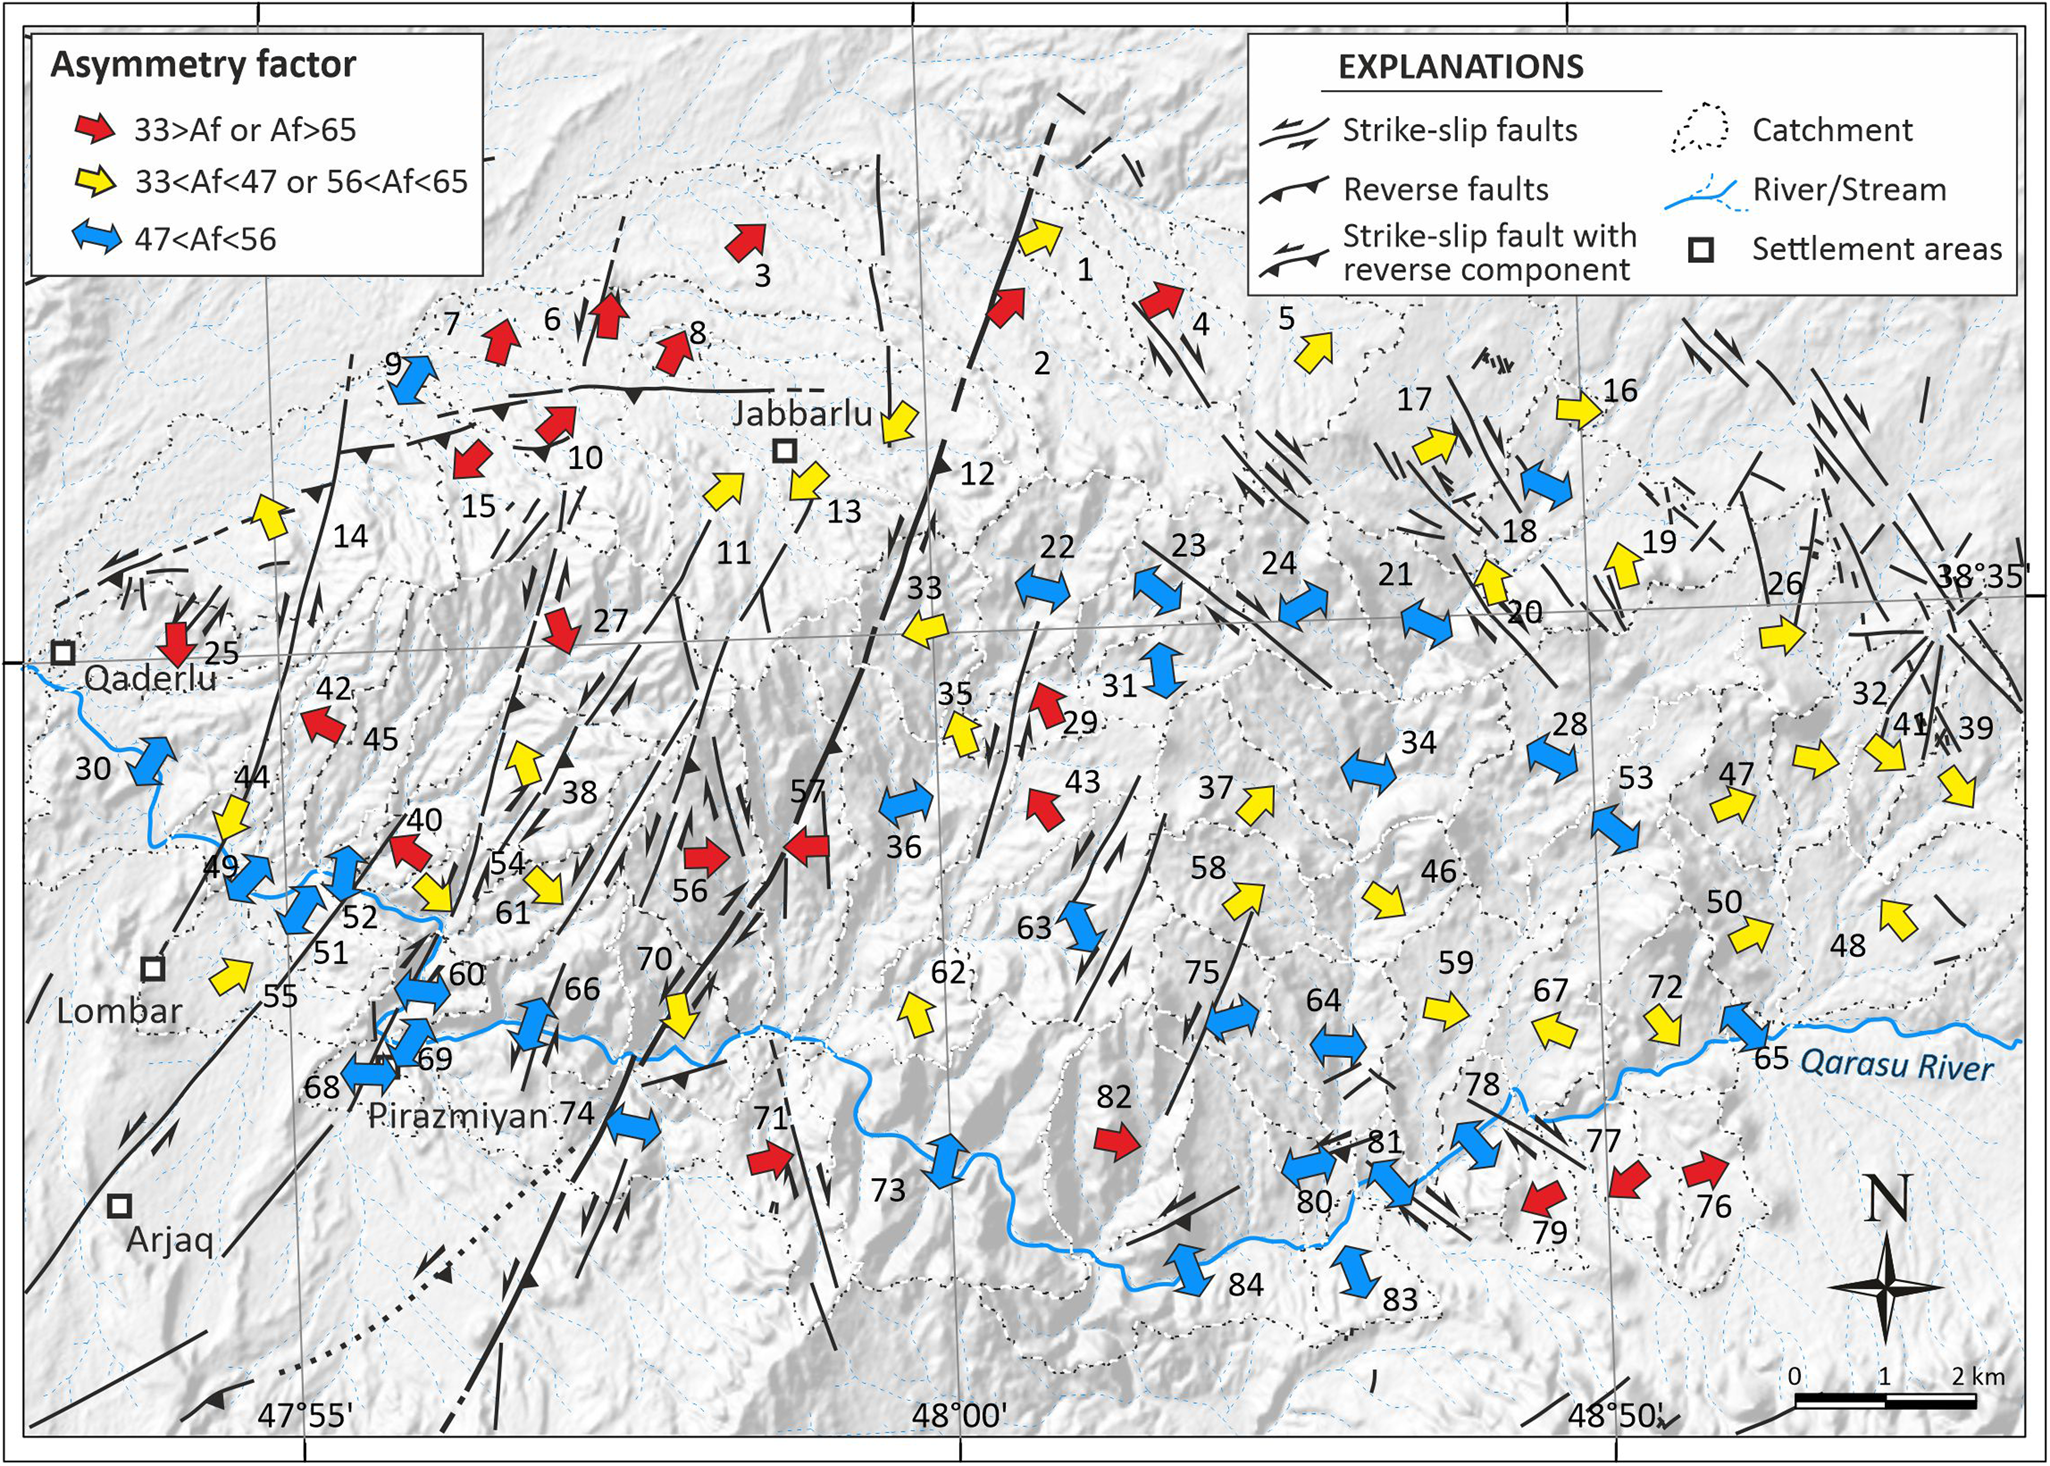
The Af values vary from 19 (basin 28) to 79 (basin 56) (Fig. 9). Except for basins located in the northern and central parts of the study area, most of the studied basins do not show systematic tilting events caused by tectonic activities (Fig. 9). However, basins in the northern and central parts of the study area show high amounts of tilt, especially those parallel to major active faults. The tilting directions in northern study area are primarily to the NE. Statistically, 21 basins (25%) belong to class 1, 20 basins (24%) to class 2 and 43 basins (43%) to class 3.
Classification of the asymmetry factor index (Af) in the Sabalan area. Arrows indicate tilting directions.
3.1.7. Index of drainage basin shape
Tectonic activities affect the shape of drainage basins over time. The basin shape index (Bs) (Bull & McFadden Reference Bull, McFadden and Doehring1977; Ramirez-Herrera Reference Ramirez-Herrera1998; El Hamdouni et al. Reference El Hamdouni, Irigaray, Fernández, Chacón and Keller2008) generally illustrates a discrepancy between basins considerably elongated due to tectonic activity and nearly circular basins, which are developed under steady conditions in the absence of effective tectonic processes. The Bs index is expressed as the ratio between the dimensions of the basin and is defined as:

where Bl is the distance between the lowest height of the drainage basin and its most elevated point and Bw is the width of the widest part of the drainage basin. Elongated drainage basins show high Bs values (Bs > 4) and relatively high tectonic activity, whereas circular basins have low values of Bs (Bs < 3) and relatively low tectonic activity. Bs values of 3 < Bs < 4 indicate the roughly equal role of tectonic and erosional processes.
The Bs values vary from 1.09 (basin 42) to 5.12 (basin 66) (Fig. 10), where 13 basins (15%) belong to class 1, 19 basins (23%) to class 2 and 52 basins (62%) to class 3 tectonic activity. Elongated basins are observed in the central and northern study area and are located around major faults, indicating the role of active tectonics in the evolution of basin shape and geometry. By contrast, the majority of round basins within the study area developed under erosion-dominated conditions.
Map illustrating the basin shape index (Bs) classification in the Sabalan area.

3.1.8. IAT and AHP
The results were evaluated using two different methods to estimate the relative tectonic activity in the Sabalan area. The first is the IAT method proposed by El Hamdouni et al. (Reference El Hamdouni, Irigaray, Fernández, Chacón and Keller2008), where the average values of the classes (S/n) obtained from all indices are divided into four groups with different activity levels: very high (1 ⩽ IAT < 1.5), high (1.5 ⩽ IAT < 2), moderate (2 ⩽ IAT < 2.5) and low (2.5 ⩽ IAT).
We also used the AHP method, one of the most frequently used methods for determining and ranking the importance of different factors (e.g., Alipoor et al. Reference Alipoor, Poorkermani, Zare and El Hamdouni2011; Argyriou et al. Reference Argyriou, Teeuw, Soupios and Apostolos Sarris2017; Jaberi et al. Reference Jaberi, Ghassemi, Shayan, Yamani and Zamanzadeh2018; Saber et al. Reference Saber, Caglayan and Isık2018, Reference Saber, Isik and Caglayan2020). The AHP is one of the most popular multi-criteria decision-making methods (Saaty Reference Saaty1980). The decision problem is modelled using a hierarchy in which the apex is the main effective index and indexes with less importance or the possible alternatives to be evaluated are located at the base. Because the evaluation processes of a landscape depend on various factors with different effects, weighting the factors based on their importance plays a crucial part in estimating the rate of tectonic/depositional processes.
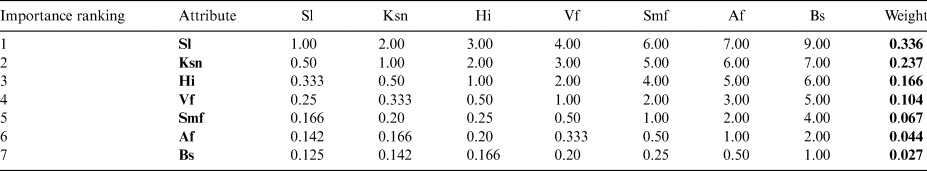
We used the AHP methodology to determine the weight of the criteria or the factors in our decision problem. This method uses a pairwise comparison of options to prioritise each criterion (Saaty Reference Saaty1980). First, we designed a logical chart of an issue where the goal, the appropriate criteria for reaching the target, and the desired options are being sought. In this method, the factors are compared and weighed in paired forms. For weighting, a scale of 1–9 is usually used for each factor. Values of 1, 3, 5, 7 and 9 indicate competence factors of the same, average, relatively strong, strong and very strong, while values of 2, 4, 6 and 8 are the preference values between these intervals. We gave higher weights to the Sl and Ksn indices, which are effective in evaluating the impact of tectonic activity on drainage basins (Table 1), and the lowest weight was given to the Bs index. The consistency ratio was 0.06, which indicates the high precision of expert opinions. The AHP results are divided into four classes: class 1 (highly active, 1.03 ⩽ AHP < 1.50); class 2 (active, 1.50 ⩽ AHP < 2); class 3 (moderately active, 2 ⩽ AHP < 2.50); and class 4 (slightly active, 2.50 ⩽ AHP < 2.955), based on the unique values obtained in this study.
Matrix table for weighing geomorphologic indices in order of importance. Sl (stream length–gradient index), Ksn (normalised steepness index), Hi (hypsometric integral), Vf (valley floor width–valley height ratio), Smf (mountain front sinuosity), Bs (drainage basin shape), Af (drainage basin asymmetry).
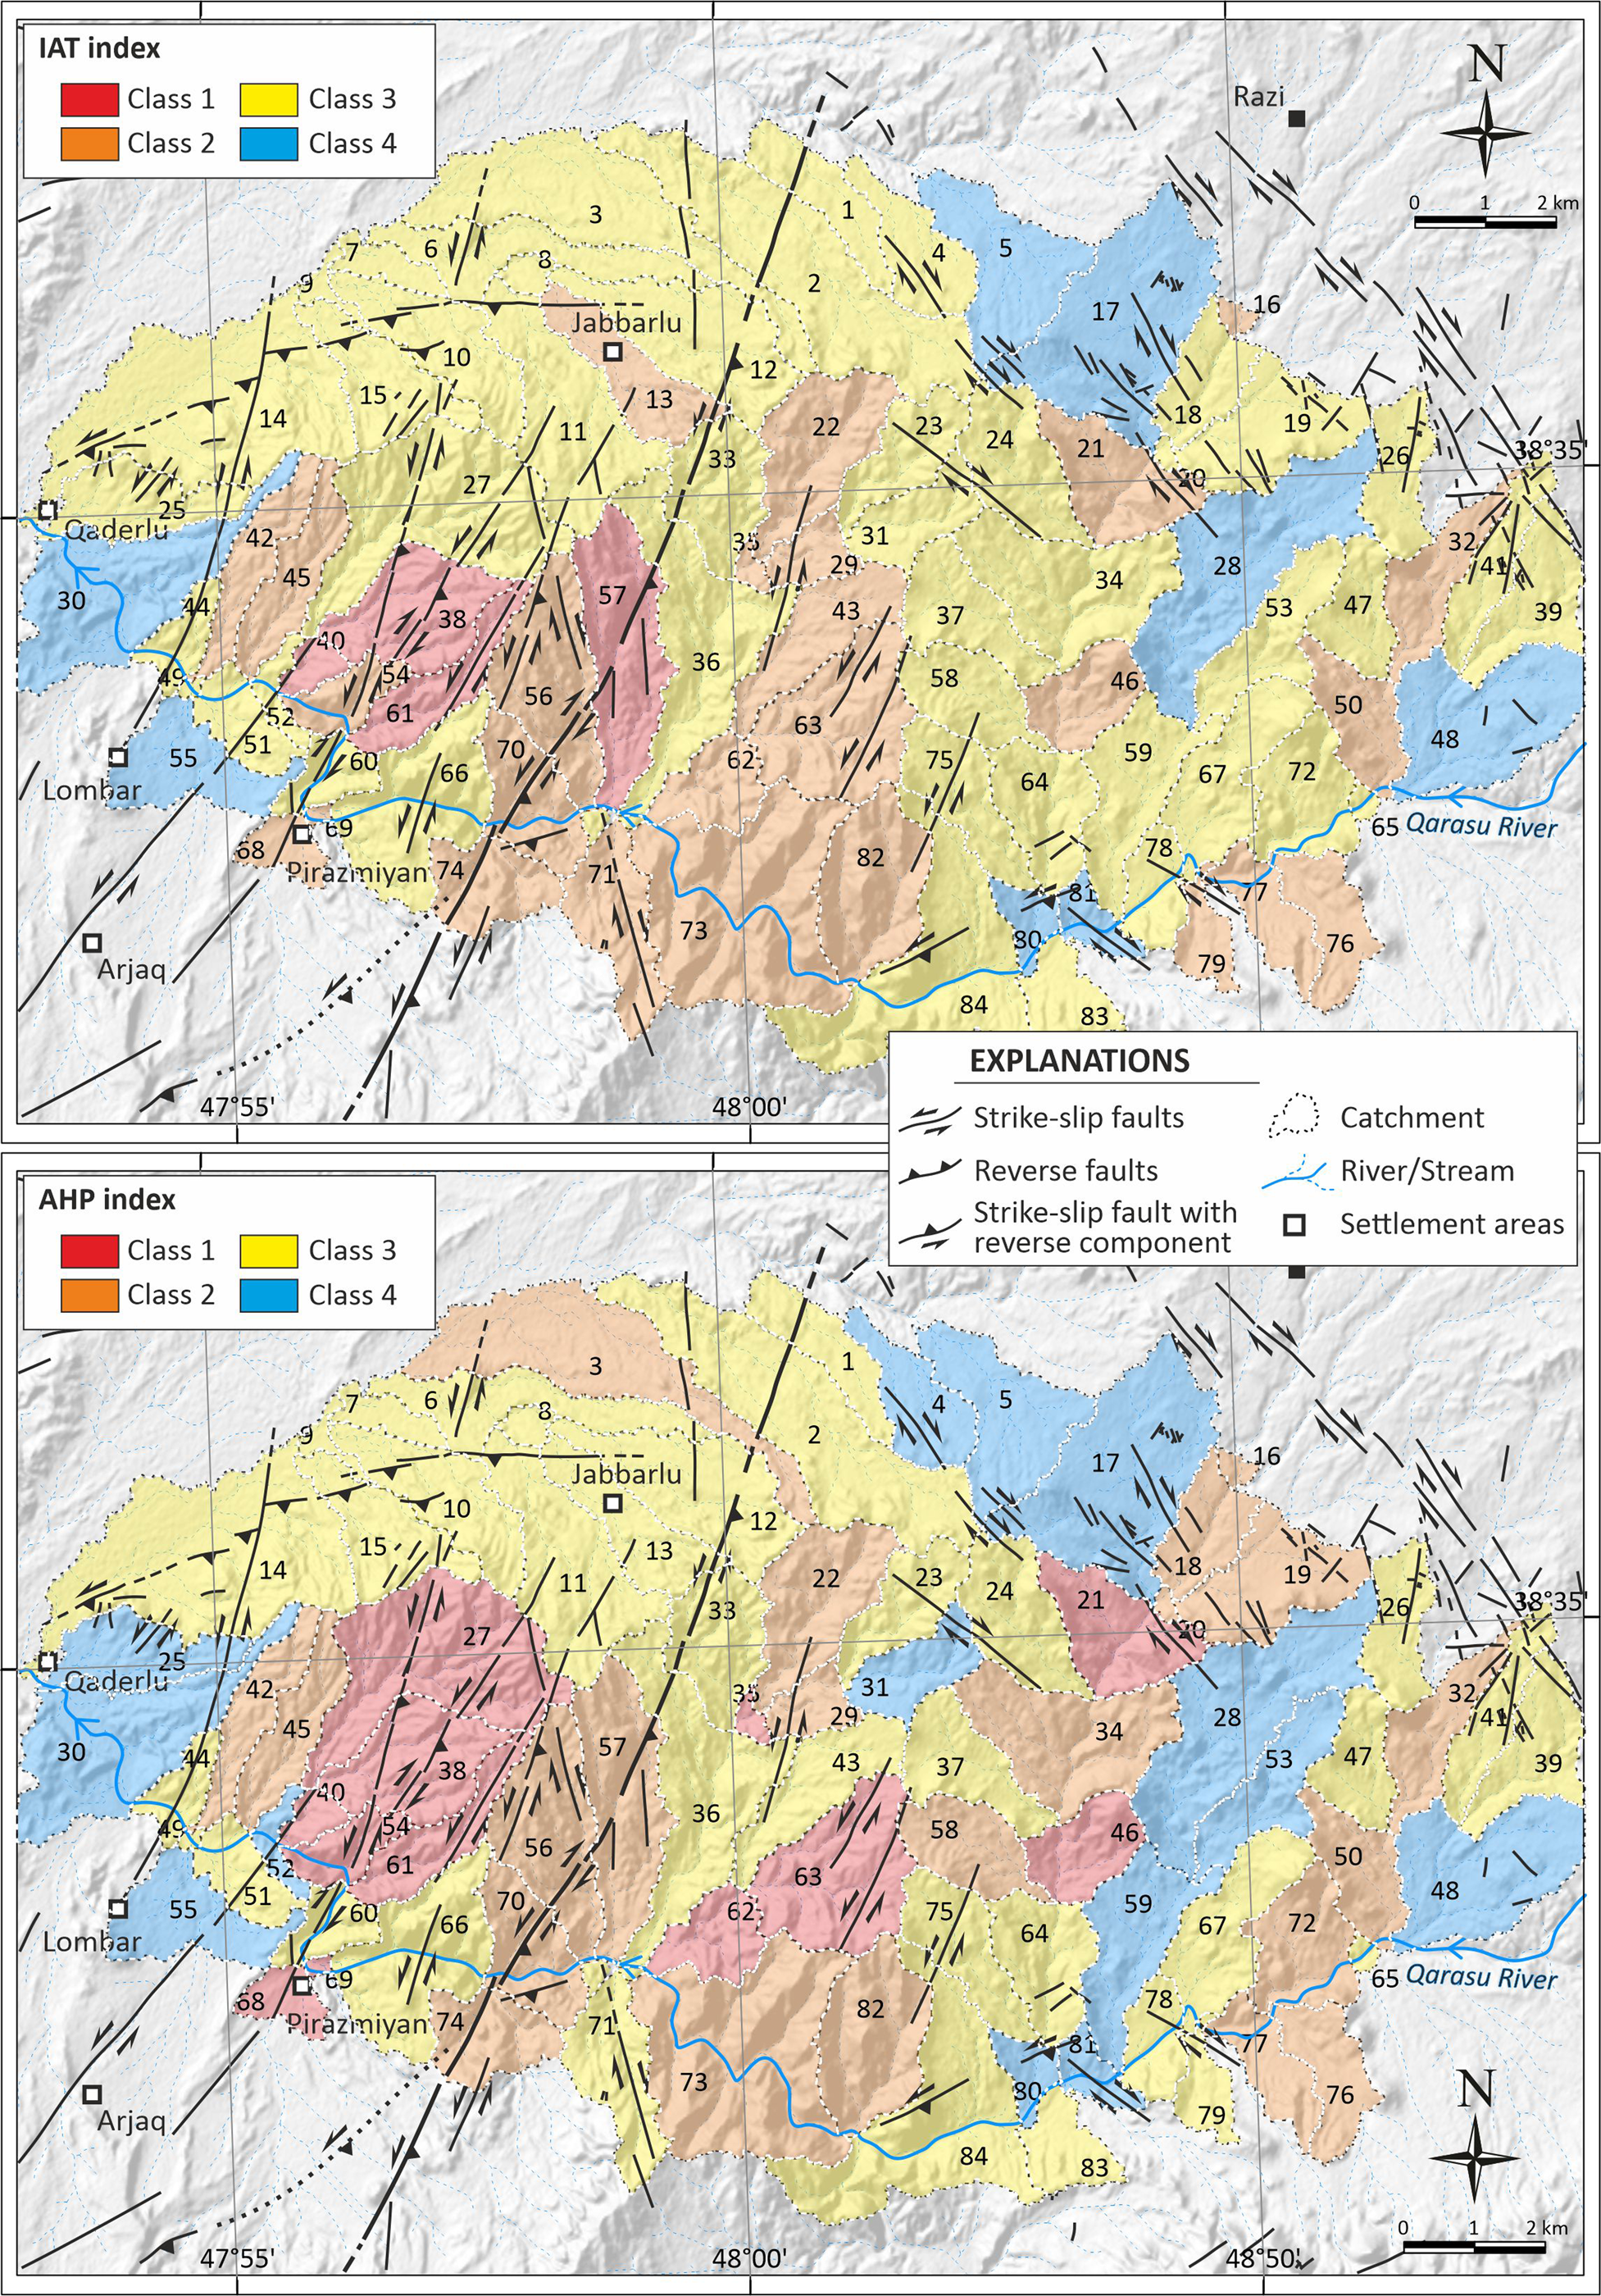
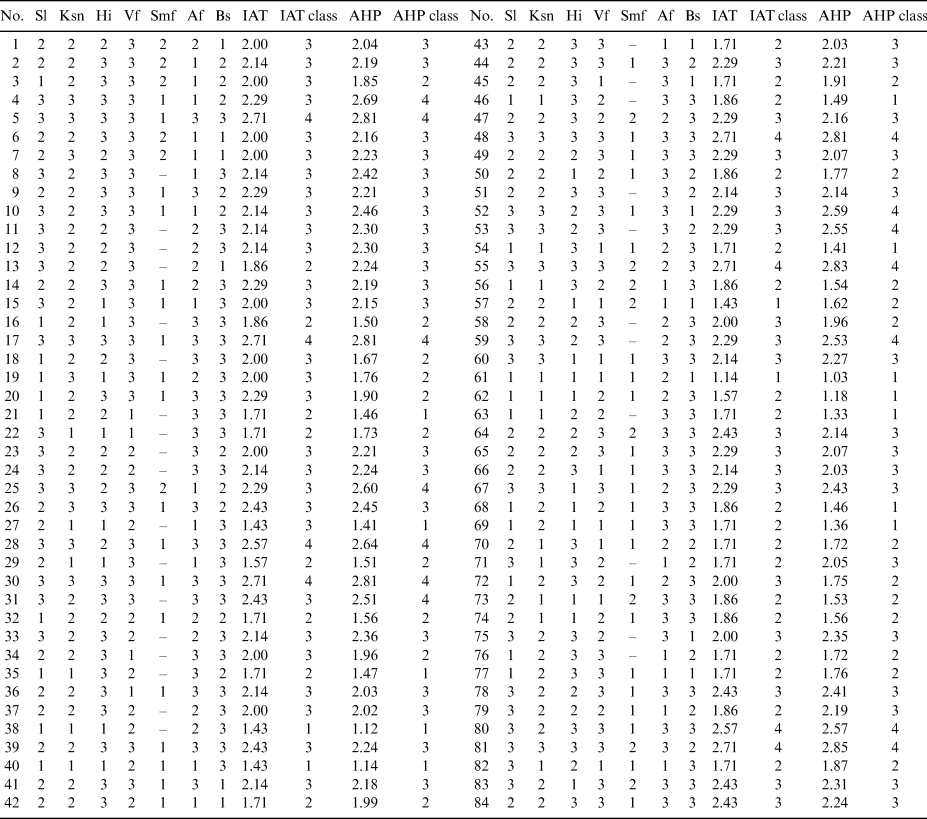
The IAT values in the Sabalan area range from 1.14 (highest tectonic activity) to 2.71 (lowest tectonic activity) (Table 2). Accordingly, four (5%) basins were classified as class 1, 26 (31%) basins as class 2, 45 (53%) basins as class 3 and nine (11%) basins as class 4 (Table 2, Fig. 11). The AHP values were from 1.03 (highest tectonic activity) to 2.85 (lowest tectonic activity) (Table 2). The AHP results showed that 12 (15%) basins belonged to class 1, 22 (26%) basins to class 2, 36 (43%) basins to class 3 and 14 (16%) basins to class 4 (Table 2, Fig 11).
Maps displaying the distribution of the IAT and AHP classes in the Sabalan area.
Classes of Sl (stream length–gradient index), Ksn (normalised steepness index), Hi (hypsometric integral), Vf (valley floor width–valley height ratio), Smf (mountain front sinuosity), Bs (drainage basin shape), Af (drainage basin asymmetry), IAT (index of active tectonics) and AHP (analytical hierarchical process).
3.2. Evidence of active tectonics in the Sabalan area
The study area has experienced several deformation stages with different types and orientations as a result of different tectonic events from the Eocene to post-Quaternary. These events have resulted in various structural features such as fractures (faults, shear fractures and joints) and folds (Fig. 12). Active faulting events and related Riedel fractures have formed extensive crush zones within the study area. The observed faults are mostly sinistral and dextral strike-slip faults (Fig. 12a), but reverse faults have formed roughly perpendicular to the principal stress direction (Fig. 12b). In addition, ongoing tectonic activities have resulted in conjugate fracturing and vein formation (Fig. 12c, d). Observations of faulting events and tilted and folded sedimentary sequences of Pliocene and Quaternary units indicate the last tectonic phases affecting the study area (Fig. 12e, f).
Field photographs indicating the effect of active tectonics in the Sabalan area. (a) View of dextral strike-slip fault; inset shows a close-up view of slickenlines. (b) View of reverse fault. Note the fault cores and damage zones along the footwall and hanging wall of the fault. Inset illustrates fault characteristics and main palaeostress directions. (c) General view of conjugate and extensional fractures in Quaternary deposits. (d) Close-up view and sketch of a carbonate-filled vein. Note that the vein occurred along a tension crack in the andesite. (e, f) Views of the reverse fault and tilted/folded beds in Plio-Quaternary units, respectively. Locations of all field photos are shown in Fig. 2.

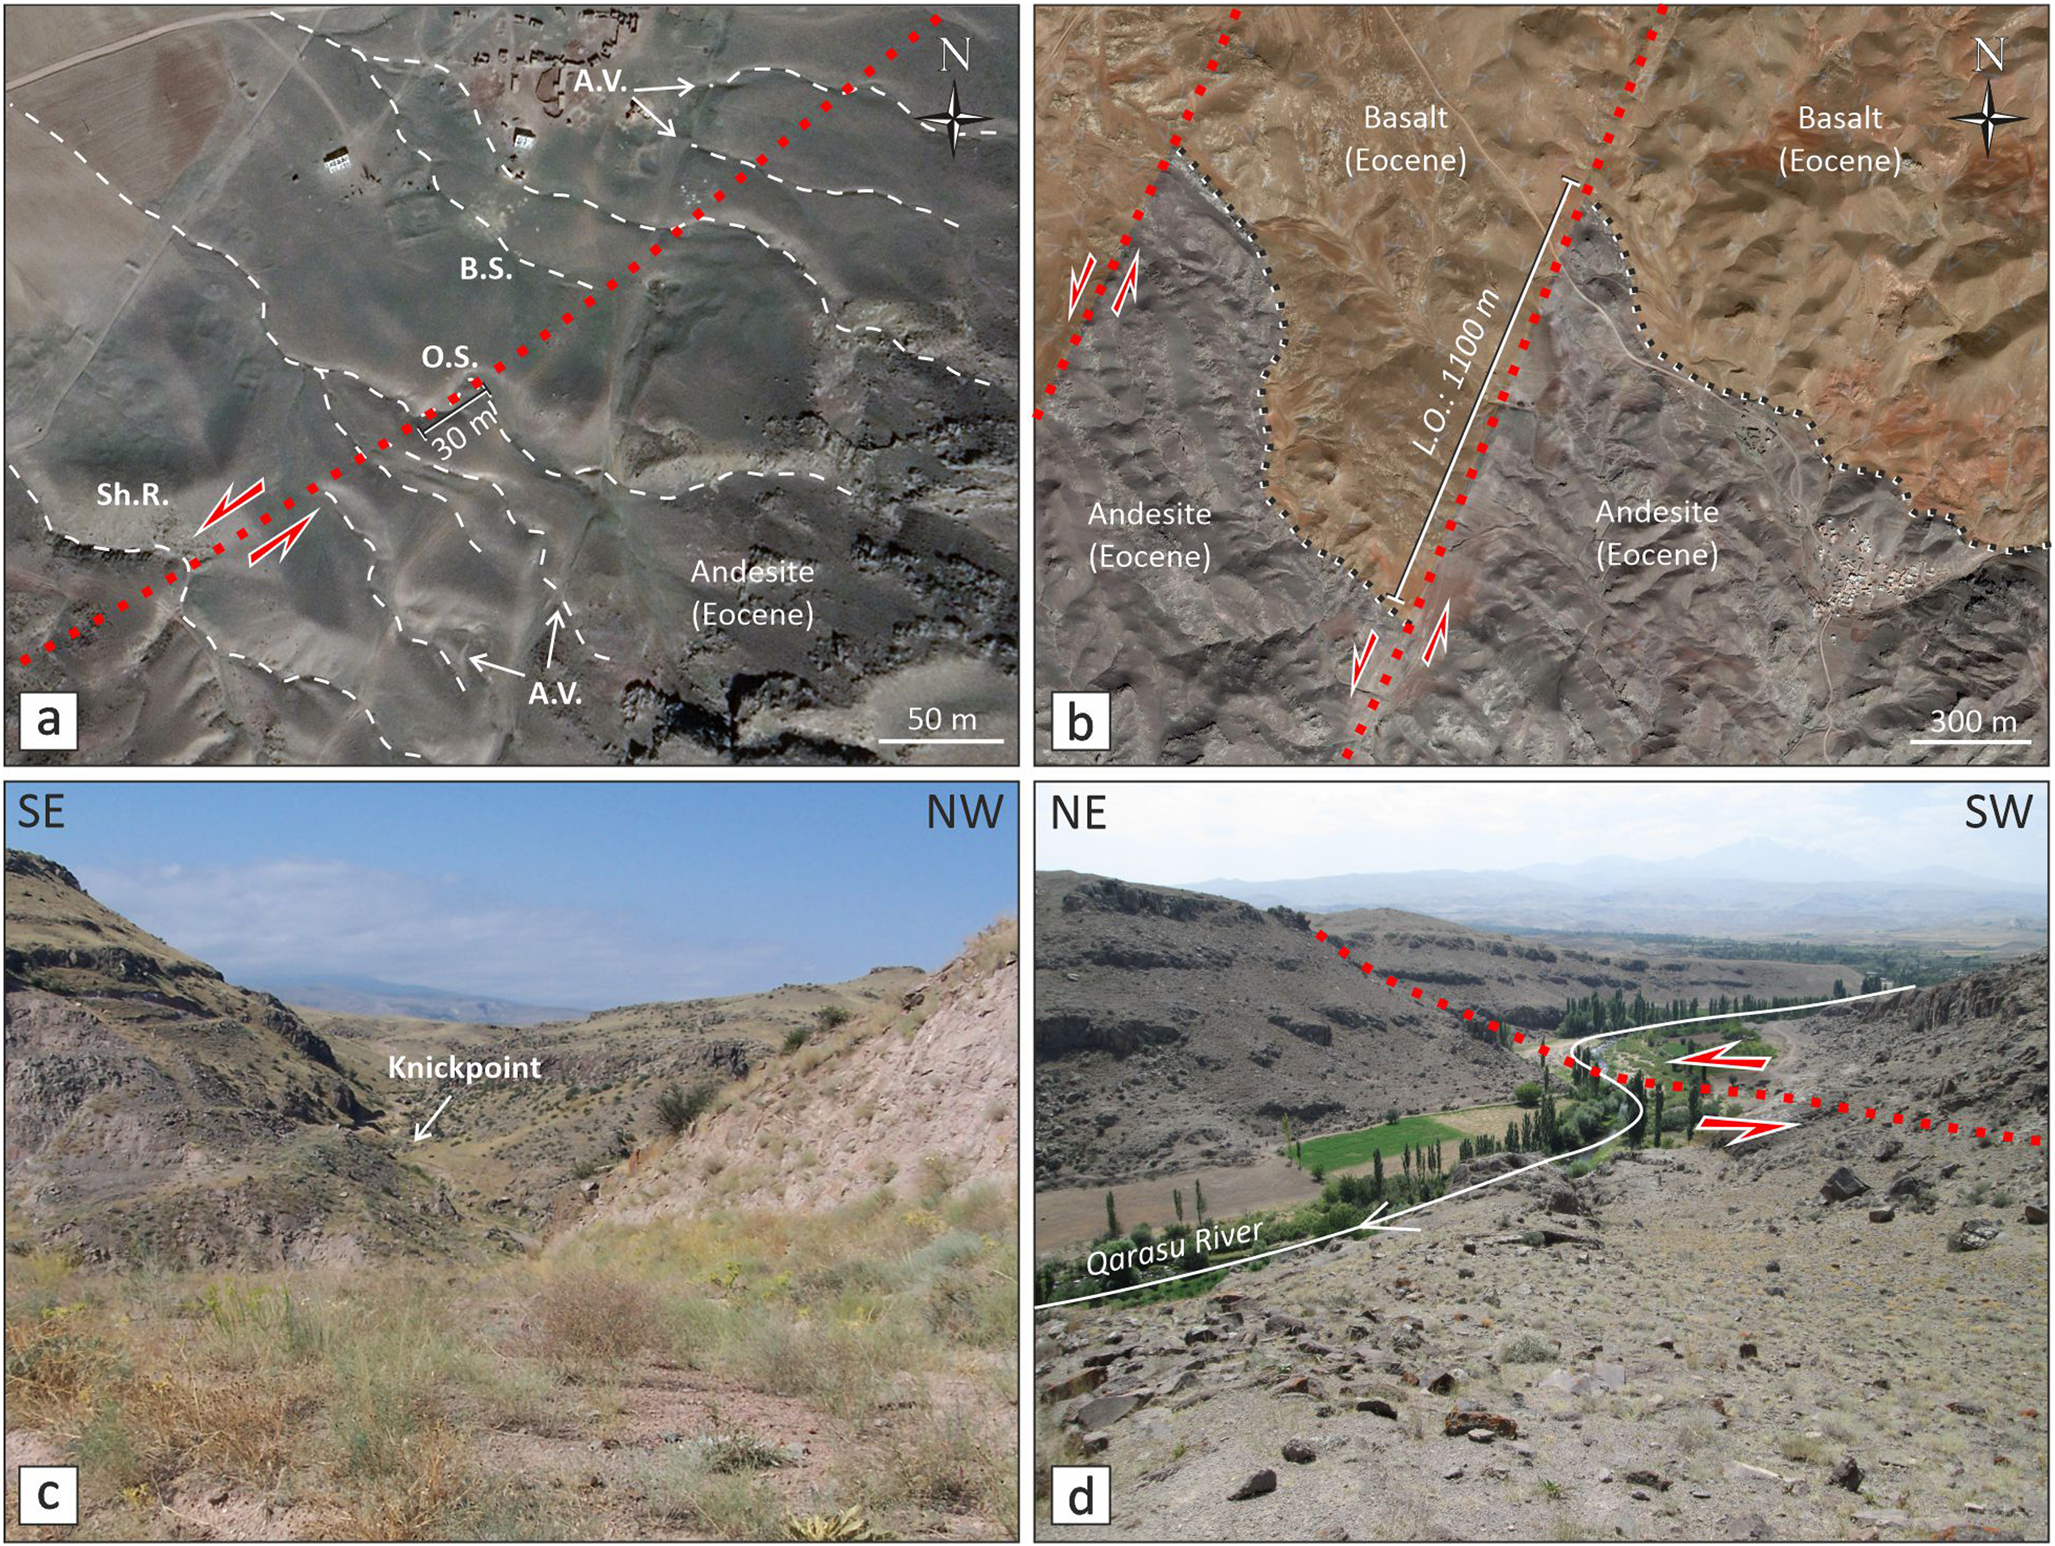
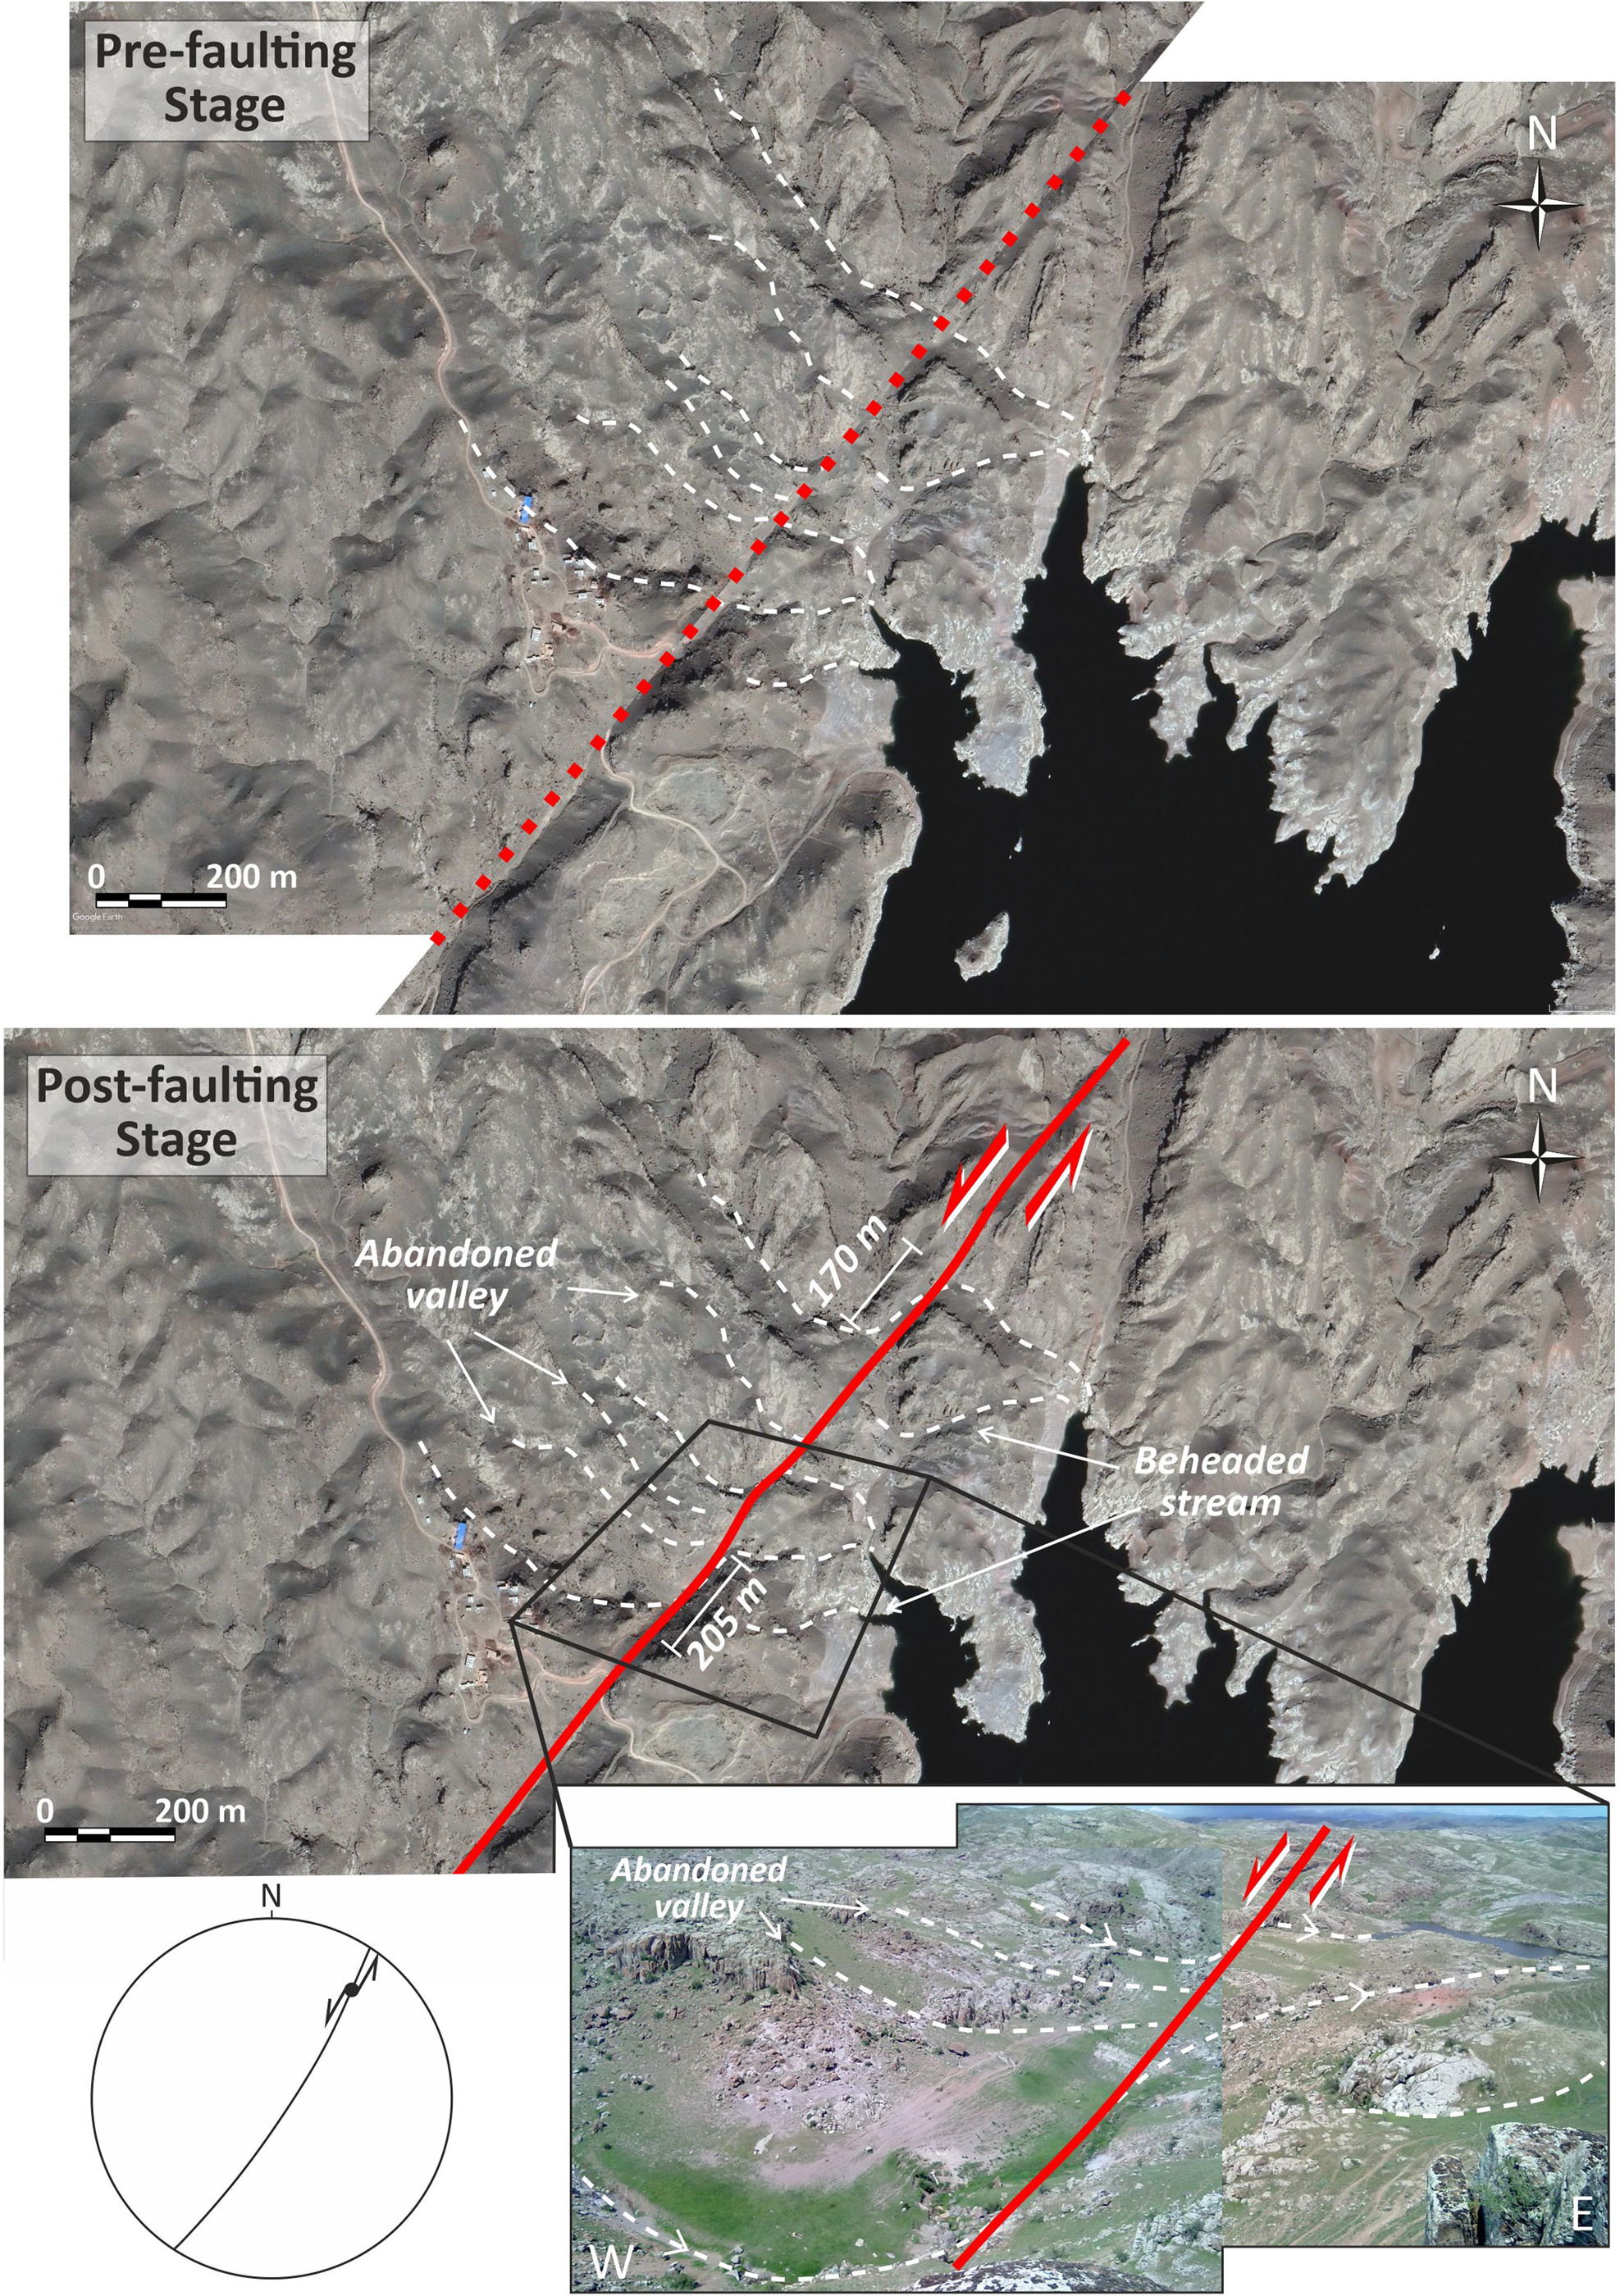
Morphotectonic indicators from satellite images and field studies (Fig. 13) indicate fault-related morphotectonic features, such as offset stream channels, shutter ridges, beheaded streams and abandoned valleys (Fig. 13a). Lithological offsets in the Eocene units demonstrate the post-Eocene activity of strike-slip faults (Fig. 13b). The youngest neotectonic activities resulted in V-shaped valleys with geomorphic features such as knickpoints, indicating rapid uplift in the study area (Fig. 13c). By contrast, relatively mature valleys are cut by young active faults with different characteristics (Fig. 13d).
(a, b) Satellite (Map data: Google, 2022 CNESS / Airbus) views of active tectonic morphologic indicators and lithological offsets, respectively. (c) Field view showing V-shaped valley with knickpoint. (d) Field view showing a U-shaped mature valley. Note that a sinistral strike-slip fault displaces the river channel. A.V., abandoned valley; B.S., beheaded stream; L.O., lithological offset; O.S., offset stream; Sh.R., shutter ridge. Locations of all photos are shown in Fig. 2.
3.3. Fracture analysis results
We measured the azimuth of 3496 fractures and faults consisting of 3335 automatically recognised fractures from the satellite image, 161 fractures obtained from field studies and 68 fault measurements with preserved slickenlines (Fig. 14).
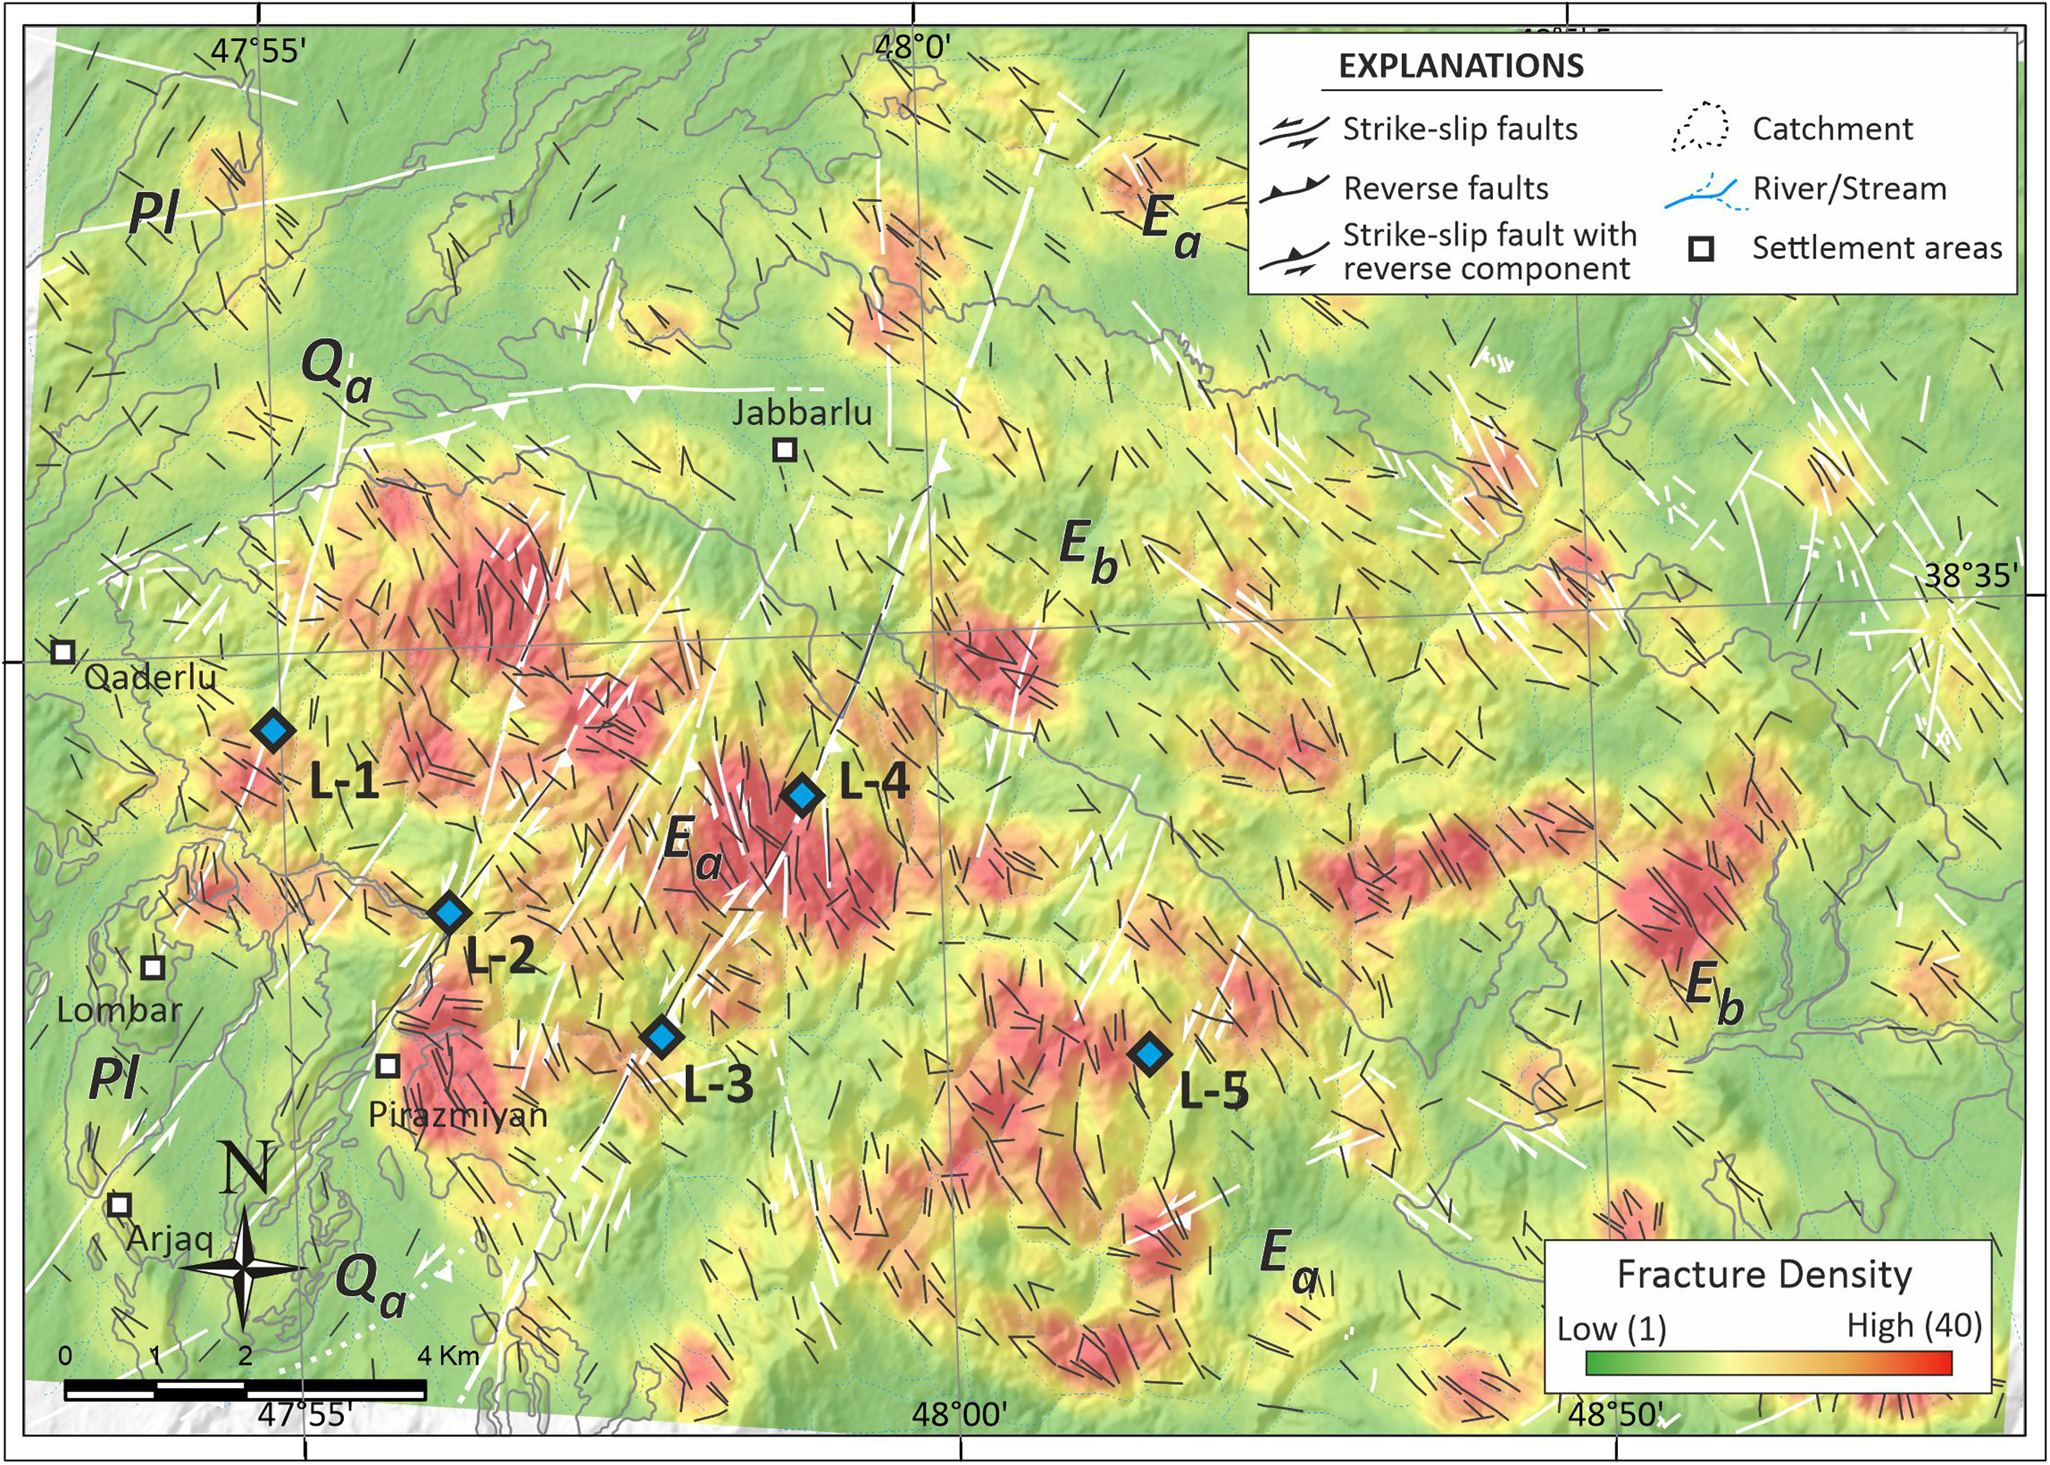
Automatically extracted fracture density map of the Sabalan area. Blue diamond shapes indicate locations where structural data were measured. Ea, Eocene andesitic rocks; Eb, Eocene basaltic rocks; Pl, Pliocene units; Qa, Quaternary alluvium.
The fractures in each geological unit were plotted in different columnar diagrams and then compiled into a single diagram for the entire study area to understand the relationships between the orientation of the considered fractures and the local geology (Fig. 15). All the data also were plotted on nine separate rose diagrams (Fig. 16).
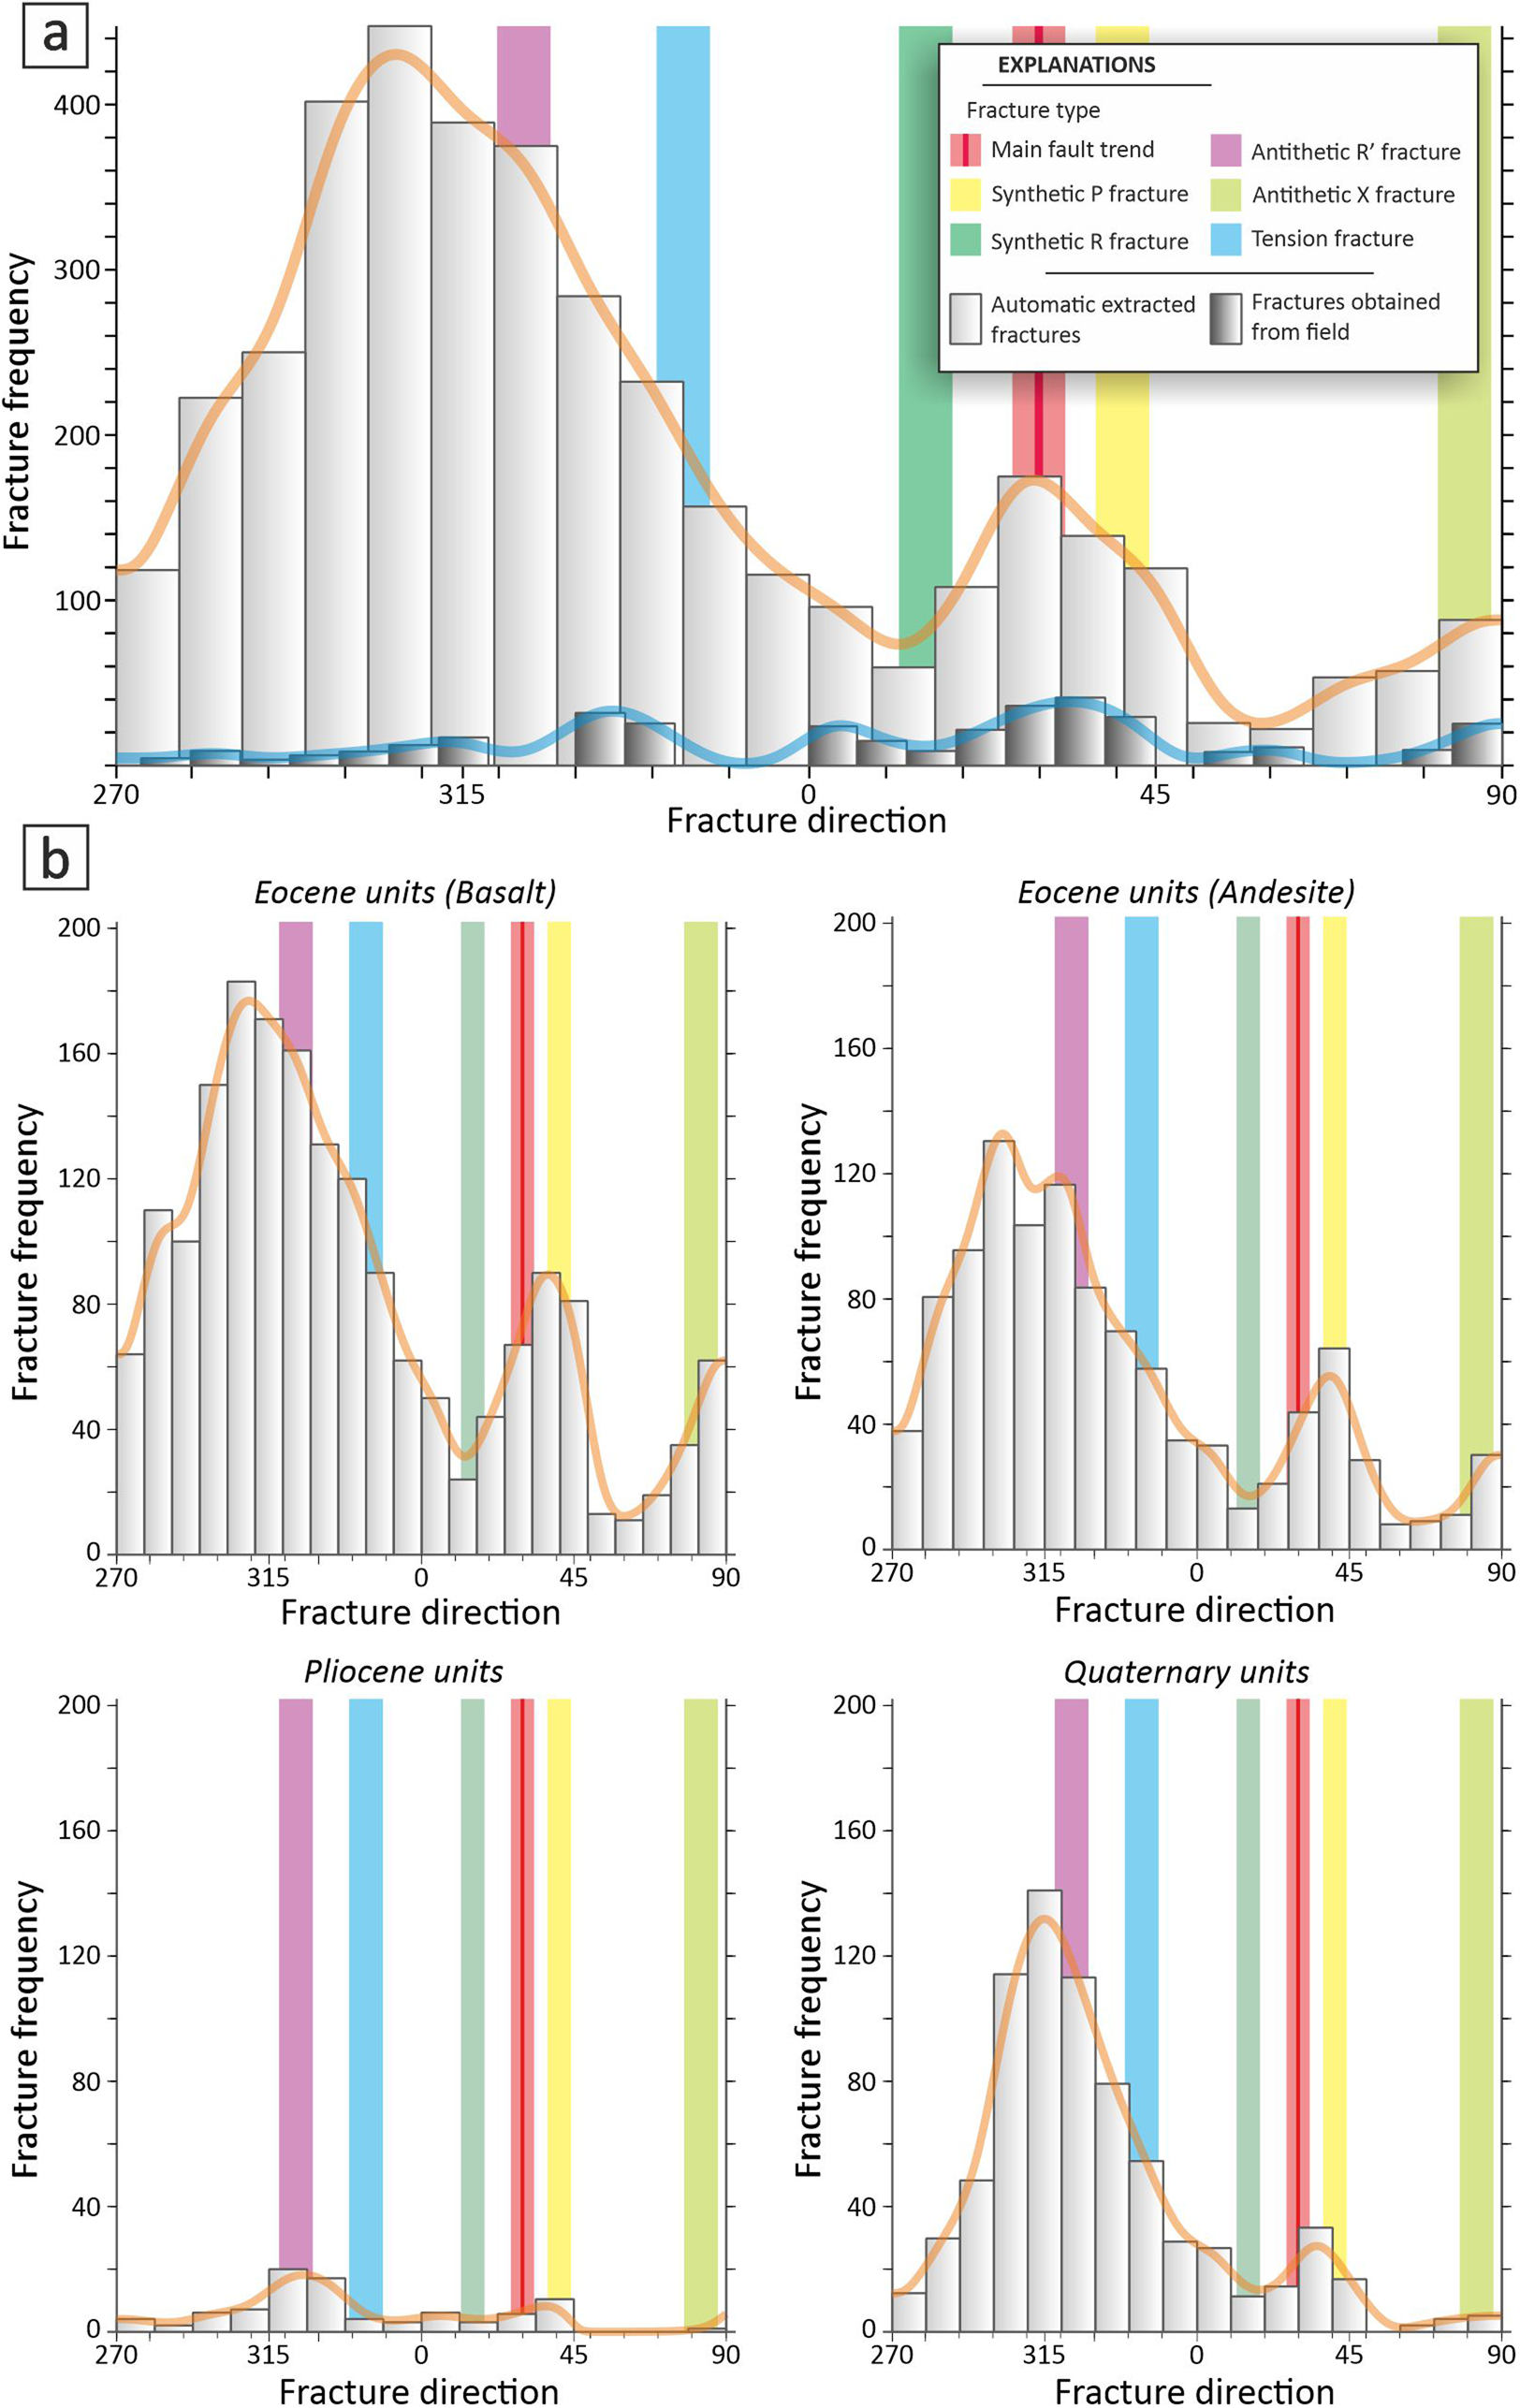
(a) Columnar weighed diagram representing all fracture data from the Sabalan area. (b) Separated columnar diagrams based on rock units of the study area. Note that coloured columns indicate the main fault and the related Riedel fractures.
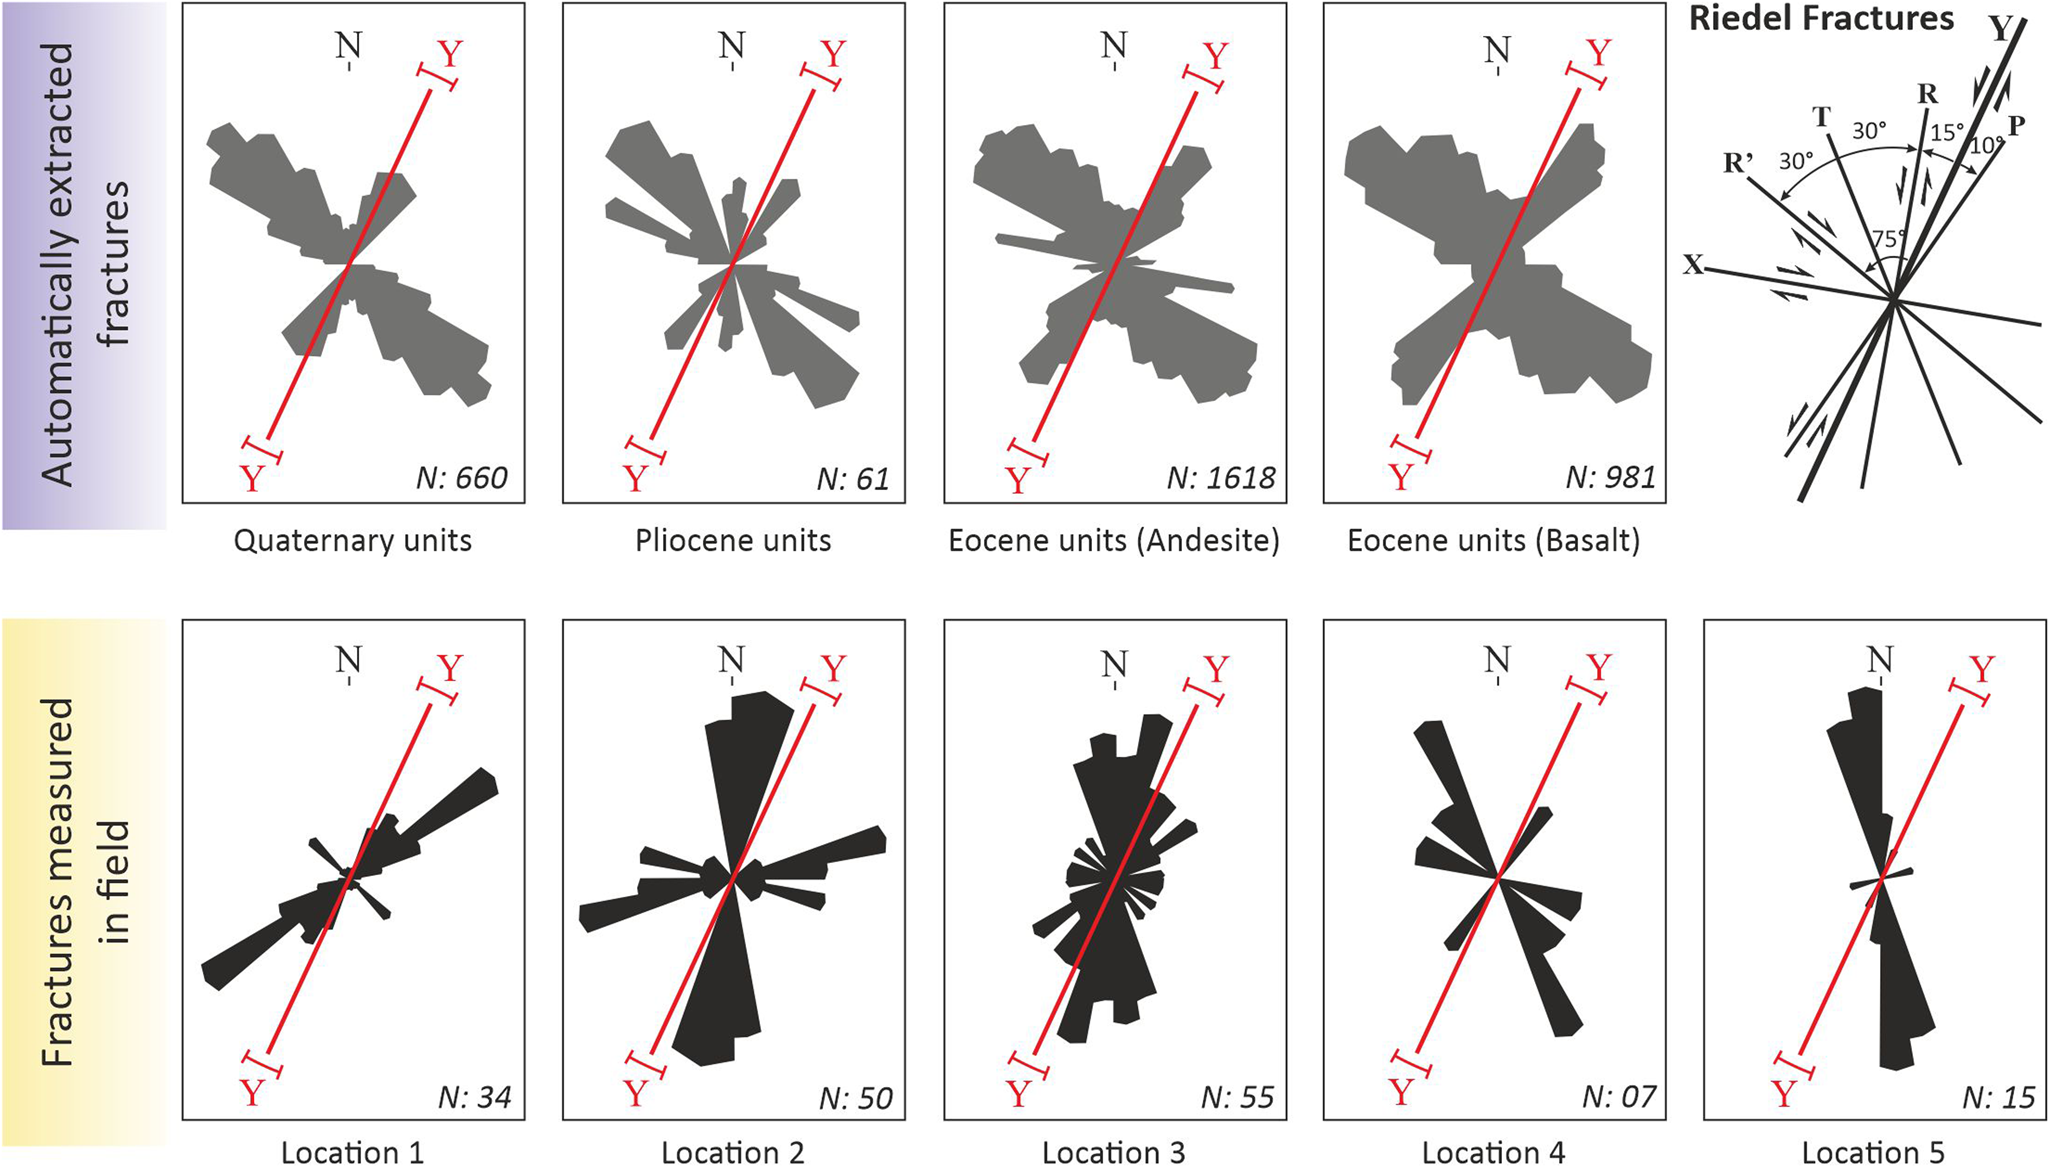
Rose diagrams showing automatically extracted fractures from satellite images and measured fractures from the field in the Sabalan area. Red lines (Y) indicate the approximate main faulting directions in the region. A Riedel-type schematic constructed using the major structural trends identified through stereographic projections is given at the top right to compare fracture relationships. The locations of the fracture data are shown in Fig. 14.
The results show that the automatically extracted fractures in the Eocene basalts are in two main directions; N30°–60°W and very few N30°–40°E, which are mainly within angles of 55–85° (mainly R′) and 05–15° (P and Y) from the general trend of the dominant NE–SW strike-slip faulting (Quaternary faults) trends, respectively (Figs 15, 16).
The observed fractures in the Eocene andesites show similar directions to those in basalts, with general directions of N30°–65°W and relatively lesser N25°–40°E. These fractures are within angles of 55–90° (mainly R′) and 0–15° (P and Y) from the general trend of the dominant NE–SW strike-slip faulting direction, respectively (Figs 15, 16).
In the Pliocene units, fractures are mainly in N30°–50°W directions and there are very few with N25°–30°E trends, mainly within angles of 55–75° (R′) and 00–05° (Y and probably P) from the general trend of the dominant NE–SW strike-slip faulting trends, respectively (Figs 15, 16). The automatically recognised fractures in Quaternary deposits are in two main directions: mostly N30°–60°W and very few N15°–30°E, mainly within angles of 55–85° (R′) and 10–05° (P, R, and Y) from the general trend of the dominant NE–SW strike-slip faulting trends, respectively (Figs 15, 16). The orientations of fractures obtained in five different locations from the field are consistently oriented at lower angles (less than ±40°) to the general trend of the dominant NE–SW strike-slip faulting (Fig. 16).
In location 1 (Fig. 14), most of the measured fractures are seen in the N35°–50°E direction, mainly within angles of 10–25° (P) from the general trend of the dominant NE–SW strike-slip faulting trends. Fractures in location 2 (Fig. 14) are in two sets with 0–15°E and N55°–60°E trends. These orientations are within angles of 10–25° (R) and 30–35° from the general trend of the dominant NE–SW strike-slip faulting trends, respectively. In location 3 (Fig. 14), fractures were measured at main trends of N15°W–N30°E, where the maximum angle from the general trend of the dominant NE–SW strike-slip faulting trend is nearly 40° (T, R and Y). Very few fractures were observed in higher angels from dominant faulting trends also (probably R′). The main trends of the measured fractures in location 4 (Fig. 14) are N10°–20°W and N25°–35°E, which are within angles of 35–45° (T) and 00–10° (Y and P) from the general trend of the dominant NE–SW strike-slip faulting trends, respectively. Some fractures were observed at higher angles (50–85°) to the main faults representing antithetic Riedel fractures (R′). Nearly all the observed fractures in location 5 (Fig. 14) are in 0–20°W directions. These fractures are mainly within angles of 25–45° (mainly T) from the general trend of the dominant NE–SW strike-slip faulting trends (Fig. 16).
3.4. Palaeostress analysis
At least two evident stress states were recognised using the multiple inverse method (Yamaji Reference Yamaji2000) (Fig. 17). We therefore separated the measured faults into two major sets based on their consistency with the present-day regional stress regime. Set 1 includes NE–SW-striking right-lateral strike-slip faults dipping to the NW and SE. The set presents sub-horizontal σ 1 and σ 3 axes, which indicate a dominant strike-slip motion (Fig. 17). The σ 1 compressional axis (49.4°) constitutes a higher angle with the geographical north than the present-day compressional stress direction with an angle difference of 25–40°. Based on these results and the cross-cutting relationships between different fault sets observed in the field, this set is assumed to consist of pre-Quaternary faults.
Palaeostress analyses of the pre-Quaternary and Quaternary faults of the Sabalan area using the multiple inversion method (Yamaji Reference Yamaji2000). Faults and striae are shown as great circles and arrows, respectively. The direction of principal palaeostresses was chosen with respect to the lowest misfit angle.
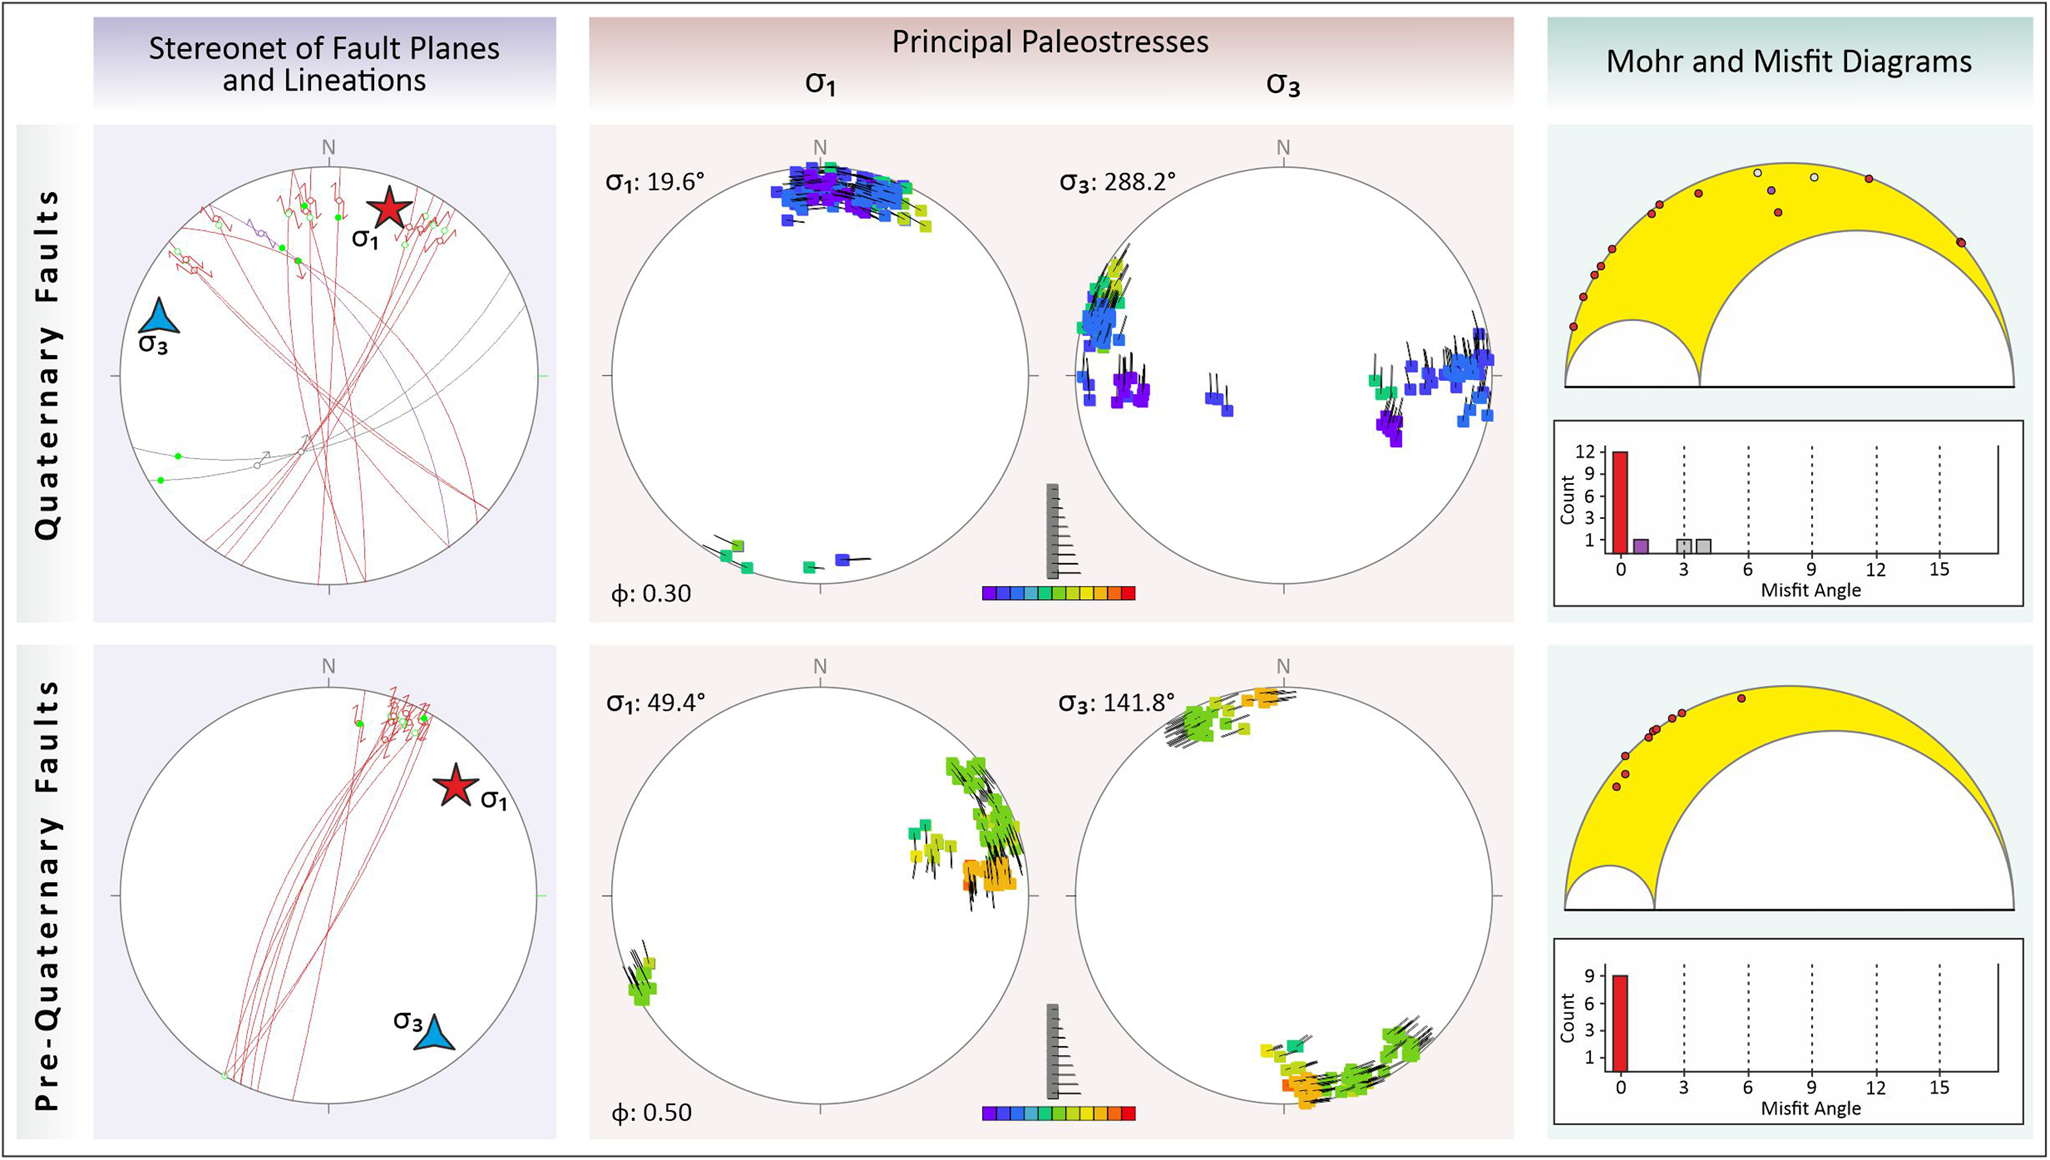
Set 2 includes mainly sub-vertical NE–SW-striking sinistral and NW–SE-striking dextral faults and NW–SE- and NE–SW-oriented reverse/oblique faults with relatively low dip angles. Similar to set 1, this set also shows sub-horizontal σ 1 and σ 3 axes, indicating a dominant strike-slip motion (Fig. 17), but the σ 1 compressional axes (22.5°) overlap with the present-day compressional directions suggested for NW Iran. This stress state might therefore belong to Quaternary faults within the study area.
4. Discussion
4.1. Geomorphic response to tectonic activity in the Sabalan area
The morphometric index values obtained from the drainage basins along the Sabalan area allow an understanding of the relationship between tectonic activity and erosional processes. When Hi tends to 0.5, the topography evolves steadily and the geomorphological catchment presents S-shaped hypsometric curves (Strahler Reference Strahler1952; Nsangou et al. Reference Nsangou, Owona, Mvondo Owono, Ateba, Tsimi, Ondoa and Ekodeck2020). In the Sabalan area, drainage basins situated on the Quaternary and re-activated pre-Quaternary faults exhibit higher Hi values, demonstrating relatively young valleys with steeper slopes in the presence of active tectonics (e.g., Strahler Reference Strahler1952; Keller & Pinter Reference Keller and Pinter2002; Perez-Pena et al. Reference Perez-Pena, Azor, Azanon and Keller2010; Nsangou et al. Reference Nsangou, Owona, Mvondo Owono, Ateba, Tsimi, Ondoa and Ekodeck2020). According to Hack (Reference Hack1973) and Alipoor et al. (Reference Alipoor, Poorkermani, Zare and El Hamdouni2011), lithological variations affect Sl values when rivers flow over rocks of different natures that resist erosion differently. In the Sabalan area, except for the lithologically originated anomalies observed in west (near Qaderlu village), all the anomalously high Sl values correspond to active faults. It therefore appears that Sl anomalies strictly depend on the tectonic activity and not lithological variations.
Similarly, interactions between active faulting and existing pre-Quaternary faults, together with widespread fracture sets, resulted in the development of knickpoints and knickzones along the study area (Figs 13, 18). Concentrations of the knickpoints in the southern parts (around the Qarasu River) are consistent with sudden changes in river flow direction due to the displacement of weak zones formed by faulting events. Likewise, anomalous changes in the altitude of the river bed due to tectonic structures such as faults have formed knickpoints. Most of the knickpoints in the northern parts of the study area are located in drainage beds affected by parallel/ nearly parallel E–W-striking Quaternary faults. In the central parts, knickpoints have formed due to the Quaternary activity of major faults and intense fracturing events within volcanic rocks.
Satellite (Map data: Google, 2022 CNESS / Airbus) views and field photograph (lower panel) displaying examples of left-lateral offset stream channels along the Quaternary faults in the Sabalan area. Note that the stereonet projection shows slickensides and slickenlines along the fault.
The normalised steepness index analyses show that the correlation between Ksn values and lithological variations is insignificant (Figs 2, 8). Most of the high Ksn values were observed within the uniform rocks (Fig. 8). We therefore propose that the high values of Ksn highlight the effects of tectonic processes. Kirby et al. (Reference Kirby and Whipple2001), Chen et al. (Reference Chen, Shyu and Chang2015), Saber et al. (Reference Saber, Isik and Caglayan2020) and Nsangou et al. (Reference Nsangou, Owona, Mvondo Owono, Ateba, Tsimi, Ondoa and Ekodeck2020) emphasised the same results for similar conditions in different areas. According to the Ksn results, the areas of maximum uplift are located in the southern and central study area, probably due to the relative movements of active faults with different directions, dips, slip senses and slip rates. Low Vf values (<1) in the southern and central areas correspond to V-shaped valleys developed in response to active uplift (e.g., El Hamdouni et al. Reference El Hamdouni, Irigaray, Fernández, Chacón and Keller2008). Our Vf and Smf values support these assumptions, where the relative uplift rate in the southern parts indicates rates of >0.5 mm year−1 (Fig. 8).
The drainage basin asymmetry (Af) and basin shape (Bs) indices do not show any systematic changes. Both indexes exhibit prominent values along major faults, suggesting that tectonic structures shaped and developed the drainage basins. Morphotectonic markers – such as offset stream channels, shutter ridges, abandoned valleys and beheaded streams – are evidence of tectonic impacts on the evolution of the landscape in the Sabalan area. The configuration of offset stream channels, which results from the interaction of erosional and tectonic processes (e.g., Wallace Reference Wallace, Dickinson and Grantz1968), was noted in satellite images and field observations (Fig. 18). Left-lateral offset stream channels were measured from a few tens of metres (Fig. 13a) to a few hundred metres (Fig. 18).
4.2. Palaeostress interpretations and structural evolution in the Sabalan area
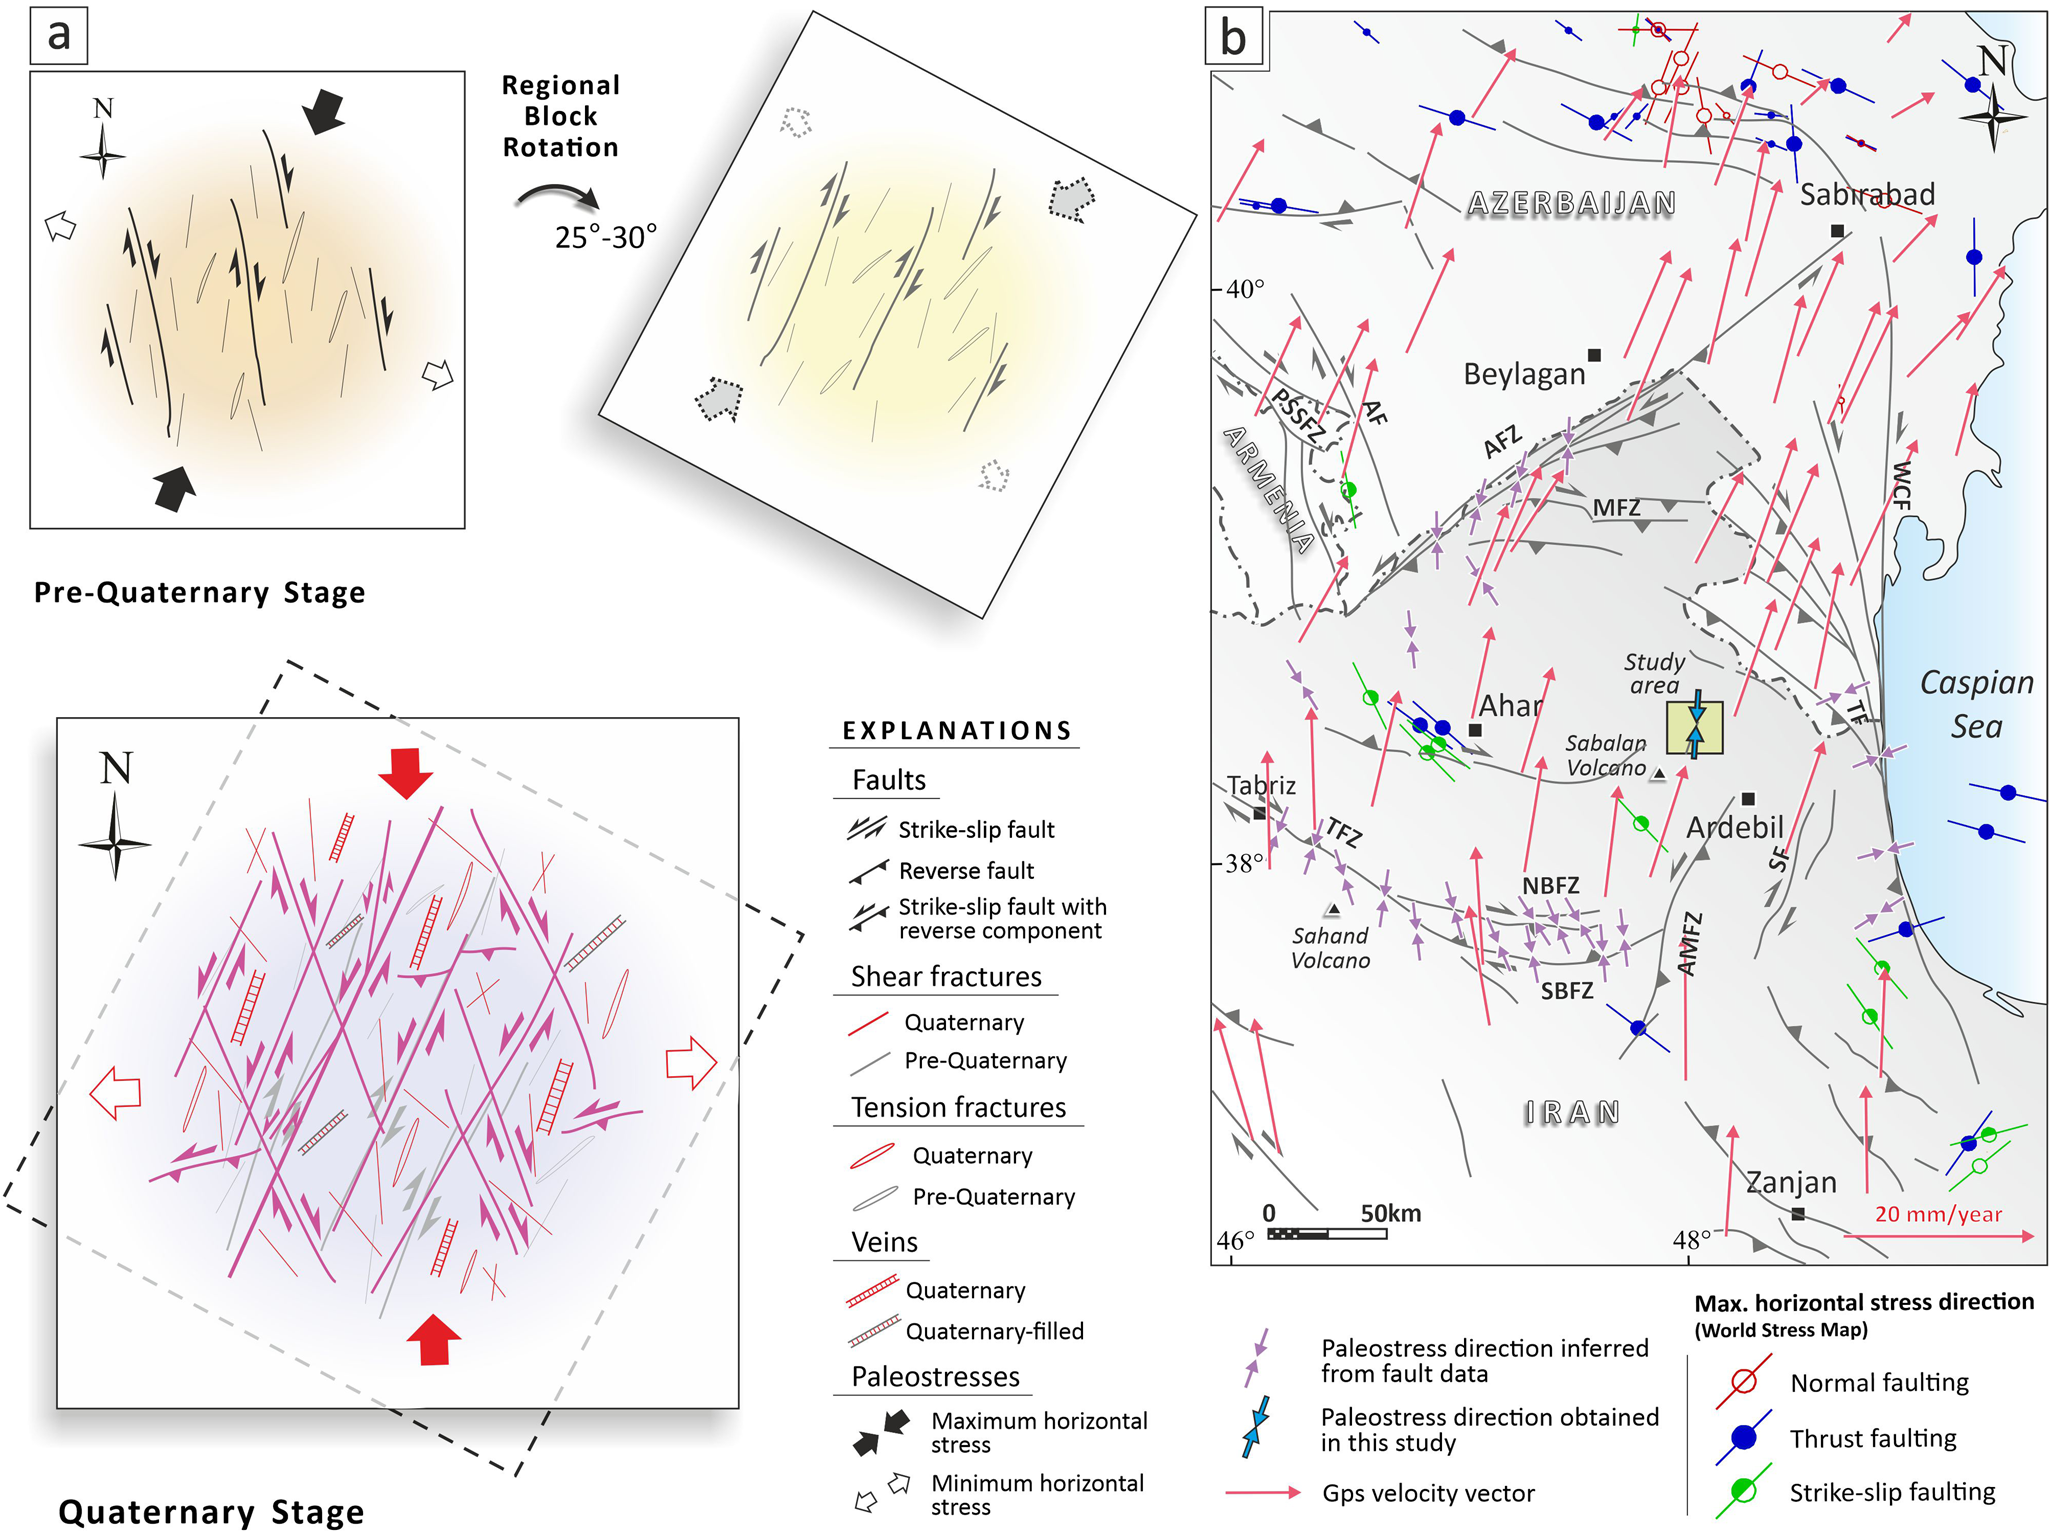
Field data and palaeostress results reveal at least two evident stress states in the Sabalan area (Fig. 19). The σ 1 compressional axes (49.4°) of set 1, representing pre-Quaternary faults, constitute angles of 25–40° with the present-day compressional stress direction of NW Iran (Fig. 20). This is roughly consistent with the post-Eocene block rotation amount (25–30°) proposed by van der Boom et al. (Reference Van der Boon, van Hinsbergen, Rezaeian, Gürer, Honarmand, Pastor-Galan, Krijgsman and Langereis2018). By contrast, stress state 2 demonstrates Quaternary faults with a σ 1 compressional axis of 22.5° and overlaps with the present-day compressional directions suggested for NW Iran (e.g., Nilforoushan et al. Reference Nilforoushan, Masson, Vernant, Vigny, Martinod, Abbasi, Nankali, Hatzfeld, Bayer, Tavakoli, Ashtiani, Doerflinger, Daignieres, Collard and Chery2003; Vernant et al. Reference Vernant, Nilforoushan, Hatzfeld, Abbasi, Vigny, Masson, Nankali, Martinod, Ashtiani, Tavakoli and Chery2004; Hessami et al. Reference Hessami, Nilfouroushan and Talbot2006; Reilinger et al. Reference Reilinger, McClusky, Vernant, Lawrence, Ergintav, Cakmak, Ozener, Kadirov, Guliev, Stepanyan, Nadariya, Hahubia, Mahmoud, Sakr, ArRajehi, Paradissis, Al-Aydrus, Prilepin, Guseva, Evren, Dmitrotsa, Filikov, Gomez, Al-Ghazzi and Karam2006; Forte et al. Reference Forte, Cowgill, Bernardin, Kreylos and Hamanne2010; Djamour et al. Reference Djamour, Vernant, Nankali and Tavakoli2011; Karakhanian et al. Reference Karakhanian, Vernant, Doerflinger, Avagyan, Philip, Aslanyan, Champollion, Arakelyan, Collard, Baghdasaryan, Peyret, Davtyan, Calais and Masson2013; Saber et al. Reference Saber, Caglayan and Isık2018, Reference Saber, Isik and Caglayan2021; UNAVCO 2021).
(a) Field view showing the formation of multiple faults and cataclastic zone (fault core, damage zones) indicating repetitive reactivation of the fault zones in the Sabalan area. (b) Close-up view of slickenside showing left-lateral striae overprinting the relatively older right-lateral slickenlines. Insets show stereonet projections of slickensides and slickenlines along the faults.

(a) Schematic diagrams illustrating the stages of faulting, regional block rotation and other geological structures in the Sabalan area. (b) Simplified tectonic map of NW Iran with GPS velocity vectors (Unavco 2021). Maximum horizontal stress direction from the world stress map of the WSM project database (Heidbach et al. Reference Heidbach, Rajabi, Ziegler, Reiter and WSM2016), palaeostress directions inferred from fault data and major fault zones (Hessami et al. Reference Hessami, Jamali and Tabassi2003; Saber et al. Reference Saber, Isik and Caglayan2021). AF, Akera fault; AFZ, Aras fault zone; AMFZ, Ardebil–Miyaneh fault zone; NBFZ, North Bozgush fault zone; PSSFZ, Pambak–Sevan–Sunik fault zone; SF, Sangavar fault; SBFZ, South Bozgush fault zone; TF, Talesh fault; TFZ, Tabriz fault zone; WCF, West Caspian fault.
The Sabalan area represents a complex fracture zone in map view. We evaluated the major fracture sets around significant tectonic structures (e.g., active faults) such as Riedel fractures. According to Sylvester (Reference Sylvester1988), a simple shear shows the monoclinic symmetry of strain, usually accompanied by various secondary en échelon structures. Various investigations (e.g., analogue and numerical modelling, surface ruptures related to the earthquakes and theoretical analysis) show that the secondary structures under simple shear mechanisms include different types of fractures. The idealised sets consist of Y-fractures (i.e., faults parallel to the principal displacement zone), synthetic Riedel (R) and (P) shears, conjugate antithetic Riedel (R′) and sometimes X-shears and tensional fractures (T) or normal faults (e.g., Riedel Reference Riedel1929; Tchalenko Reference Tchalenko1970; Bartlett et al. Reference Bartlett, Friedman and Logan1981; Sylvester Reference Sylvester1988; Davis et al. Reference Davis, Bump, Garcia and Ahlgren2000; Ahlgren Reference Ahlgren2001; Lin & Nishikawa Reference Lin and Nishikawa2011; Dooley & Schreurs Reference Dooley and Schreurs2012). Typically, conjugate sets of relatively short strike-slip faults are usually developed in tectonic settings of crustal shortenings, such as fold–thrust belts (Sylvester Reference Sylvester1988). The sense and orientation analyses of measured fractures in the field unravel two dominant sets of fractures in the study area, N20°–25°E and N25–30°W (Figs 14, 15, 16), both representing strike-slip characteristics. Major fault zones in the study area include well-developed complex and multiple fault-related rocks or cataclastic zones (fault core and damage zones), indicating repeated reactivation of the zone (Fig. 19a).
Our field observations reveal that most NW–SE-striking faults have right-lateral senses, whereas the examined fault planes of the main NE–SW-striking faults include overprinted slickenlines containing both left- and right-lateral striae (Figs 19b, 20a). However, relatively later left-lateral striae overlap the right-lateral slickenlines, indicating the Quaternary period reactivation of pre-rotated relatively older faults (Fig. 19b), which is consistent with the present-day stress regime of NW Iran (e.g., Nilforoushan et al. Reference Nilforoushan, Masson, Vernant, Vigny, Martinod, Abbasi, Nankali, Hatzfeld, Bayer, Tavakoli, Ashtiani, Doerflinger, Daignieres, Collard and Chery2003; Reilinger et al. Reference Reilinger, McClusky, Vernant, Lawrence, Ergintav, Cakmak, Ozener, Kadirov, Guliev, Stepanyan, Nadariya, Hahubia, Mahmoud, Sakr, ArRajehi, Paradissis, Al-Aydrus, Prilepin, Guseva, Evren, Dmitrotsa, Filikov, Gomez, Al-Ghazzi and Karam2006; Djamour et al. Reference Djamour, Vernant, Nankali and Tavakoli2011; Karakhanian et al. Reference Karakhanian, Vernant, Doerflinger, Avagyan, Philip, Aslanyan, Champollion, Arakelyan, Collard, Baghdasaryan, Peyret, Davtyan, Calais and Masson2013; Madanipour et al. Reference Madanipour, Ehlers, Yassaghi and Enkelmann2017; Saber et al. Reference Saber, Isik and Caglayan2021) (Fig. 20b).
Two major sets of tension cracks and veins were identified in the study area, with general directions of N°40–50°E and N10°W–N15°E. The first set developed in Eocene volcanic rocks and consists of filled (veins) and unfilled cracks of different sizes. Based on the general orientations of these cracks, we classified them as tension fractures developed in the pre-Quaternary stage. The second set was observed in both the pre-Quaternary and Quaternary units, indicating younger tectonic stages. Plumose structures that might be linked to tensional joints related to cooling joints have developed within the Eocene volcanic units in similar directions to Quaternary tension cracks, which can be interpreted as indicators of direction and the sense of fracture propagation (Woodworth Reference Woodworth1896). The orientation of these fractures is compatible with the present-day compressional axes of the region, where shear senses inferred from stepping on different fracture sets are consistent with nearly N–S-trending σ 1 stress trajectories in NW Iran (e.g., Nilforoushan et al. Reference Nilforoushan, Masson, Vernant, Vigny, Martinod, Abbasi, Nankali, Hatzfeld, Bayer, Tavakoli, Ashtiani, Doerflinger, Daignieres, Collard and Chery2003; Reilinger et al. Reference Reilinger, McClusky, Vernant, Lawrence, Ergintav, Cakmak, Ozener, Kadirov, Guliev, Stepanyan, Nadariya, Hahubia, Mahmoud, Sakr, ArRajehi, Paradissis, Al-Aydrus, Prilepin, Guseva, Evren, Dmitrotsa, Filikov, Gomez, Al-Ghazzi and Karam2006; Djamour et al. Reference Djamour, Vernant, Nankali and Tavakoli2011; Karakhanian et al. Reference Karakhanian, Vernant, Doerflinger, Avagyan, Philip, Aslanyan, Champollion, Arakelyan, Collard, Baghdasaryan, Peyret, Davtyan, Calais and Masson2013) (Fig. 20).
5. Conclusions
The response of the landscape to deformation and structural patterns in the Sabalan area were analysed with the following conclusions.
(1) The Sabalan area is characterised by well-preserved widespread fracture systems. These fractures, with different scales and orientations, had an essential role in forming and developing surface processes.
(2) Our quantitative geomorphic indices analysis revealed that the drainage systems were affected by various structures formed as a result of different degrees of tectonic activity. According to our results, in the southern and central parts of the study area, where faulting and fracturing events are intense, the landscape developed under tectonic-dominated conditions rather than erosional processes. By contrast, in the areas affected by active faulting, narrow V-shaped valleys formed as a result of rapid uplift. Numerous morphotectonic indicators, such as offset stream channels, shutter ridges, beheaded streams and abandoned valleys have formed along the strike-slip faults.
(3) Both the IAT and AHP results reflect the linear relationship between structural features and landscape development in the study area, although the AHP method seems to be more reliable and reasonably coherent with the geological and structural conditions. The lowest values of the AHP (high tectonic activity class) were observed in the southern and central areas, where fracturing is intense. This indicates that tectonic activity had a greater role in developing the drainage basins and shaping landscape than erosional processes. By contrast, high AHP values, representing lower tectonic activity, were observed in the northern and western study area, where erosional processes had a more effective role in developing the surface morphology.
(4) The analysis of the automatically extracted fractures and the field data emphasised that the fractures generally constitute conjugate fracture systems. Riedel fractures developing along the major fault zones are a characteristic of the study area. The analysis also showed that the fractures are in dominant NW–SE orientations, constituting the antithetic (R′) Riedel fractures of the major faults. Although the NNE–SSW- and NE–SW-oriented R and P fractures and the NNW–SSE-oriented tension fractures are less densely distributed than the other fractures, they constitute a significant population of the observed fractures. In addition, the plumose structures and carbonate-filled veins observed in the same orientations with tension cracks are considered to occur as a result of the same dominant strike-slip stress regime.
(5) The field observations and palaeostress analysis revealed at least two stages of faulting during the pre-Quaternary and Quaternary periods. In the post-Eocene period, the NNW–SSE-striking dextral strike-slip faults developed as a result of the roughly N–S-trending dominant compressional regime in the region and subsequently changed to a NE–SW direction due to 25–30° clockwise block rotation. Continuation of the similarly oriented compressional regime in the Quaternary re-activated the rotated faults as sinistral strike-slip faults. NW–SE-striking dextral and E–W-oriented reverse faults, considered to be developed in the same dominant strike-slip stress regime, were often observed in the study area.
(6) Instrumental earthquake records and seismic databases indicate the low seismic activity of the study area. However, the characteristics of the observed faults, such as length and amount of displacement, emphasise that the faults have repeatedly produced earthquakes in the historical period and could cause moderate earthquakes in the future. In addition, the compatibility between our fault kinematic results and the stress conditions in NW Iran, GPS vector directions and world stress data show that the study area is currently tectonically active.
6. Supplementary material
Supplementary material is available online at https://doi.org/10.1017/S1755691022000135.
7. Acknowledgements
We are indebted to Rachel Walcott, Handling Editor, and Susie Cox for devoting their valuable time to our paper. We thank Dr. Bora Rojay and the anonymous reviewers for their insightful comments and suggestions, which significantly improved the quality of our paper. Lastly, the authors would like to express deepest appreciation and gratitude to “the Günes” for all the entertainment and emotional support.


 Open access