

1 Introduction
Introduced first by Donna Strickland and Gérard Mourou in the mid-1980s[ Reference Strickland and Mourou 1 ], chirped pulse amplification (CPA) is still the current state-of-the-art technique used in most of the highest-peak power lasers over the world. During the past decade, parallel with the considerable advances of laser materials and laser technologies, several PW-class lasers have been built in the world[ Reference Danson, Haefner, Bromage, Butcher, Chanteloup, Chowdhury, Galvanauskas, Gizzi, Hein, Hillier, Hopps, Kato, Khazanov, Kodama, Korn, Li, Li, Limpert, Ma, Nam, Neely, Papadopoulos, Penman, Qian, Rocca, Shaykin, Siders, Spindloe, Szantmári, Trines, Zhu, Zhu and Zuegel 2 ]. These systems allow the envisioning of extreme light applications, such as high field physics, particle acceleration to relativistic velocity, and medical applications. Two main categories of PW-class systems can be distinguished: Ti:sapphire or nonlinear (NL) optical parametric CPA (OPCPA) based systems[ Reference Yoon, Kim, Choi, Sung, Lee, Lee and Nam 3 – Reference Zeng, Zhou, Zuo, Zhu, Su, Wang, Wang, Huang, Jiang, Jiang, Guo, Xie, Zhou, Wu, Mu, Peng and Jing 6 ] providing ultra-short pulses (~30 fs or shorter) and Nd or Yb doped laser media picosecond (ps) or sub-ps systems[ Reference Tiwari, Gaul, Martinez, Dyer, Gordon, Spinks, Toncian, Bowers, Jiao, Kupfer, Lisi, McCary, Roycroft, Yandow, Glenn, Donovan, Ditmire and Hegelich 7 – Reference Hornung, Liebetrau, Keppler, Kessler, Hellwing, Schorcht, Becker, Reuter, Polz, Körner, Hein and Kaluza 9 ]. In this work we limit our discussion to the most commonly found type of such systems, composed of multi-stage Ti:sapphire-based amplifiers.
Producing extreme laser intensity on the target is the main objective of PW laser systems. The typical set of laser parameter requirements to allow efficient laser–plasma interactions includes ultra-short pulses of high contrast, high pulse energy and an excellent focal spot. In the temporal-spectral domain, these systems need to meet strict requirements in terms of the very large spectral bandwidth management and the spectral phase minimization. In the spatial domain, on the other hand, high-quality, large-aperture laser beams and optical elements are required for supporting high-energy amplification, low aberration beam propagation and near diffraction-limited beam focusing. However, the temporal-spectral and spatial domains are not totally separated from each other in ultra-short-pulse-based PW lasers. The induced space–time/spectral coupling effects are very specific features that could dramatically impact the targeted laser intensity even for the most carefully designed laser systems.
In this work, with the help of the Miró software, a powerful 3D modeling code developed by the CEA DAM, France[ Reference Morice 10 ], we present a synthesis of simulation studies, showing the need for careful consideration of a large number of parameters and the necessity of global optimization of PW-class systems, throughout the different sub-systems of the laser down to the end-chain target area. For our analysis a typical Ti:sapphire-based, multi-PW-class laser configuration is considered. To the best of our knowledge, in this study we introduce complex spatiotemporal (S-T) coupling effects that have not been investigated up until now. Whenever possible, the modeling works presented hereafter are directly compared with experimental observations in the Apollon laser system, a French multi-PW facility[ Reference Zou, Le Blanc, Papadopoulos, Chériaux, Georges, Mennerat, Druon, Lecherbourg, Pellegrina, Ramirez, Giambruno, Fréneaux, Leconte, Badarau, Boudenne, Fournet, Valloton, Paillard, Veray, Pina, Monot, Chambaret, Martin, Mathieu, Audebert and Amiranoff 11 ]. We organize the presentation of our simulation works in three sections: the CPA in Ti:sapphire multi-pass amplifiers; the grating-based temporal stretcher and compressor; and the beam propagation and focusing system.
2 Chirped pulse amplification in a Ti:sapphire multi-pass, multi-stage chain
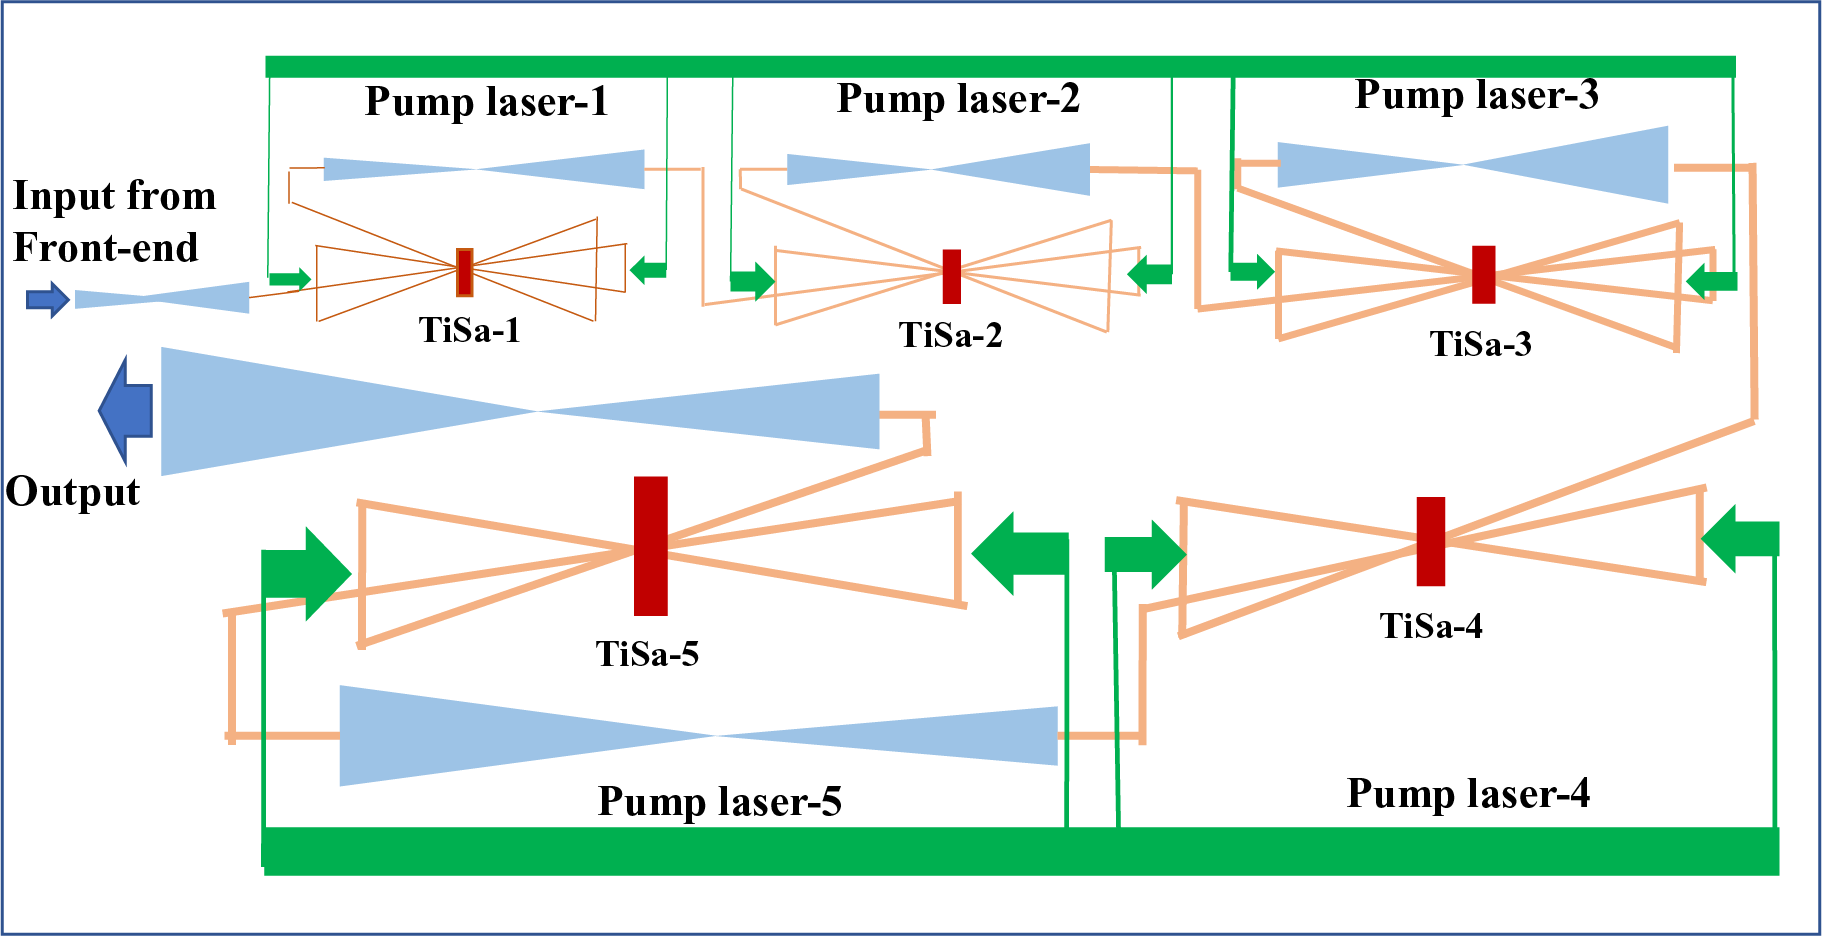
In Figure 1 we provide the scheme of a typical Ti:sapphire amplification chain in multi-PW systems. A front end, considered here as a ‘black box’, provides a set of predefined input laser parameters: low-energy (<10 mJ), large-spectrum chirped pulses (>50 nm full width at half maximum (FWHM), ~1 ns). It is followed by the main amplification section composed of four or five amplification stages with its diameter increasing successively up to approximately 150 mm, configured generally into an oblique multi-pass geometry. A total effective gain of 105 is required. Although each system has its own specificities, typically, two to four passes are realized in each stage pumped in the range of 2 J/cm2 with a corresponding stored fluence in the range of 1.2 J/cm2 and small-signal gain/pass around 3x–5x (assuming a fluence of saturation 0.8 J/cm²). In general, all the amplifiers following the front end are designed to operate in the saturation regime with output fluences of approximately 1 J/cm2 for the first stage and close to 2 J/cm2 for the last one or two stages, depending on the design.
Schematic of a Ti:sapphire-based multi-PW amplification chain.
2.1 Spectrum evolution in a Ti:sapphire multi-PW chain
One of the important capacities of Miró is the possibility of modeling a laser with large spectral bandwidth. The electric field is given by the following:
 $$\begin{align}E(x,y,t)={E}_0(x,y,t)\;\exp \left[ i\varphi \left(x,y,t\right)\right],\end{align}$$
where E 0(x, y, t) is the electric field envelope and φ is a space/time phase function. The physical effects in a CPA laser can be modeled with the ‘instantaneous frequency’ approach:
 $$\begin{align}\omega\;(t)=\partial \varphi /\partial t.\end{align}$$
The temporal steps will evolve according to the instantaneous frequencies, which are characterized by the linear frequency chirp b, which is determined as the ratio between the spectral bandwidth and the chirped pulse duration. Under this assumption, the Frantz–Nodvik model is rewritten as follows:
 $$\begin{align}{I}_{z}(t)&={I}_{z0}(t) \nonumber\\ &\quad \times {\left\{1-\left\{1-{G}_0{\left[\omega (t)\right]}^{-1}\right\}\exp \left\{-\frac{J_0(t)}{J_{\mathrm{sat}}\left[\omega (t)\right]}\right\}\right\}}^{-1},\end{align}$$
where the small-signal gain G 0 and the fluence of saturation J sat are dependent on the frequency ω(t) = 2bt. Spectral properties of the broadband amplification are now completely transferred into the time domain.
As a preparative work of the S-T coupling investigations for a Ti:sapphire-based CPA chain, we focus our interest in the first simulation case on two well-known distortions: the saturation-induced red-shifting and the gain narrowing[ Reference Backus, Durfee, Murnane, Henry and Kapteyn 12 ] generated with a total gain of 106. Their exact impact on the final output pulses is the result of the gain repartition in the laser amplification chain and the saturation level.
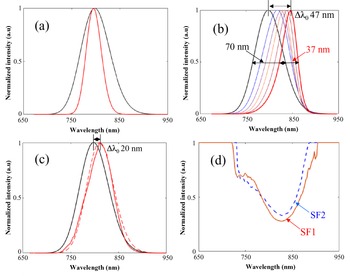
For illustration purposes we first consider the effect in one dimension, starting with the case of a very low injection energy of 1 pJ, allowing one to carry out the amplification far from saturation even with a total gain of 106. We observe the transformation of the incident Gaussian spectrum (λ0 = 800 nm, ΔλFWHM = 70 nm) to the output spectrum with λ0 = 795 nm and ΔλFWHM = 36.7 nm (red line, Figure 2(a)), strongly impacted by the Ti:sapphire gain cross-section.
Normalized input Gaussian spectrum (black line) and amplified spectrum (red line) with a total effective gain of 105: (a) without saturation effect; (b) under gain narrowing and gain saturation; (c) with gain narrowing and (d) with gain saturation compensation performed by two spectral filters, SF1 and SF2, set up in the chain.

We then simulate a more realistic 1D case of few mJ input pulse amplified up to 300 J. Figure 2(b) illustrates the input and the output spectra after each amplification stage. The gain shifting induced by saturation makes the central wavelength λ0 of the incident spectrum shift from 800 to 847 nm. A dramatic spectral narrowing is also observed on the ΔλFWHM from 70 to 37 nm. To compensate for these effects, the use of one or two spectral filters in the amplification chain is the standard approach[ Reference Giambruno, Radier, Rey and Chériaux 13 ]. We show in Figure 2(c) how a targeted output spectrum (dashed red line, for a 15 fs pulse) can be effectively obtained with the use of two well-designed spectral filters, SF1 and SF2, placed at the input of the first and the third amplifiers of the Ti:sapphire chain (Figure 2(d)). Although the same total effective gain of 105 is obtained, the gain narrowing is efficiently mitigated with now ΔλFWHM = 62 nm, supporting a Fourier transformation limited (FTL) pulse duration of 16 fs, and a well-controlled spectral red-shifting of 20 nm is obtained, as required.
2.2 Spatiospectral/spatiotemporal couplings induced by the spatially inhomogeneous gain dynamics in a Ti:sapphire chain
The above effect is generally well considered today, based on simplified 1D simulation models such as the one presented above. It is, however, more difficult to anticipate the spatial aspects of this effect, requiring more complete 3D simulations and design approaches. The sub-aperture local dependence of the gain and the saturation evolution on the amplification chain can have a great impact on the output beam homogeneity and the capacity of the real peak intensity of the amplified beam. As an example of such a spatial dependence, we consider here the simple case of an injection beam of Gaussian spatial distribution. In general, the amplification will lead to the progressive transformation of the beam profile from a Gaussian input to a super-Gaussian output. However, the radial dependence of the gain/saturation balance will impact the spatial homogeneity of the output beam, with the external parts of the beam experiencing more gain (less saturation) in contrast to the central part of the beam reaching almost the full saturation level from the first amplification stage already. As a result, the spectral gain narrowing and red-shifting are expected to evolve also radially.
We use an Apollon typical experimental spectrum and a 5 mJ, 2.5 mm Gaussian beam as input (black curve in Figure 3(a)), injected from the front end into the same chain as described in Section 2.1 . Considering the nominal pump fluences, the spatially averaged output spectral distribution has been calculated for 300 J and a 14 cm flat-top beam (red curve in Figure 3(a)). The output beam is then radially divided into seven circular sub-sections with a constant radius difference of 1 cm (inset of Figure 3(b)). Among the eight spectra obtained from the beam center and the edge of each sub-section, the broadest spectrum with more ‘red-shifting’ is effectively obtained in the center of the output beam where the gain narrowing and the gain shifting are well compensated by the spectral filters (optimized in this example assuming flat-top 1D distributions). However, when we move progressively towards the outer parts of the beam, we observe more and more spectral gain narrowing due to decreased saturation. As a consequence of this radial spectral width evolution, the compressed pulse duration cannot be constant over the beam. As an indication, we estimate first the FTL duration for each one of the eight sub-sections and then the average over the whole beam. Relative to the ideal targeted compression result (15 fs), a pulse duration variation is observed from 12.5 to 18.2 fs.
(a) Normalized experimental spectral input and spatially averaged spectral output, calculated for a 300 J, 14 cm ‘top-hat’ beam, amplified from a 5 mJ Gaussian beam. (b) Output beam spectrum radial evolution: eight output spectra from the beam center (red curve) and the edge of each circular sub-section.

In a complementary representation, we also worked on the near-field distribution along the spectral range of the pulses. Figure 4 represents the normalized spectrally resolved beam intensity as a function of only one of the two spatial directions due to the radial symmetry of the effect. The progressive evolution of the coupling effect throughout the amplification chain (simulated here for the case of the Apollon laser) is shown by the different images (Figures 4(a)–4(d)). The laser intensity I(λ, x, (y = 0)) is calculated in the output of each amplification stage with the energy amplified from 5 mJ to 300 J and with an increased beam diameter from 2.5 to 140 mm, respectively. Along the amplification, the spatial/spectral coupling impact becomes more and more visible, representing clearly the spatial dependence of the spectrum evolution.
Normalized near-field intensity I(λ, x, (y = 0)) evolution along the chirped pulse amplification with the amplified energy from 5 mJ to 300 J and the beam diameter enlarged correspondingly from 2.5 to 140 mm.

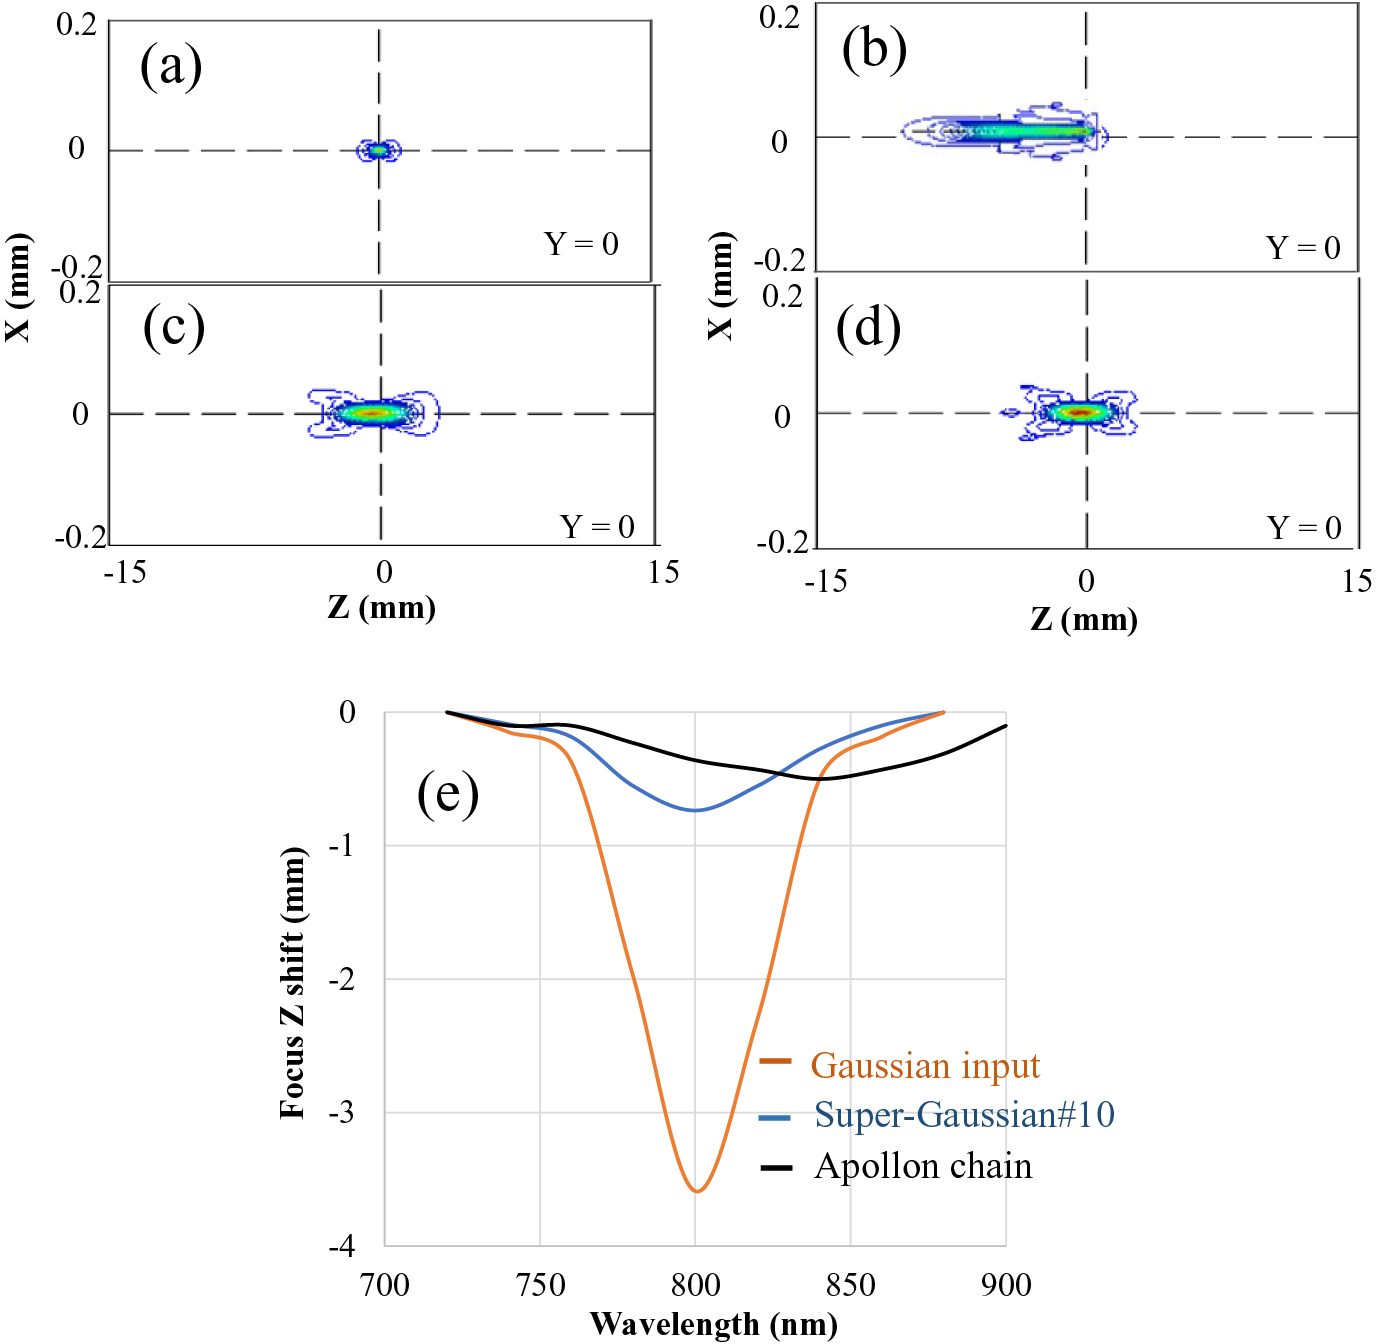
With the same simulation and at the exit of the final amplification stage, we study the normalized output fluence F(x, (y = 0)) not only for the spectrally integrated (averaged) case, but also for a set of selected wavelengths from 740 to 900 nm. We observe in Figure 5, as expected and also experimentally observed in such systems, a flat-top fluence distribution for the totality of the spectrum (red curve). However, very different fluence profiles with respect to the wavelength can be distinguished: longer wavelengths present a Gaussian-like distribution and thus smaller beam diameter, while shorter wavelengths correspond to a larger beam size and a more flat-top-like distribution or even ‘M’ shape for the central part of the spectrum due to the strong gain saturation. This original prediction to the best of our knowledge is in good agreement with recent S-T coupling observations in a Bella PW laser chain[ Reference Jeandet, Borot, Nakamura, Jolly, Gonsalves, Tóth, Mao, Leemans and Quéré 14 ].
Series of normalized output fluence F(x, y = 0) with respect to the wavelength: whole spectrum and λ range from 740 to 900 nm with 40 nm intervals.

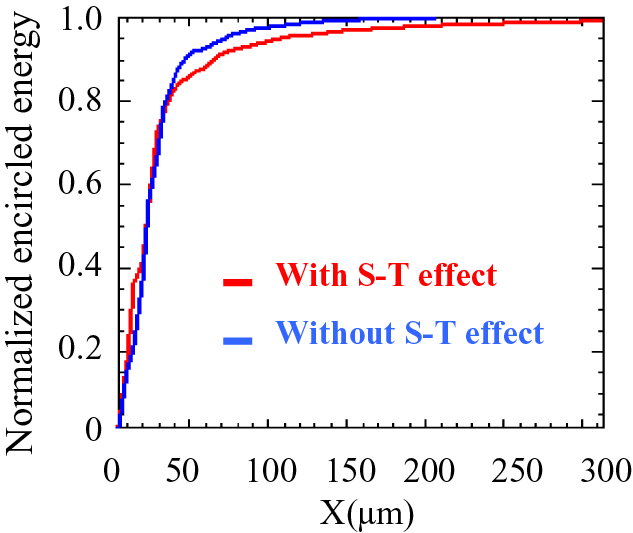
The impact of such spatiospectral inhomogeneity should not be underestimated, especially regarding the impact on the far-field intensity obtained after pulse compression and beam focusing. To evaluate it, we compare the focused intensity obtained after a perfectly aligned compressor and an ideal, aberration and dispersion-free focuser (f = 5 m) of the two inputs. Input 1, obtained from the former calculation with the described spatiospectral coupling; Input 2, a theoretical beam having the same energy but free of any spatiospectral coupling: its spatially averaged spectrum and spectrally integrated spatial profile are obtained using the results of Figures 3(a) and 5. We find a non-negligible 12% difference of the focused intensity in favor of the theoretical fully homogeneous beam. More precisely, the calculation shows an enlargement of the pulse duration (16.4 fs instead of 16 fs) and the focal spot dimension (from 36.9 to 37.8 μm (FWHM)). In addition, Figure 6 illustrates a non-negligible encircled energy degradation observed as the impact of the analyzed S-T effect. It becomes also evident that all other effects responsible for the modification of the local fluence repartition of the beam within the amplification section, such as diffraction effects or gain inhomogeneities, should be ideally taken into account in the global simulation/design of the system for the precise estimation of the expected performances.
Normalized encircled energy of the focus with (red curve) and without (blue curve) the analyzed spatiospectral gain inhomogeneity.
3 Laser pulse stretching–compressing
Pulse stretching and compressing are two important processes for a Ti:sapphire-based multi-PW laser. To investigate the laser pulse stretching–compressing effects, each modeling case presented hereafter is composed of four main blocks after the source: a stretcher, a dispersive medium or a Ti:sapphire chain, a compressor followed by the beam propagation and the focusing section. For the stretcher, we consider a ‘parametric’ one, composed of key elements such as grating pairs and imaging configurations to include correct high-order dispersion terms in ω. The two-grating double-pass and the four-grating unfolded compressors are two commonly used configurations that we examine in what follows.
3.1 Chromatic focal spot generated by grating misalignment
In most of the published simulation works, the effect of grating misalignment is presented, limiting the discussion on the pulsed duration impact and the reduction of the pulse intensity due to the pulse front tilt and the induced angular chirp[ Reference Pretzler, Kasper and Witte 15 , Reference Osvay, Kovacs, Heiner, Kurdi, Klebniczki and Csatari 16 ]. In our Miró model, the beam S-T features could be analyzed not only on the focus and on the main pulse but also around the focus, and before and after the main pulse accessed the complete information of the electric field evolution in the space–time volume of interaction.
Using as an example the parameters of the Apollon 1-PW compressor[ Reference Papadopoulos, Zou, Le Blanc, Ranc, Druon, Martin, Fréneaux, Beluze, Lebas, Chabanis, Bonnin, Accary, Garrec, Mathieu and Audebert 17 ] (1480 lines/mm gratings at an incident angle of 56° and distance of 0.974 m), we first present a simple case on the grating misalignment impact. For a perfect alignment, compressed pulses of 15 fs with its best contrast are obtained. An ideal focuser (f = 3 m) is placed at the output of the compressor to focus the 140 mm super-Gaussian output beam of an order 8. We then consider the residual angular chirp induced by the grating misalignment around the y-axis, perpendicular to the dispersion plan x–z. For Δθ = 0.01° on the second grating, G2, as a parallelism default between gratings G1 and G2, an angular chirp of 1.56 μrad/nm is induced. The pulse front becomes tilted compared to its phase front (energy propagation direction). A considerable pulse duration enlargement from 15 to 73 fs is observed. By re-optimizing then the gratings distance, +90 μm from the initial distance of 974 mm, an optimized pulse duration of 18 fs is obtained with some residual third-order spectral phase errors (Figures 7(a) and 7(b)).
(a) Compressed pulses and (b) induced spectral phases calculated after a double-pass compressor in three different cases: with a perfect grating alignment (black curve); with a default of grating parallelism Δθ = 0.01° (blue curve); and the default compensated by adjusting the compression distance (red curve). (c) Focal spot movement in x with respect to the wavelength. Laser caustic fluence of the focal spot in x–y, x–z and y–z planes: (d) with perfect incident beam and compressor alignment and (e) with the grating G2 misalignment (Δθ = 0.01°).

In order to observe the induced S-T coupling by this grating misalignment, we compare the obtained caustic fluence with that of a perfect focal spot in a 3D box of x and y, ± 200 μm; z, ± 1 cm around the focus. The three graphs in Figure 7(e) illustrate a degraded, asymmetric focal spot, obtained even after re-optimizing the grating distance. It is chromatically stretched in x with a length of more than 200 μm, five times larger than the diffraction-limited focus dimension (Figure 7(c)). The S-T Strehl ratio of the peak intensity decreases dramatically to 5% and the reduced spatial and temporal contrast is observed in all three directions.
3.2 Spatial-to-spectral phase coupling generated in a multi-PW compressor
Moving a little further on the complexity of coupling effects, we now focus on spatial-to-spectral phase coupling, recently studied by some of the laser facilities around the world[ Reference Li, Tsubakimoto, Yoshida, Nakata and Miyanaga 18 , Reference Leroux, Eichner and Andreas 19 ]. The effect mainly occurs on the stretcher–compressor components where the spectrum is spatially dispersed. We refer to low-order wavefront aberrations, whereas the rugosity issues are not discussed in this paper. In our model, we can characterize quantitatively the spectral phase generated from the residual spatial phase on the specific compressor elements and study its impacts on the final compressed pulse and S-T Strehl ratio on the focus.
The example we present concerns the Apollon 10 PW compressor, which is based on a typical four-grating unfolded configuration employing four meter-size gold gratings (910 mm × 455 mm) manufactured by Lawrence Livermore National Laboratory (LLNL). The incident beam has a ‘flat-top’ distribution and is as large as 400 mm. An ideal focuser (f = 5 m) is set up at the exit of the compressor to study the S-T Strehl ratio on the focus.
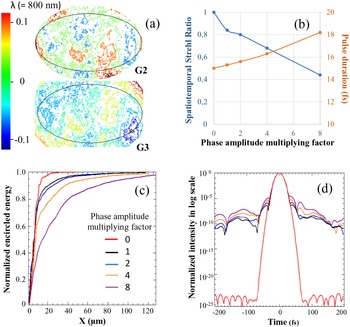
One of the main simulation objectives, given the wavefront errors of the available gratings, is the definition of the optimal grating arrangement in order to optimize the focused laser intensity. The simulation results show that the highest spatial quality gratings should be placed in the second and third positions where the spatial-to-spectral phase coupling is most critical. We selected two gratings G2 and G3 with their residual phase characterized by only low-frequency Zernike aberrations, measured at λ/6 and λ/8, respectively, as peak to valley (PtV) inside the beam zone (Figure 8(a)). Compared with other grating arrangements, the impact of the generated spectral phase is effectively mitigated, so that the pulse S-T degradation could be efficiently minimized to 0.3 fs from a targeted 15 fs. With the global wavefront errors of λ/3 (PtV) of all four gratings, measured at the exit of the compressor, the total S-T Strehl ratio is estimated around 84%. In our model, it is possible to compensate for the pure spatial contribution of these errors by subtracting at the output of the compressor the spectrally integrated (averaged) beam wavefront. We can see, therefore, how much the intensity can be further optimized by means of the focal spot quality improvement, realized typically by adaptive-optics wavefront correction techniques. The calculated prediction shows that an optimized intensity with a final S-T Strehl ratio of more than 95% could be expected.
(a) Measured residual spatial phases of the gratings G2 and G3 of the Apollon 10 PW compressor (ellipse: 900 mm long axis and 400 mm short axis). (b) Induced degradations in spatiotemporal Strehl ratio (blue curve) and in compressed pulse duration (orange curve). (c) Normalized encircled focal spot energy and (d) temporal contrast observed in the range of ±200 fs around the main pulse, when the spatial phase amplitude increases for all four gratings in the Apollon 10 PW compressor with the phase amplitude multiplying factor rising from 0 (red curves) to 8 (purple curves).

Finally, to determine the surface quality specifications of the gratings used in a multi-PW compressor, we carry out a parametric investigation to evaluate the impact of the amplitude of the wavefront errors induced by all four gratings on the compressed pulse and focal spot qualities. Under the optimized grating arrangement and for all four gratings, we make the amplitude of the residual spatial phase double each time while keeping their overall form. Figure 8(b) (blue curve) shows that when the multiplying factor of the phase amplitude increases from 0 to 8, the S-T Strehl ratio decreases from 100% to 44%. More precisely, it can be characterized by the compressed pulse duration enlargement from 15 to more than 18 fs (Figure 8(b), orange curve), the dramatic focal spot deterioration with the encircled energy reduced to 60% inside the diffraction-limited focus dimension (Figure 8(c)) and a strong temporal contrast degradation as well (Figure 8(d)). Figure 8(d) shows that the spatial-to-spectral phase coupling induced on the G2 and the G3 generates important degradation in laser contrast, even with very small phase amplitude. In our case, laser contrast decreases to the level between 10–10 and 10–5 in the range of ±200 fs with the wavefront errors (PtV) λ/6 on the G2 and λ/8 on the G3, while the increase in spatial phase amplitude (with the wavefront errors 1.3λ on the G2 and 1λ on the G3) remains rather moderate on laser contrast variations.
4 Laser spatiotemporal coupling investigations in the laser far field
In Sections 2 and 3, we found that some of the spatial causes or defaults may become the origin of the pulse degradation because of the induced spatial dependence of the spectral amplitude and the spectral phase deterioration. In this section, we will study more in detail three less known S-T coupling effects and their expression in the laser far field: the spectral clipping induced on the edges of the compressor gratings; the longitudinal chromatic focus shifting generated by the NL Kerr effect; and the mirror coating dephasing issues as a function of the incident beam polarization.
4.1 Spectral clipping at the edges of the compressor gratings
The first effect is related to the gratings and the impact of their limited size used in high-intensity compressors. We focus our investigation on the beam diffraction effect at the edges of the second grating, G2, and the third grating, G3, for a four-grating unfolded compressor where the beam is spectrally dispersed. The same effect is expected in the case of the second grating, G2, of a compressor in a double-pass configuration. We use the parameters of the Apollon 10 PW compressor as an example for this analysis: for the pulse compression of a 150 J, Φ400 mm large beam, four gratings of 910 mm × 455 mm are used with the incident angle of 56°. In our model we assume four 900 mm × 450 mm rectangular hard apertures in front of each one of the gratings representing their useful area. Since the beam is spectrally dispersed on the gratings G2 and G3, it is very difficult to prevent completely a spatiospectral variation as the impact of the diffraction effect. Even though no significant energy transmission losses (<1%) and no modification of the compressed pulse duration are observed due to these hard apertures, the spectral diffraction has a considerable impact on the output pulse contrast.
Our first observation is realized in the near field of the beam, directly at the output of the compressor. Figure 9(a) illustrates the corresponding spectra on the beam center and on the beam edges (R = ±200 mm). We can see clearly the spectral modulation generated by the diffraction at the outer part of the beam corresponding to the long wavelengths (λL, red curve) and the short wavelengths (λS, blue curve) of the pulse. It is important to note that the apodization is a gradual effect as a function of wavelength and there is a huge amplitude difference of more than five orders of magnitude among the spectra on the beam center and the beam edges. As a consequence, the main pulse duration is not modified. However, the temporal contrast observed decreases considerably. Figure 9(b) presents both the compressed pulses with and without spectral clipping in log-scale. With spectral clipping, the compressed pulse contrast decreases to 10–7–10–6 in the region of ±350 fs. In the laser far field realized by an ideal focuser (f = 5 m) setup at the exit of the compressor, the observed intensity evolution is quite unusual. We can clearly distinguish an important secondary, highly dispersed structure sweeping across the focus both in space and in time. In fact, the spectral diffraction generated by the spectral clipping at the grating edges is the origin of the induced spatiospectral coupling effect. After pulse compression and near the focus, this effect is naturally expressed as an S-T coupling effect: a complex space–time coupled pedestal of about 106 times lower than the main peak, as illustrated in Figure 9(c): the continuous pedestal, extending over ±600 μm in the x-direction (on the diffraction plane) around the focal spot is represented by the discretized intensity I(x, y = 0) at different times in the region of ±260 fs around the main pulse peak. Figure 9(d) shows the corresponding pedestal movement in x and in time.
(a) Normalized spectra in the beam center and two beam edges: spectral modulation is generated by the limited size of the grating G2 (Apollon 10 PW compressor). (b) Normalized peak power of the compressed pulse (in log) with and without spectral clipping. (c) Far-field S-T laser intensity observation around the focal spot (±600 μm in x) and main pulse (±260 fs in time scale). (d) Main pulse and focal spot pedestal movement in time and in space.

Such an effect could be highly disturbing for all high-intensity experiments sensitive to the contrast in space and time. Furthermore, the related specific time and space scales make this effect very difficult to experimentally observe, while measurement of such features would require a high dynamic range device, assuring both temporal and spatial resolution.
4.2 Longitudinal chromatic focus shifting generated by the nonlinear Kerr effect
As a second example in this section we investigate the impact of the optical Kerr effect on the spectral homogeneity of the beam wavefront. A similar effect has been recently studied in the context of monochromatic kJ-class lasers[ Reference Simpson, Ramsey, Franke, Vafaei-Najafabadi, Turnbull, Froula and Palastro 20 ]. To the best of our knowledge this is the first time that the Kerr nonlinearity has been discussed in the frame of high-intensity femtosecond lasers and its contribution to the chromatic focal shift and the consequent intensity degradation.
In a CPA system the intensity of the stretched pulses varies in time in an almost proportional manner to the spectral intensity form. This means that under the assumption of an instantaneous response of an NL medium with NL refractive index n 2 and thickness d, we can express the Kerr NL phase shift as a time/wavelength varying function. For the simplest case of a Gaussian spectrum pulses, the NL phase φNL can be therefore described as a Gaussian function of λ, with
 $$\begin{align}{\varphi}_{\mathrm{NL}}\left(\lambda \right)=\left(\frac{2\pi d}{\lambda_0}\right){n}_2I\left(\lambda \right),\end{align}$$
where $I\left(\lambda \right)={I}_0\mathit{\exp}{\left[-\left(\lambda -{\lambda}_0\right)/\Delta \lambda \right]}^2$
and I
0 is the peak intensity of the pulses, occurring at the central wavelength λ0. While the impact of this phase term is well known in the time domain (so-called self-phase modulation), its spatial impact is less studied. If we consider a Gaussian distribution for the beam of radius R (in 1/e²), in a first approximation we can estimate the full beam self-focusing by the Kerr lens effect given by the following formula[
Reference Hasnaoui, Fromager and Ait-Ameur
21
]:
$I\left(\lambda \right)={I}_0\mathit{\exp}{\left[-\left(\lambda -{\lambda}_0\right)/\Delta \lambda \right]}^2$
and I
0 is the peak intensity of the pulses, occurring at the central wavelength λ0. While the impact of this phase term is well known in the time domain (so-called self-phase modulation), its spatial impact is less studied. If we consider a Gaussian distribution for the beam of radius R (in 1/e²), in a first approximation we can estimate the full beam self-focusing by the Kerr lens effect given by the following formula[
Reference Hasnaoui, Fromager and Ait-Ameur
21
]:
 $$\begin{align}{F}_{\mathrm{NL}}^{-1}=\left(\frac{8{n}_2d}{\pi {R}^4}\right)I,\end{align}$$
where I is the intensity. Assuming again the wavelength-dependent intensity, we can now express the self-focusing dioptric power as a wavelength varying function:
 $$\begin{align}{F}_{\mathrm{NL}}^{-1}\left(\lambda \right)=\left(\frac{4{\lambda}_0}{\pi {R}^2}\right){\varphi}_{\mathrm{NL}}\left(\lambda \right).\end{align}$$
Focusing such a beam at a short focal distance F, compared to the F
NL, will have as an impact the displacement of the focal point longitudinally to about ${\left(1/F+1/{F}_{\mathrm{NL}}\right)}^{-1}$
, resulting in a chromatic focus spread of
${\left(1/F+1/{F}_{\mathrm{NL}}\right)}^{-1}$
, resulting in a chromatic focus spread of $\Delta F\left(\lambda \right)={F}^2/{F}_{\mathrm{NL}}\left(\lambda \right)$
. Expressing this spread in terms of Rayleigh length units Z
r would result in
$\Delta F\left(\lambda \right)={F}^2/{F}_{\mathrm{NL}}\left(\lambda \right)$
. Expressing this spread in terms of Rayleigh length units Z
r would result in $\Delta F\left(\lambda \right)=\left[{Z}_{\mathrm{r}}\left(\pi /{\lambda}_0\right){R}^2\right]/{F}_{\mathrm{NL}}\left(\lambda \right)$
or equivalently in the following:
$\Delta F\left(\lambda \right)=\left[{Z}_{\mathrm{r}}\left(\pi /{\lambda}_0\right){R}^2\right]/{F}_{\mathrm{NL}}\left(\lambda \right)$
or equivalently in the following:
 $$\begin{align}\Delta F\left(\lambda \right)=4{Z}_{\mathrm{r}}{\varphi}_{\mathrm{NL}}\left(\lambda \right).\end{align}$$
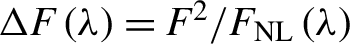
To have a better insight into the effect and investigate its impact in real world PW-class systems, we used the Miró software in a series of simulation cases. We first consider a Gaussian beam with 140 mm diameter (1/e²) and a chirped pulse of approximately 1 ns stretched from 15 fs. The beam is going through an NL medium just before being focused by an ideal focuser of f = 3 m. Varying the energy of the beam, we study the laser focus evolution in caustic fluence for a B-integral increasing from 0 to 1 rad. Comparing with a perfect focal spot (without any NL phase shift, Figure 10(a)), the impact on the focus is quite visible (Figure 10(b)): the focal spot becomes dissymmetric in z and spreads over the z-axis in the negative direction (closer to the focusing element). In Figure 10(e), we plot the wavelength-dependent z shifting of the focus under B = 1 rad (orange curve). A maximum shift of approximately 3.6 mm is observed for the central wavelength, while a Gaussian-like evolution of the shift is predicted for other wavelengths. The calculation results are in good agreement with our simplified analytical model that predicts a maximum shift of approximately 3.8 mm. The impact of this NL chromatic shift on the focused intensity is important, which decreases from 1.7 × 10¹¹ to 5.2 × 10¹⁰ W/m², measured in the best focal position in z for a B-integral varying from 0 to 1 rad. Modifying the input beam to a super-Gaussian one of the order of 10 and of the same beam diameter at 1/e² results in a small focus degradation (Figure 10(c)) and, as expected, a reduced maximum z shifting of approximately 0.7 mm, about five times smaller than in the former case (blue curve, Figure 10(e)).
Focus caustic fluence in the x–z plane of a 14 cm beam: (a) in Gaussian distribution, without suffering any NL effect; (b) in Gaussian distribution, with B-integral of 1 rad; (c) in super-Gaussian beam distribution of the order of 10, with B-integral of 1 rad. (d) Apollon chain with output 300 J and B-integral of 1 rad. (e) NL focus z shift with respect to the wavelength under a B-integral of 1 rad and for a 14 cm beam: with as beam input Gaussian distribution (orange curve), super-Gaussian distribution of the order of 10 (blue curve) and the amplified Apollon beam described in Section 2 (black curve).
A similar focal spot analysis is finally carried out on an Apollon-like Ti:sapphire chain. A 14 cm amplified (300 J) beam with an accumulated NL phase of 1 rad is focused by the same focuser. A quasi symmetric focal spot is obtained for the totality of the spectrum (Figure 10(d)). The focus z shifting, analyzed with respect to wavelength, shows a similar maximum value as in the case of flat-top beam input (black curve, Figure 10(e)). In fact, as already explained, under the gain saturation during the beam energy amplification in the chain, the initial Gaussian distribution of the injected beam is quickly transformed into a flat-top one, reducing considerably the Kerr lens effect induced in the last amplifiers. In addition, this NL focus evolution is obviously coupled with the spectrum evolution by the gain red-shifting in the Apollon chain. The investigation of the complex S-T coupled NL effect in a Ti:sapphire-based multi-PW laser remains important. It deserves to be analyzed on a case-by-case basis to guarantee the focus quality on the target of laser–plasma interactions.
4.3 Chromatic depolarization defects in the focus induced by mirror coating dephasing
As a last example of our study we investigate the mirror coating dephasing issues for a Ti:sapphire-based multi-PW laser where the pulses have a very broad spectral bandwidth and a large number of mirrors set up in the chain have complex multilayer coating structures. The spectral phase generated by such mirrors during beam propagation could disrupt the targeted pulse duration and contrast. In addition, in such laser systems, where complex experimental beam configurations are required, transport mirrors to the target are often used in ‘out-of-plane’ configurations, where the incidence plane of the beam is neither parallel (P-polarization) nor perpendicular (S-polarization) to the polarization of the beam. In this case, two orthogonal polarization components of the reflected beam may accumulate different spectral phases, resulting in complex chromatic depolarization defects in the focus. In what follows, we consider the example of two coating types used in the Apollon laser system: a multi-layer dielectric (MLD) coating and a hybrid metallic-dielectric (MMLD) coating, both designed to provide large bandwidth reflectivity and low dispersion characteristics[ Reference Papadopoulos, Zou, Le Blanc, Chériaux, Georges, Druon, Mennerat, Ramirez, Martin, Fréneaux, Beluze, Lebas, Monot, Mathieu and Audebert 22 ]. On these mirror samples, we carry out spectral reflectivity R(λ) measurements using a spectrophotometer (CARY5000) and spectral phase ϕ(λ) measurements using a commercial white light spectral interferometer[ Reference Diddams and Diels 23 ] in the spectral range of 700–900 nm.
To evaluate the impact on the final laser temporal characteristics by the generated spectral phase in these two types of coatings, a Miró simulation case is elaborated. As an example, the source produces the specific 45° configuration where the S and P rectilinear polarization components of the incident beam are equal. As the input beam we considered an ideal 15 fs Gaussian pulse. For each one of the polarization components we apply the measured reflectivity R(λ) and spectral phase ϕ(λ) corresponding to the two types of coatings. The electric field of the combined laser beam is then calculated and allows us to evaluate its final temporal features.
As illustrated in Figure 11(a), considering that the MLD coating of the specific mirror sample is optimized for the S-polarization, the spectral phase in P-polarization reaches high values at the edges of the spectrum, approximately 6 rad PtV, while the spectral phase induced for S-polarization is relatively low and flat over the full spectral range. Regarding the mirror sample with MMLD coating, both spectral phases in P-polarization and in S-polarization remain similar and with low amplitude. After the beam combination and focusing, the calculation performed for the MLD sample shows that the average pulse duration is enlarged to 15.8 fs for the P-polarization and to 15.1 fs for the S-polarization. A dramatically degraded contrast in the ±100 fs temporal range is also observed for the combined field (blue curve, Figure 11(b)). The dephasing effect on the other hand produced by the MMLD coating is totally negligible: there is neither pulse duration enlargement nor visible degradation on the temporal contrast (red curve, Figure 11(b)).
(a) Measured spectral phases in P- and S-polarizations generated by MLD and MMLD mirror coatings. (b) Laser pulse peak power observed at the focus in log-scale: black, mirror coating without any spectral phase; red, mirror with MMLD coating; blue, mirror with MLD coating.

5 Conclusions
Multi-PW lasers have been constructed around the world in recent decades. Whatever their design and technical details, producing extreme laser intensity on the laser–plasma interaction target is one of the most important objectives. Careful consideration and optimization of the parameters and the sub-systems of such lasers according to ‘the traditional way’ are no longer sufficient. The S-T coupling effects generated in such systems make the design and implementation requirements for pulse stretching–compression, amplification, beam propagation and focusing much more complex. Furthermore, the S-T effects cannot be all measured correctly nowadays, due to the complexity of the phenomena and the related specific time and space scales, which in certain cases need single shot S-T diagnostics with high dynamic range and excellent space–time resolution. In this context, we carried out the in-depth simulations of six specific S-T coupling effects often disregarded or even completely ignored in the design of current multi-PW laser systems. All our modeling works are performed for the category of the Ti:sapphire-based system, based on realistic experimental parameters and/or laser schemes inspired by the Apollon laser system. Our results clearly show that ultra-intense laser performance can be considerably degraded with such S-T coupling effects, especially if they are accumulated. To optimize the performance of multi-PW-class laser systems and to achieve targeted laser intensity, the examined effects should be carefully taken into consideration for the better understanding, the accurate experimental characterization and the mitigation of these detrimental effects. Further research and development efforts are required to evaluate experimentally the impact of cumulated S-T coupling effects on the focused laser intensity, particularly in the direction of adequate metrology technology for their precise characterization and control[ Reference Jolly, Gobert and Quéré 24 ].
Acknowledgments
The authors acknowledge Olivier Morice and Claude Rouyer for useful discussions.


 Open access