


1. Background
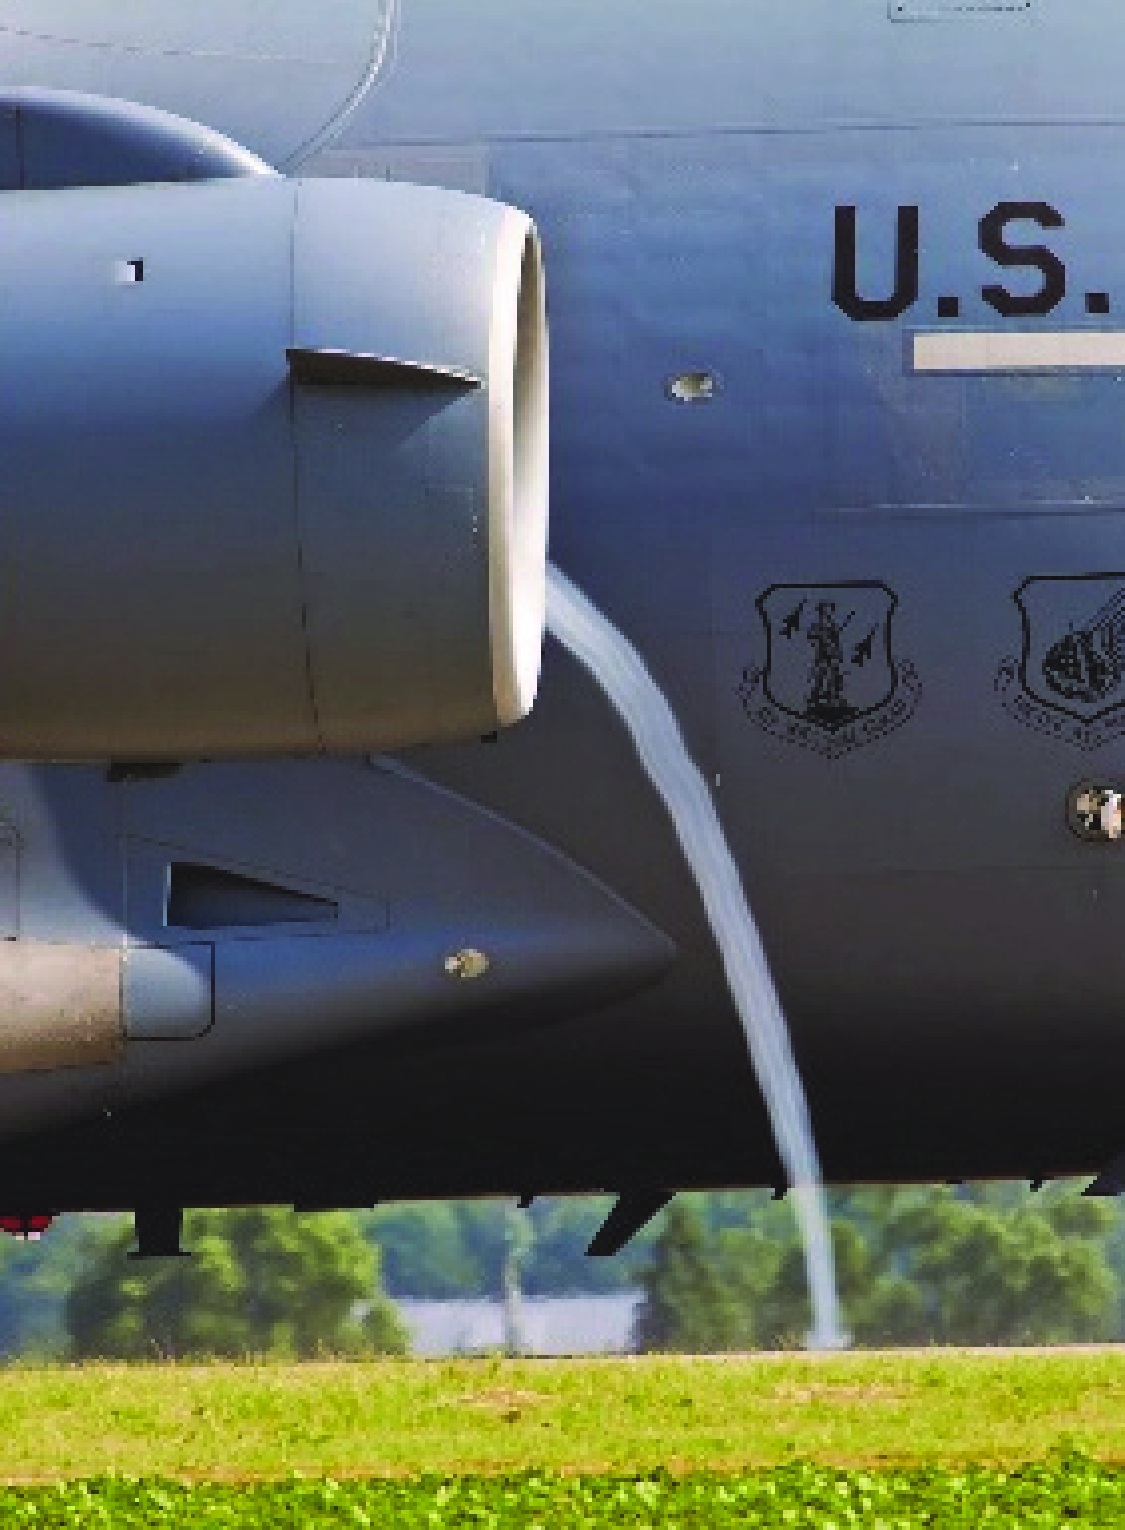
It has been recognised since the early days of commercial jet aviation in the 1950s that low-speed aircraft operation close to the ground during takeoff and landing can detrimentally impact the performance of the jet engines due to the presence of the ground surface and cross-wind (e.g. Klein Reference Klein1953). While cross-wind alone can induce inlet flow separation (Hall & Hynes Reference Hall and Hynes2005) and lead to the formation of a fuselage vortex (Breitsamter Reference Breitsamter2011), the proximity of the engine nacelles to the ground in a cross-wind can spawn a columnar vortex off the ground (Colehour & Farquhar Reference Colehour and Farquhar1971; Trapp & Girardi Reference Trapp and Girardi2010), as illustrated in figure 1. Ingestion of the vortex into the engine can result in total pressure losses and distortion at the engine face and the potential ingestion of ground objects into the engine that can cause catastrophic failures. The ingestion of foreign objects by a ground vortex was investigated by Klein (Reference Klein1953), who later (Klein Reference Klein1957) noted that approximately 50 % of all engines removed from aircraft at the time had been damaged by ingestion of foreign objects.
A ground vortex at the engine inlet of a Boeing C-17 Globemaster III during reverse thrust operation visualised by a domain of condensed water vapour within the vortex core (B. Lindsay, 2023, private communication).
The dependence of the formation of ground vortices on the engine height and the inlet and cross-wind speeds was investigated using a full-scale model by Rodert & Garrett (Reference Rodert and Garrett1955), who suggested that the formation was associated with the appearance of a stagnation point on the ground surface under the inlet. In a later water tunnel investigation of the mechanism of the ground vortex, De Siervi et al. (Reference De Siervi, Viguier, Greitzer and Tan1982) argued that this stagnation point results from the interaction of the inlet’s stream tube or capture surface of the suction flow with the ground plane and that a stagnation streamline connects between the stagnation point and the inlet. They maintained that the outer rotational flow surrounding the inlet contained a vertical component of ambient vorticity and postulated that the pre-existing upstream vortical filaments become convected and concentrated about the stagnation streamline which is responsible for the formation of the inlet vortex. In a later wind tunnel investigation using a cylindrical inlet model, Liu, Greitzer & Tan (Reference Liu, Greitzer and Tan1985) showed that the ratio of the mean inlet and cross-wind speeds at which a ground vortex is first formed in their experiments (V/U o ) varied linearly with the elevation of the inlet above the ground plane normalised by its diameter (H/D). Similar findings were reported in the follow-on wind tunnel experiments of Shin et al. (Reference Shin, Greitzer, Cheng, Tan and Shippee1986), who compared results with inlets of varying diameter and orientation relative to the cross-flow and additionally measured the dependence of the circulation of the ground vortex on the inlet diameter D and suction flow speed V, cross-flow speed U o and the inlet elevation above the surface H. These authors reported that the vortex strength, as measured by its circulation, increases with the velocity ratio and decreases with the ground plane distance. The range of the velocity ratio data of Liu et al. (Reference Liu, Greitzer and Tan1985) was extended by Nakayama & Jones (Reference Nakayama and Jones1996, Reference Nakayama and Jones1999), who added data for H/D as low as 0.95 and Mach numbers up to 0.6 and presented a functional relationship for the linear dependence of V/U o on H/D. A number of later studies of ground vortices were based on the notion of De Siervi et al. (Reference De Siervi, Viguier, Greitzer and Tan1982) that ground vortices in inlets originate from interactions of rotational cross-flow with the stagnation streamline that is formed by the inlet suction flow (e.g. Nakayama & Jones Reference Nakayama and Jones1999; Yadlin & Shmilovich Reference Yadlin and Shmilovich2006; Wang & Gursul Reference Wang and Gursul2012). Following the measurements of Shin et al. (Reference Shin, Greitzer, Cheng, Tan and Shippee1986), Brix, Neuwerth & Jacob (Reference Brix, Neuwerth and Jacob2000) performed comprehensive wind tunnel experiments and noted that the circulation of the vortex increased with either U o through the production of circulation around the inlet surface or V by vortex stretching. The effects of a horizontally moving ground plane to simulate realistic takeoff conditions at low velocity ratios between the cross-wind and inlet speeds was investigated by Murphy, MacManus & Sheaf (Reference Murphy, MacManus and Sheaf2010) in a wind tunnel. These authors showed that the ground vortex over the moving plane was weaker, steadier and more symmetric compared with a ground vortex that forms over a stationary ground plane. The effects of the yaw angle of the inlet centreline relative to the cross-flow and its elevation over the ground plane were investigated by Murphy & MacManus (Reference Murphy and MacManus2011), who showed that a stronger vortex formed at lower ground plane clearances and higher inlet yaw angles.
It is noteworthy that, in addition to the mechanism of ground vortex formation by vorticity concentrations in the cross-flow proposed by De Siervi et al. (Reference De Siervi, Viguier, Greitzer and Tan1982), these authors also considered the formation of a ground vortex in an irrotational cross-flow in which the vorticity could be advected off the outer surface of the inlet in the absence of boundary layer vorticity. This conjecture was supported by a water channel demonstration using adjacent parallel nacelles in close proximity above one another in the absence of a ground plane. While the authors also mentioned that, in principle, a ground vortex can form off the ground plane boundary layer, this mechanism was deemed non-essential. The formation of the ground vortex by the vorticity layer over the outer surface of the inlet in an irrotational cross-flow was elaborated further by Shin et al. (Reference Shin, Greitzer, Cheng, Tan and Shippee1986), who noted that an inlet in cross-wind over a ground plane develops two counter-rotating tip or trailing vortices off its leeward side. These authors conjectured that as the inlet’s capture surface grows with increased suction, it ultimately interacts with the ground plane and the lower trailing vortex can abruptly migrate downward, attach to the ground plane as its diameter decreases and form the ground vortex while simultaneously, the upper trailing vortex becomes centred on the leeward side of the nacelle and its cross-sectional area becomes comparable to the inlet diameter. The recent numerical investigations of Trapp & Girardi (Reference Trapp and Girardi2010, Reference Trapp and Girardi2020) indicated a number of different possible interactions between the trailing and ground vortices. More importantly, these authors showed that the source of vorticity for the ground vortex can also come from the ground plane boundary layer that provides a large contact area with the inlet capture surface.
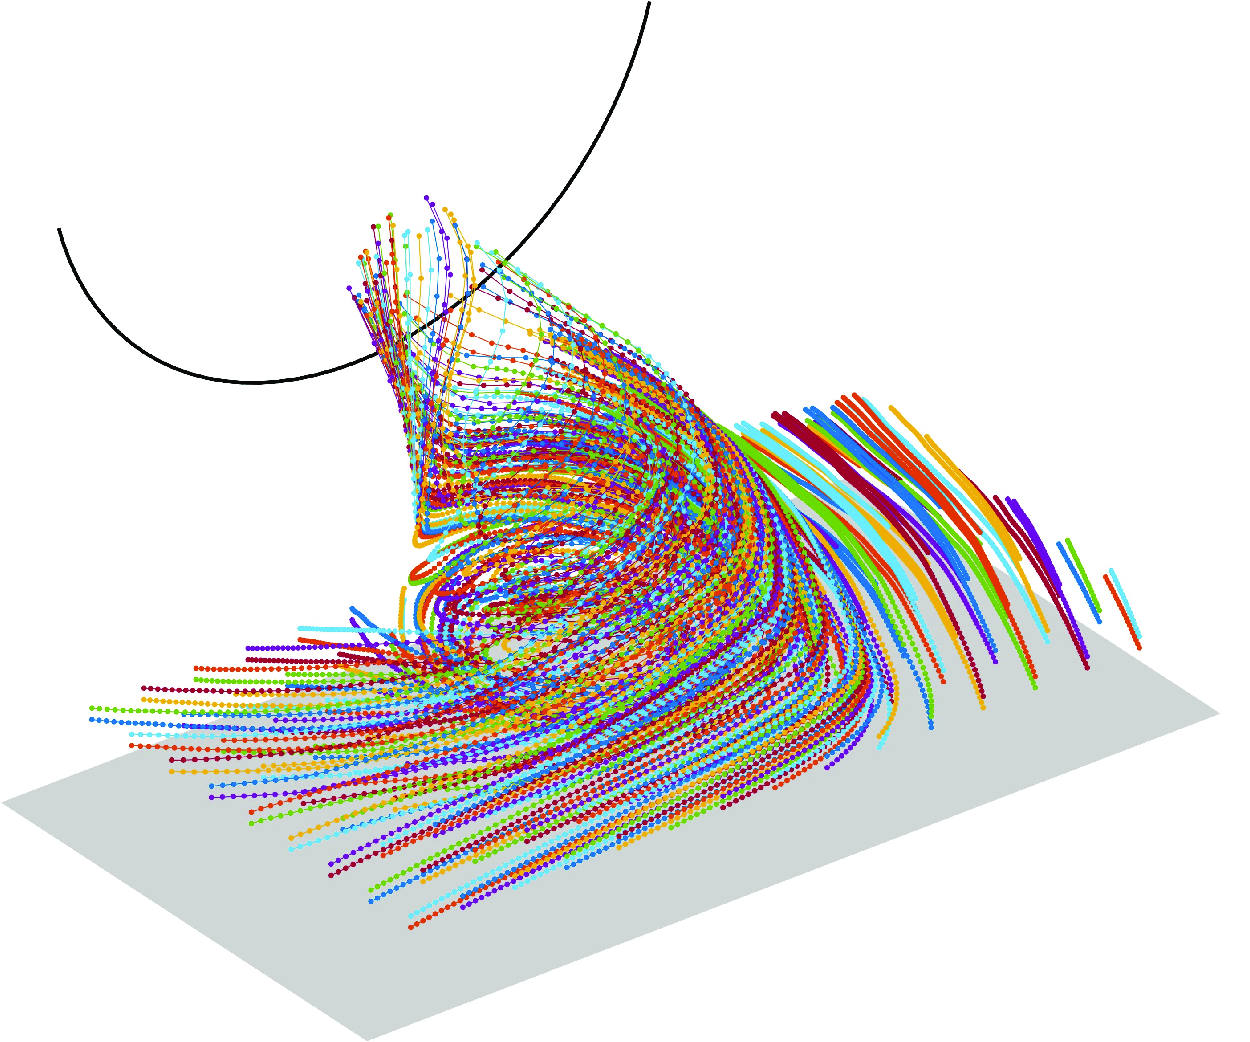
Similar to earlier works, the present experimental investigations are motivated by the ingestion of ground vortices into engine nacelles. Specifically, the present work considers transitory aspects of the initiation, formation and evolution of a ground vortex within an interaction domain between an irrotational cross-flow over a plane surface and the suction into a cylindrical conduit whose axis is normal to the cross-flow and parallel to the ground plane. Particular emphasis is placed on the effect of the suction flow on the surface vorticity layer that engenders wall-normal columnar vortices and plays a crucial role in their ultimate ingestion into the inlet and in the sustainment of the ground vortex.
2. Experimental set-up and flow diagnostics
The present investigation was conducted in an open-return, low-speed wind tunnel having a test section measuring 1.07 m × 1.07 m and 3.05 m long (maximum speed U o = 32 m s–1, flow uniformity within 1 %) that is driven by a computer-controlled axial blower through a 10 : 1 contraction. A moveable cylindrical axisymmetric nacelle model protrudes through the sidewall of the test section such that its centreline coincides with the test section’s horizontal centre plane and is normal to the free stream, and its inlet plane is aligned with the test section’s vertical centre plane, as shown in figure 2(a). The bottom wall of the test section is replaced with a vertically adjustable ground plane whose elevation below the centreline of the inlet can be continuously adjusted to within 0.25 mm using electromechanical risers (figure 2 a). The modular axisymmetric model shown in figure 2(a) includes an inlet section whose entrance plane diameter at its axial apex is D = 0.194 m and is connected to an axisymmetric conduit (I.D. = 0.176 m) that is part of a suction blower assembly. The computer-controlled suction blower is mounted on a moveable cart to enable adjustment of the model within the test section, and its exhaust issues into the ambient air through an integrated chilled water heat exchanger that maintains the ambient air temperature to within 1 °C.
The nacelle inlet model: (a) a view along the cross-flow showing the coordinate system centred on the inlet having a tip diameter D (the tunnel streamwise coordinate is x) and the internal location of the total pressure rake (![]() ) 0.40D downstream of the inlet plane; (b) front view of the total pressure rake within the inlet (internal diameter d). The clockwise azimuthal coordinate
) 0.40D downstream of the inlet plane; (b) front view of the total pressure rake within the inlet (internal diameter d). The clockwise azimuthal coordinate $\theta$
marks the positions of the individual rakes, r
′ measures radial distance from the inner surface, H is the elevation of the centreline above the surface and z
′ measures height above the surface plane; and (c) the radial locations of the total pressure probes of each rake (
$\theta$
marks the positions of the individual rakes, r
′ measures radial distance from the inner surface, H is the elevation of the centreline above the surface and z
′ measures height above the surface plane; and (c) the radial locations of the total pressure probes of each rake ( $\circ$
) with the locations of two additional probes at θ = 45°, 135°, 225° and 315° (•).
$\circ$
) with the locations of two additional probes at θ = 45°, 135°, 225° and 315° (•).
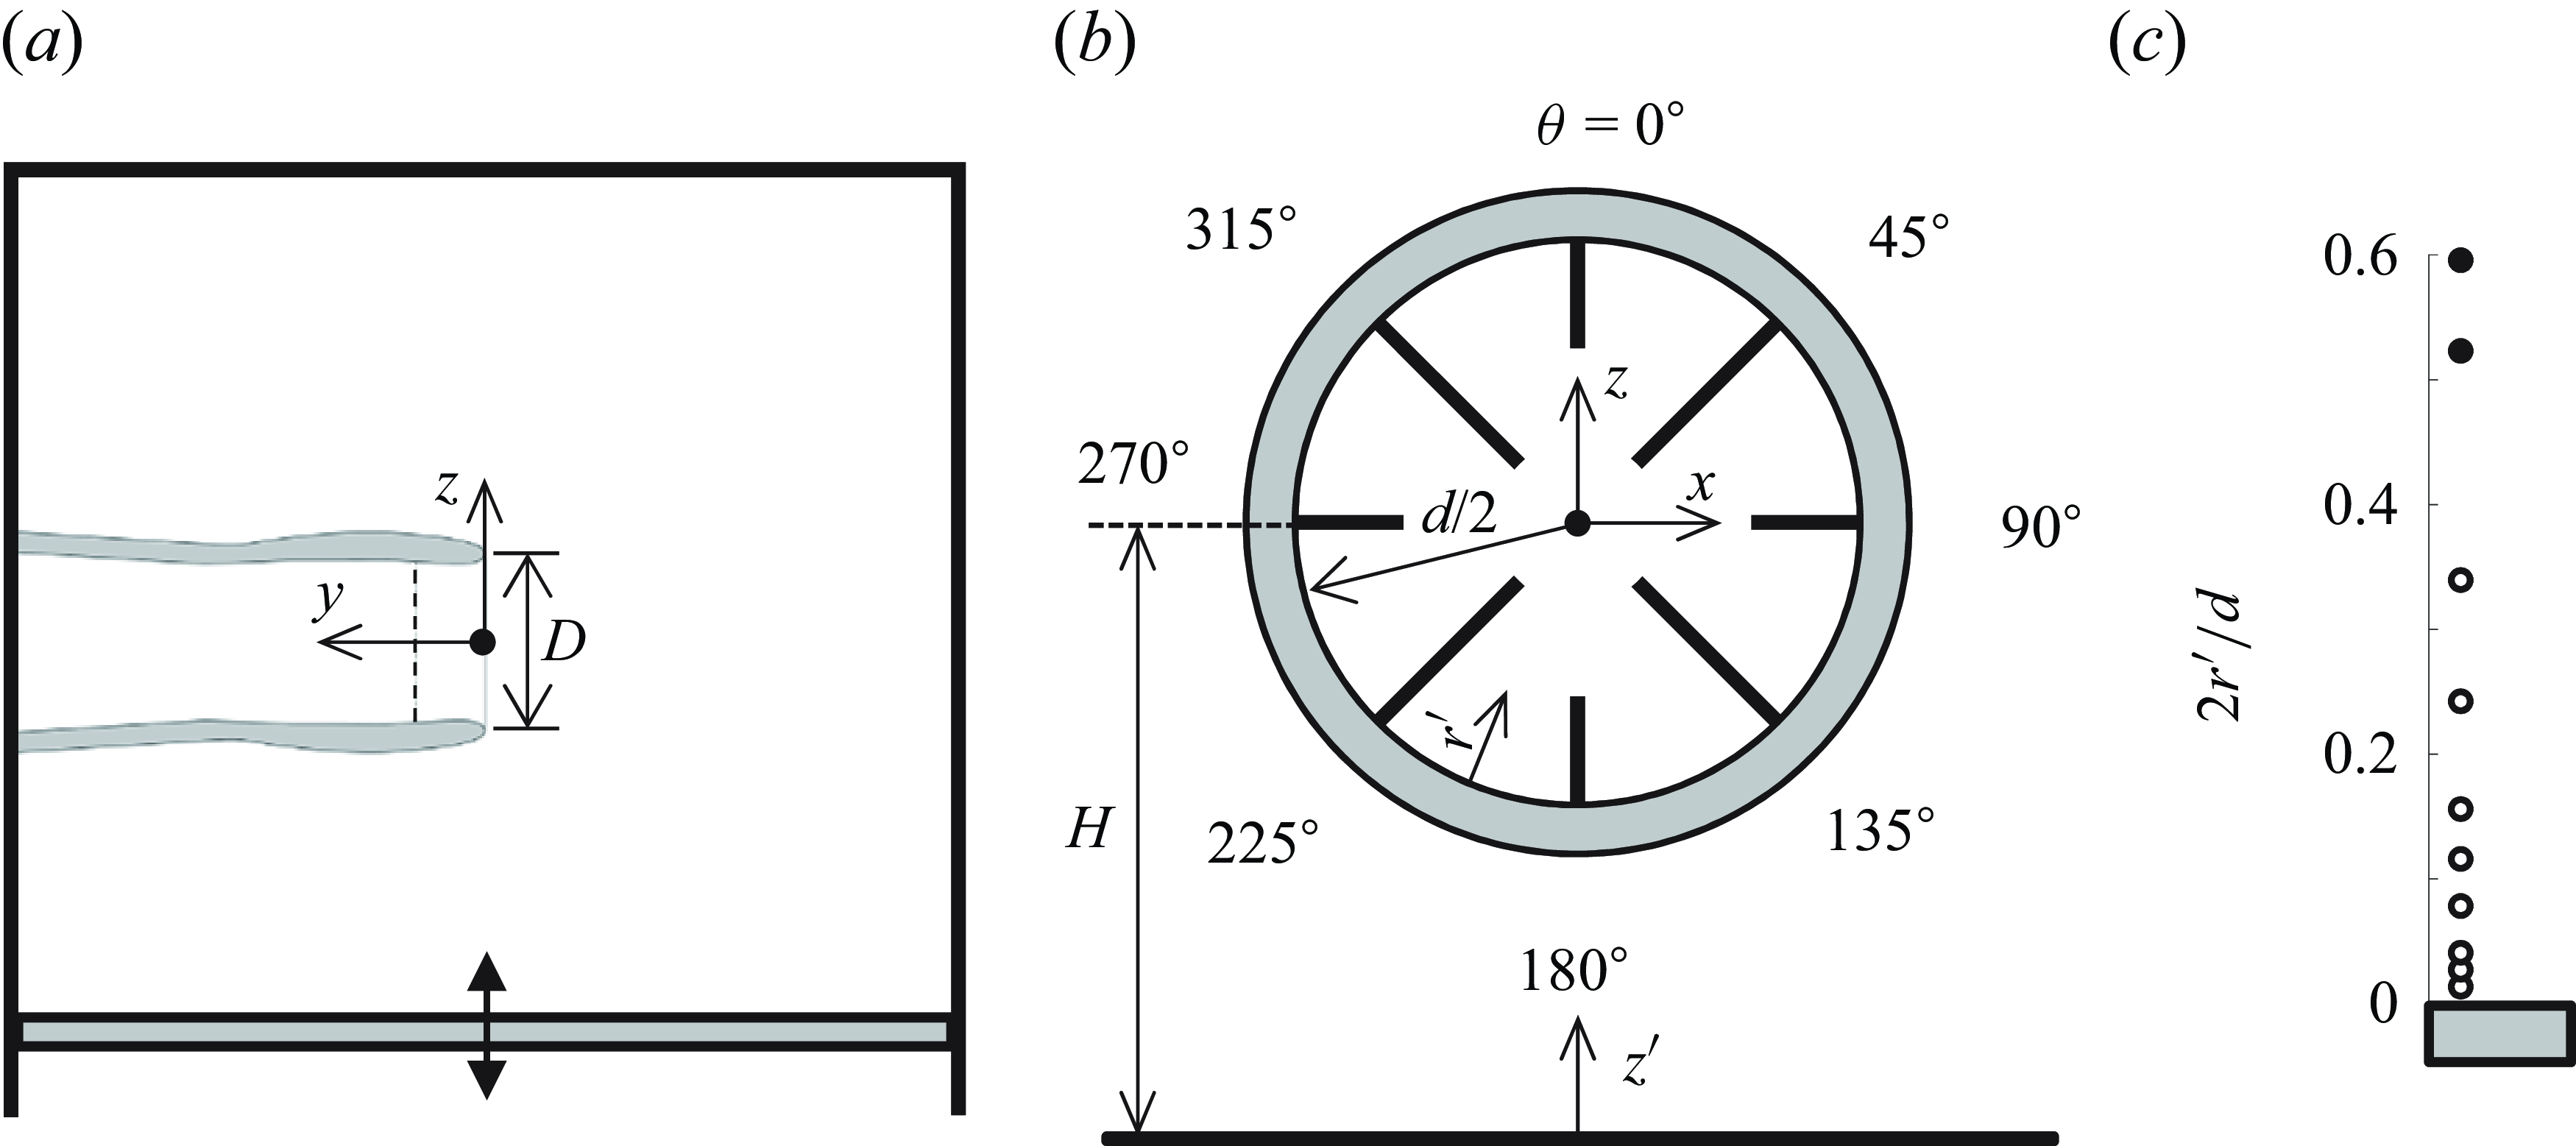
The axial flow through the inlet plane into the duct is characterised by measurements of total pressure distributions in a reference plane within the duct at y/D = 0.4 along the centreline relative to the inlet plane by an internal cluster of eight radial rakes of total pressure tubes (figures 2
b and 2
c) that are spaced at equal azimuthal increments Δθ = 45° apart (θ is the azimuthal angle measured clockwise from the top of the inlet’s surface, as shown in figure 2
b). Rakes of 8 and 10 total pressure probes are placed alternately at even and odd multiples of Δθ. As shown in figure 2(c), the radial spacings of the probes increase with their elevation relative to the surface. Corresponding static pressure ports are arranged about the perimeter of the duct offset from the total pressure rakes by 5°. The total and static pressure distributions are sampled using a pressure scanner (measurement uncertainty is less than 1 % of the time-averaged ensemble). These measurements yield the inlet’s operating Mach number averaged over the area that in the present investigations was varied up to M = 0.72. As discussed in § 3, the total pressure measurements are also used to characterise the momentum flux $\dot{P}$
through the reference plane, the calculation of which utilises the mass flow rate through the inlet that is monitored using measurements within the round duct segment upstream of the blower.
$\dot{P}$
through the reference plane, the calculation of which utilises the mass flow rate through the inlet that is monitored using measurements within the round duct segment upstream of the blower.
Schematic views of the PIV set-up showing the horizontal (a) and vertical (b) laser sheet illumination. Corresponding visualisations of the flow field in the presence of a ground vortex in the horizontal (c) and vertical (d) planes are shown for reference. The core of the vortex is marked by condensed vapour.
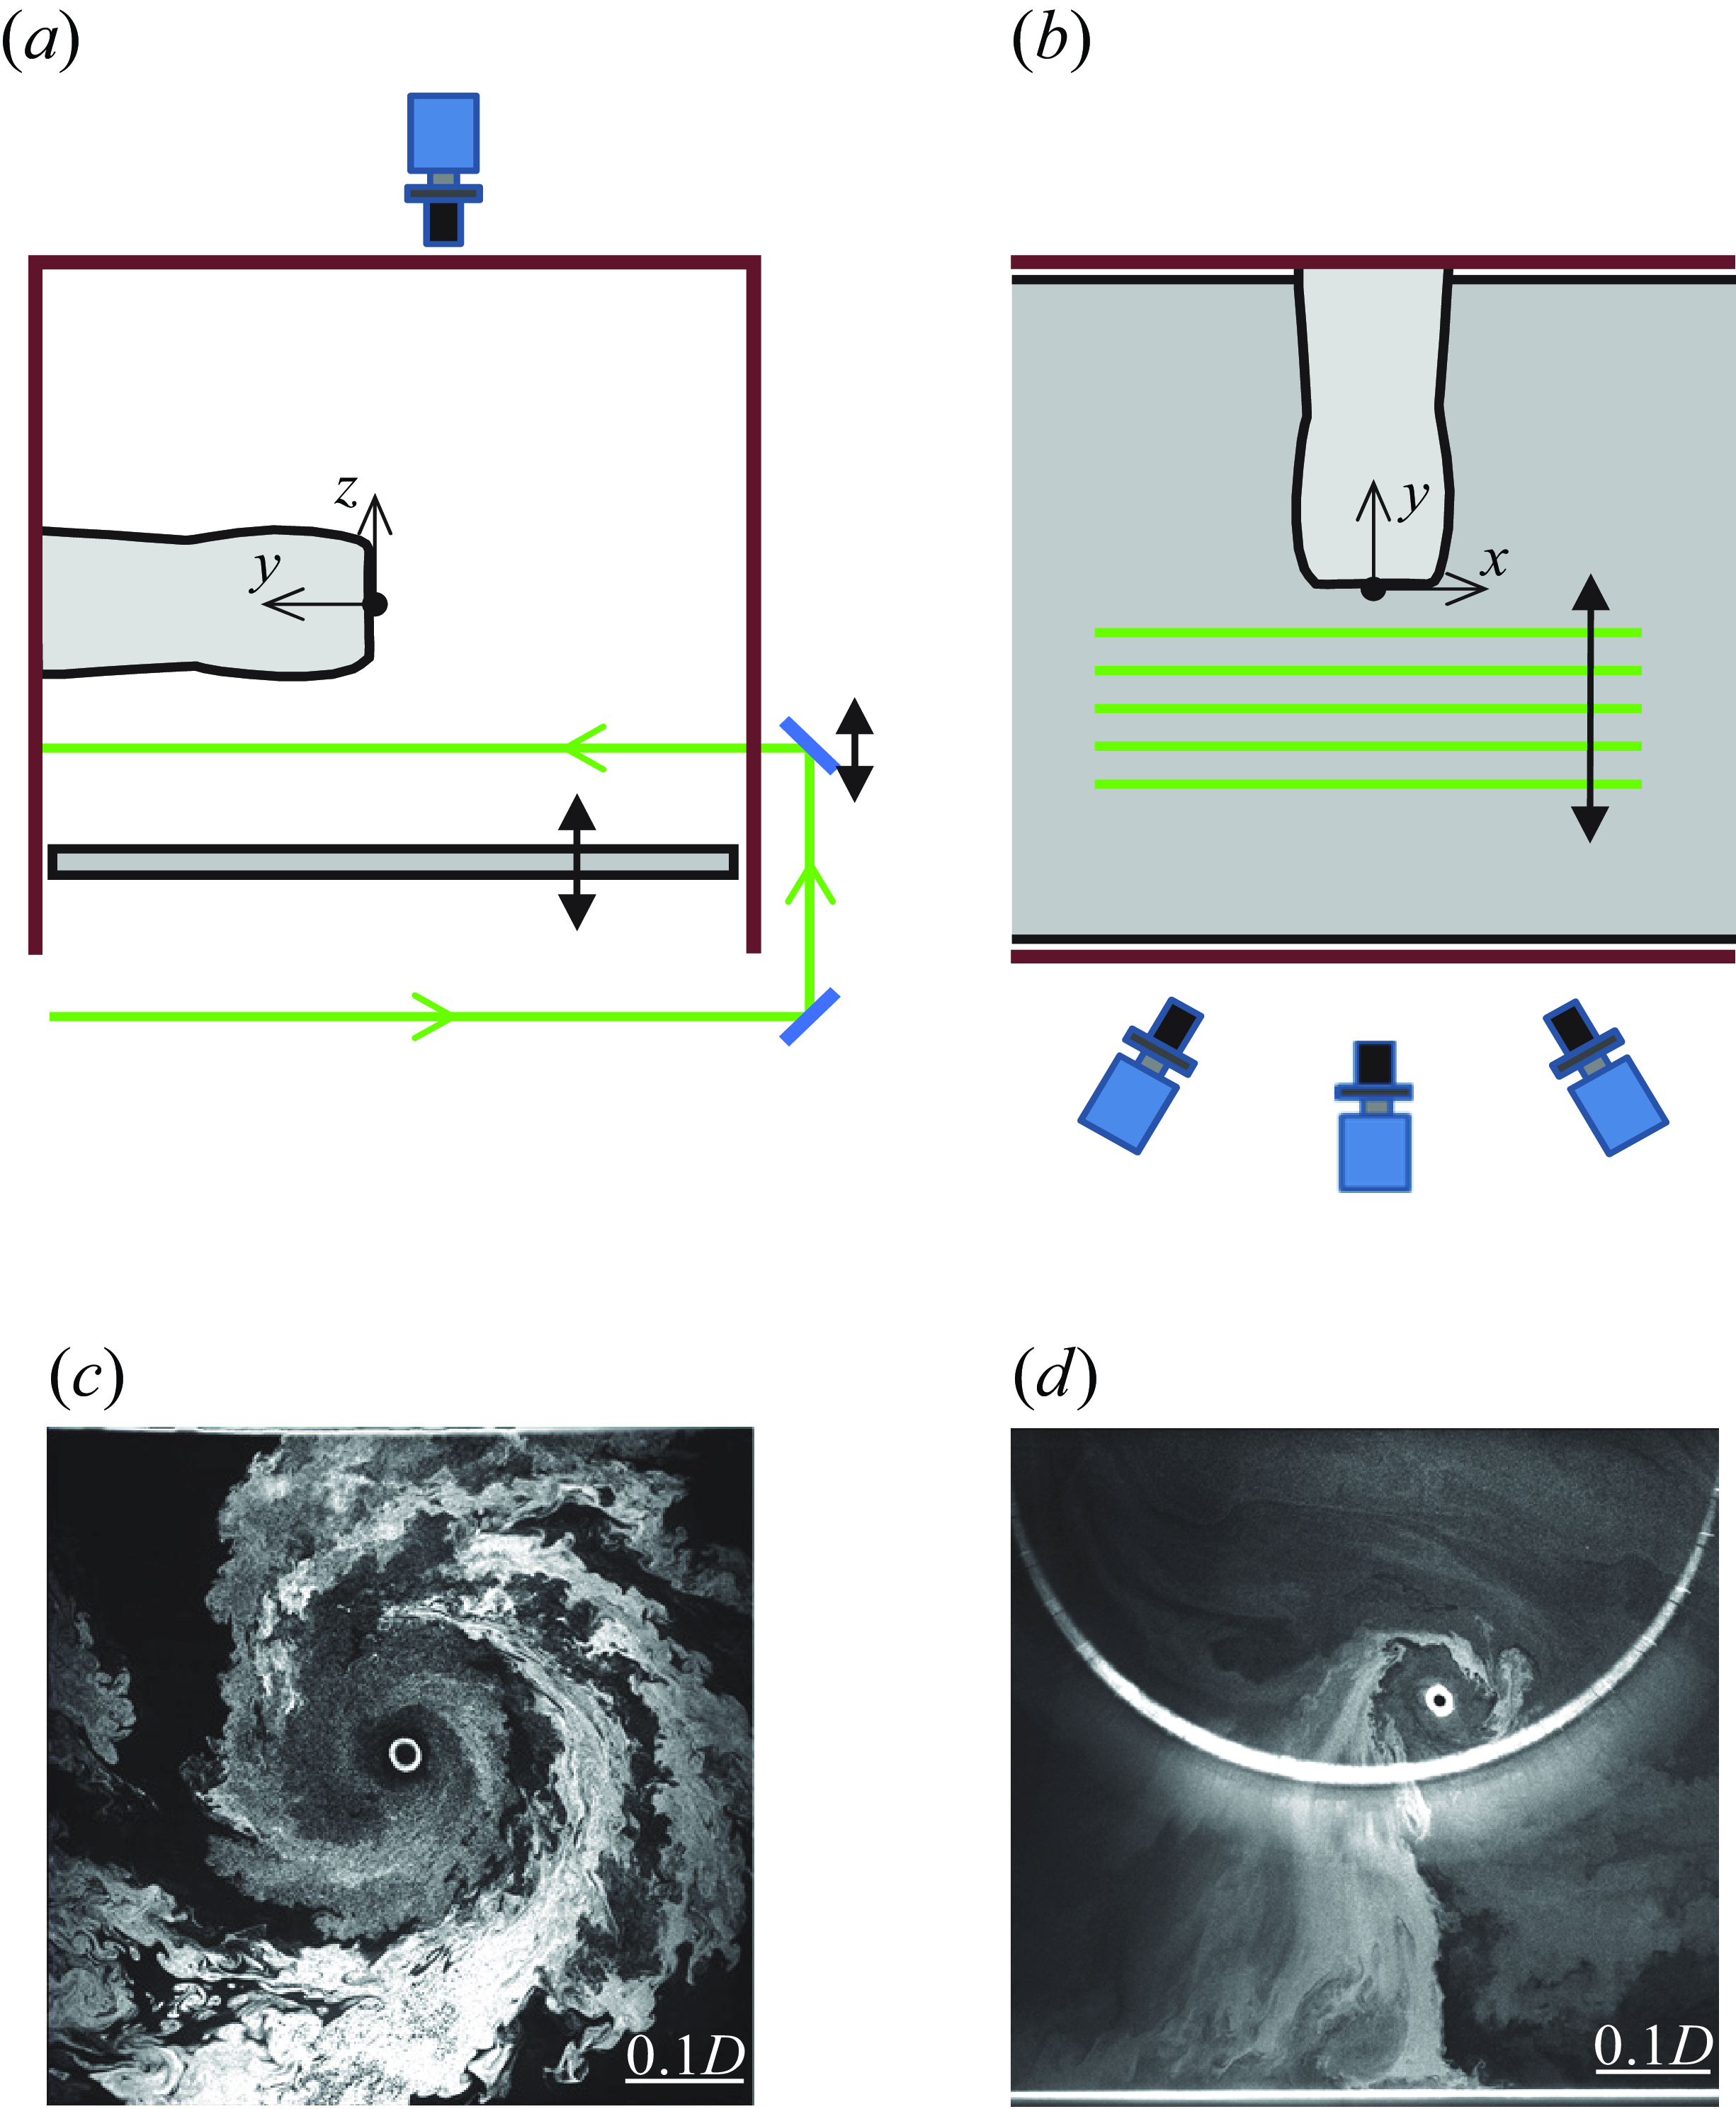
The flow fields in planes parallel to the ground plane, and parallel to the inlet plane as illustrated schematically in streamwise and top views in figures 3(a) and 3(b), respectively, were measured using planar and stereo particle image velocimetry (PIV). The horizontal (x–y) planes (figure 3 a) were used to capture details of the formation of the ground vortex above the ground plane, while the vertical (x–z) PIV planes (figure 3 b) capture the vortex motion within the inlet plane and between the inlet surface and the ground plane. The PIV (stereo and planar) data were acquired at 500 frames per second with magnification ranging from 0.126 to 0.235 mm pixel–1. Measurements in the x–y planes (planar PIV) were acquired at z′/D = 0.065 and 0.13, on a square two-dimensional (2-D) grid with 1.0 mm × 1.0 mm (0.005D) spacings, and in the x–z planes y/D = −0.03 (planar PIV) within –0.78 ≤ y/D ≤ –0.03 (stereo PIV), on a 3-D cubic grid with 3.3 mm (0.017D) spacings. The high-speed PIV cameras and laser sheet optics were placed on computer-controlled traverse mechanisms. Sectional images of a ground vortex visualised using high concentration of theatrical fog and captured within the x–y plane z′/D = 0.26D and x–z plane y/D = −0.03 are shown for reference in figures 3(c) and 3(d), respectively (the scale is marked in each image). In addition to fog visualisation, the centre of the core of the vortex was marked by a ring of condensed water particles as a result of the low pressure within the vortex core. In these images the cross-flow is from left to right and the sense of the vortex rotation referred to as clockwise, axially down the inlet (figure 3 d). It should be noted, however, that in the top-down view in figure 3(c), the sense of rotation of the same vortex moving along the surface appears as counterclockwise.
Colour raster plots of the time-averaged streamwise velocity component superposed with equal-length velocity vectors in the inlet plane at H = 0.183 m, U
o
= 5 m s–1 and $\dot{{P}}$
= 0 (a), 24 (b), 39 (c), 98 (d), 237 (e), and 352 N (f) (corresponding to (cf. § 3)
$\dot{{P}}$
= 0 (a), 24 (b), 39 (c), 98 (d), 237 (e), and 352 N (f) (corresponding to (cf. § 3) $\dot{{P}}^{{*}}=\dot{{P}}/\rho {U}_{{o}}^{2}{D}^{2}$
= 0 (a), 20 (b), 35 (c), 81 (d), 197 (e), 309 (f)). The critical saddle (solid symbols) and node (open symbols) points in the
$\dot{{P}}^{{*}}=\dot{{P}}/\rho {U}_{{o}}^{2}{D}^{2}$
= 0 (a), 20 (b), 35 (c), 81 (d), 197 (e), 309 (f)). The critical saddle (solid symbols) and node (open symbols) points in the ![]() and
and ![]() of a ground vortex are marked for reference along with the inlet contour and surface.
of a ground vortex are marked for reference along with the inlet contour and surface.

3. Ground vortex initiation and scaling
As discussed by Liu et al. (Reference Liu, Greitzer and Tan1985) and Shin et al. (Reference Shin, Greitzer, Cheng, Tan and Shippee1986), the formation of the ground vortex within the suction flow into a cylindrical inlet of diameter D that is normal to a uniform, steady flow over a ground plane can be characterised by three primary parameters, namely the speed of the cross-flow U o , the elevation of the inlet’s centreline above the ground plane H and the characteristic speed of the suction flow V. The present discussion of the scaling of the threshold for ground vortex formation commences with the exploration of the flow field about the inlet prior to and following the appearance of a ground vortex. As will be shown below, the integral measure that is used to characterise the inlet flow is taken to be the momentum flux, instead of the speed of the suction flow, measured in the reference plane y/D = 0.40 along the duct’s centreline relative to the inlet plane.
The flow field in the vicinity of the inlet is investigated over a range of inlet momentum flux 0 < $\dot{P}$
< 352 N for fixed H = 0.94D (H = 0.183 m) and U
o
= 5 m s–1 (9.7 knots). The changes in the flow topology in the inlet plane y/D = –0.03 as the suction flow intensifies are depicted in figure 4 using colour raster plots of the time-averaged streamwise velocity in the inlet plane. The colour raster map is superposed with fixed-length velocity vectors to accentuate features of the flow field surrounding the inlet that would otherwise be dominated by the magnitude of the suction flow. In the absence of suction (figure 4
a), the flow exhibits a near wake on the leeward side with some evident asymmetry and distinct downwash ostensibly owing to the end effects and presence of the ground plane. The streamwise symmetry about the x axis (through the centre of the inlet) is significantly improved when low-level suction is introduced (figure 4
b). The suction into the inlet exhibits clear asymmetry about the z axis and a local node and saddle points appear within (x/D = 0.27, z/D = 0.03) and downstream (x/D = 0.62, z/D = –0.05) of the inlet (along the direction of the cross-flow) and are marked in figure 4(b) using open and closed symbols, respectively. The flow towards the node is marked by azimuthal sectors of streamwise velocity of opposite sense around the perimeter of the inlet that are indicative of the suction from segments of the inlet that are upstream and downstream along the direction of the cross-flow (reaching a magnitude of nearly 5U
o
on the windward side) and as shown in figure 4(b), downstream of the saddle, the effects of the suction subside.
$\dot{P}$
< 352 N for fixed H = 0.94D (H = 0.183 m) and U
o
= 5 m s–1 (9.7 knots). The changes in the flow topology in the inlet plane y/D = –0.03 as the suction flow intensifies are depicted in figure 4 using colour raster plots of the time-averaged streamwise velocity in the inlet plane. The colour raster map is superposed with fixed-length velocity vectors to accentuate features of the flow field surrounding the inlet that would otherwise be dominated by the magnitude of the suction flow. In the absence of suction (figure 4
a), the flow exhibits a near wake on the leeward side with some evident asymmetry and distinct downwash ostensibly owing to the end effects and presence of the ground plane. The streamwise symmetry about the x axis (through the centre of the inlet) is significantly improved when low-level suction is introduced (figure 4
b). The suction into the inlet exhibits clear asymmetry about the z axis and a local node and saddle points appear within (x/D = 0.27, z/D = 0.03) and downstream (x/D = 0.62, z/D = –0.05) of the inlet (along the direction of the cross-flow) and are marked in figure 4(b) using open and closed symbols, respectively. The flow towards the node is marked by azimuthal sectors of streamwise velocity of opposite sense around the perimeter of the inlet that are indicative of the suction from segments of the inlet that are upstream and downstream along the direction of the cross-flow (reaching a magnitude of nearly 5U
o
on the windward side) and as shown in figure 4(b), downstream of the saddle, the effects of the suction subside.
As the inlet momentum flux is increased, the symmetry of the flow about the x axis vanishes even before the formation of the ground vortex, and the wake saddle point migrates towards the ground plane from (x/D, z/D) = (0.62, –0.05) ( $\dot{P}$
= 24 N) to (0.71, –0.29) (
$\dot{P}$
= 24 N) to (0.71, –0.29) ( $\dot{P}$
= 39 N), as the increase in upstream suction along the bottom side of the leeward edge is limited by the proximity of the ground plane and is supplanted by downward flow along the upper side of the leeward edge. These changes are accompanied by reversed (upstream) flow along the ground plane that is bounded by two additional saddle points that bound a countercurrent flow domain with upward flow above it. When
$\dot{P}$
= 39 N), as the increase in upstream suction along the bottom side of the leeward edge is limited by the proximity of the ground plane and is supplanted by downward flow along the upper side of the leeward edge. These changes are accompanied by reversed (upstream) flow along the ground plane that is bounded by two additional saddle points that bound a countercurrent flow domain with upward flow above it. When $\dot{P}$
= 98 N (figure 4
d), a stable clockwise ground vortex is formed within the inlet and is characterised by the induced reversed streamwise flow near the bottom edge of the inlet about (x/D, z/D) = (0.08, –0.38). This flow is also accompanied by the intensification of the reversed flow domain along the ground plane underneath the inlet (towards its centreline) between the two wall saddle points. Finally, when
$\dot{P}$
= 98 N (figure 4
d), a stable clockwise ground vortex is formed within the inlet and is characterised by the induced reversed streamwise flow near the bottom edge of the inlet about (x/D, z/D) = (0.08, –0.38). This flow is also accompanied by the intensification of the reversed flow domain along the ground plane underneath the inlet (towards its centreline) between the two wall saddle points. Finally, when $\dot{P}$
is increased to 237 N (figure 4
e), the reversed flow domain on the leeward side of the inlet extends to the rightmost end of the field of view and the wake saddle point apparently migrates out of the field of view in the y direction, as also depicted in figure 4(f), with further increase in the inlet momentum flux, as the flow field surrounding the inlet approaches a flow condition appearing symmetric from left to right (figure 4
f).
$\dot{P}$
is increased to 237 N (figure 4
e), the reversed flow domain on the leeward side of the inlet extends to the rightmost end of the field of view and the wake saddle point apparently migrates out of the field of view in the y direction, as also depicted in figure 4(f), with further increase in the inlet momentum flux, as the flow field surrounding the inlet approaches a flow condition appearing symmetric from left to right (figure 4
f).
It is noted that, while the data in figure 4 do not reveal the presence of trailing (tip) vortices over the edges of the inlet (cf. De Siervi et al. Reference De Siervi, Viguier, Greitzer and Tan1982), the signature of counter rotating trailing vortices off the upper and lower outer surfaces of the duct were observed in inboard x–z planes (y> 0) at low suction levels (e.g. figures 4 b and 4 c). The formation of these vortices is akin to the tip vortices off a finite low aspect ratio solid cylinder (e.g. Krajnovic Reference Krajnovic2011; Sumner Reference Sumner2013). However, it should be noted that the balance between these vortices on the inlet duct changes in the presence of a ground plane owing to the lift on the cylinder and the presence of suction. Furthermore, it is expected that the strong reversed flow underneath the duct with increased suction, as shown in figure 4(d–f), reduces the shear on the lower outer surface of the inlet duct and thereby weakens the lower trailing vortex and suppresses it completely. Hence, in concert with the earlier studies (e.g. Shin et al. Reference Shin, Greitzer, Cheng, Tan and Shippee1986; Murphy & MacManus Reference Murphy and MacManus2011; Trapp & Girardi Reference Trapp and Girardi2020), it is expected that when the ground vortex is formed at the inlet only the upper trailing vortex (clockwise downstream along the direction of the cross-flow) remains, as previously illustrated by Shin et al. (Reference Shin, Greitzer, Cheng, Tan and Shippee1986). Indeed, the velocity data in the inboard x–y planes following the appearance of the ground vortex showed only one trailing vortex near the inlet tip (not shown here for brevity).
As noted in § 1, the dimensionless parameters that define the threshold conditions necessary for the appearance of a ground vortex within the inlet were identified by Liu et al. (Reference Liu, Greitzer and Tan1985) and Shin et al. (Reference Shin, Greitzer, Cheng, Tan and Shippee1986) as the ratios of the average velocity at the inlet plane V to the cross-wind speed U o and the normalised height of the inlet’s centreline H/D. Assuming that the density is invariant, these authors reported a formation boundary given by V/U o = 17.9H/D – 9.5 such that, for a given H/D, a ground vortex was observed at the inlet when V/U o >17.9H/D – 9.5. Nakayama & Jones (Reference Nakayama and Jones1996) extended this formation boundary by including data for small H/D and high inlet Mach numbers attaining an adjusted fit given by V/U o = 24H/D – 17.
In the present investigations, the appearance of a ground vortex within the inlet (cf. figure 3
d) is detected by radial measurements of the total pressure above the inlet’s inner surface using azimuthal rakes of total pressure probes (cf. figure 2
b). Figure 5(a) shows a typical radial distribution of the normalised total pressure distribution $p_{{o}}^{\prime}$
= (p
o
–p
a
)/p
a
(p
o
and p
a
are the total and atmospheric pressures) in the absence and presence of a ground vortex measured above the bottom surface of the inlet at θ = 180° for
$p_{{o}}^{\prime}$
= (p
o
–p
a
)/p
a
(p
o
and p
a
are the total and atmospheric pressures) in the absence and presence of a ground vortex measured above the bottom surface of the inlet at θ = 180° for $\dot{P}$
= 128 N, U
o
= 15.4 m s–1 and at two different inlet elevations H = 0.183 and 0.401 m. In the absence of the vortex, the total pressure distribution exhibits typical losses within the surface boundary layer (nominally r′
/R
r
< 0.04), that diminish within the inlet’s core flow. However, the presence of the vortex is marked by significant diminution in the total pressure as a result of the typical reduction in static pressure within the core of the vortex. Furthermore, the effects of the azimuthal velocity around the core of the vortex are manifested by additional off-surface local extrema (r′
/R
r
= 0.12 and 0.16) of the total pressure as a result of changes in the dynamic pressure that are asymmetric relative to the centre of its core because of the proximity of the inlet’s surface (the pressure distribution in figure 5(a) suggests that the centre of the vortex core is located near r′
/R
r
= 0.16).
$\dot{P}$
= 128 N, U
o
= 15.4 m s–1 and at two different inlet elevations H = 0.183 and 0.401 m. In the absence of the vortex, the total pressure distribution exhibits typical losses within the surface boundary layer (nominally r′
/R
r
< 0.04), that diminish within the inlet’s core flow. However, the presence of the vortex is marked by significant diminution in the total pressure as a result of the typical reduction in static pressure within the core of the vortex. Furthermore, the effects of the azimuthal velocity around the core of the vortex are manifested by additional off-surface local extrema (r′
/R
r
= 0.12 and 0.16) of the total pressure as a result of changes in the dynamic pressure that are asymmetric relative to the centre of its core because of the proximity of the inlet’s surface (the pressure distribution in figure 5(a) suggests that the centre of the vortex core is located near r′
/R
r
= 0.16).
(a) Sample total pressure distribution at θ = 180° in the absence (•) and presence (![]() ) of a ground vortex, and (b) corresponding colour raster plot of the total pressure including labelled vortex detection sectors S1–S8.
) of a ground vortex, and (b) corresponding colour raster plot of the total pressure including labelled vortex detection sectors S1–S8.
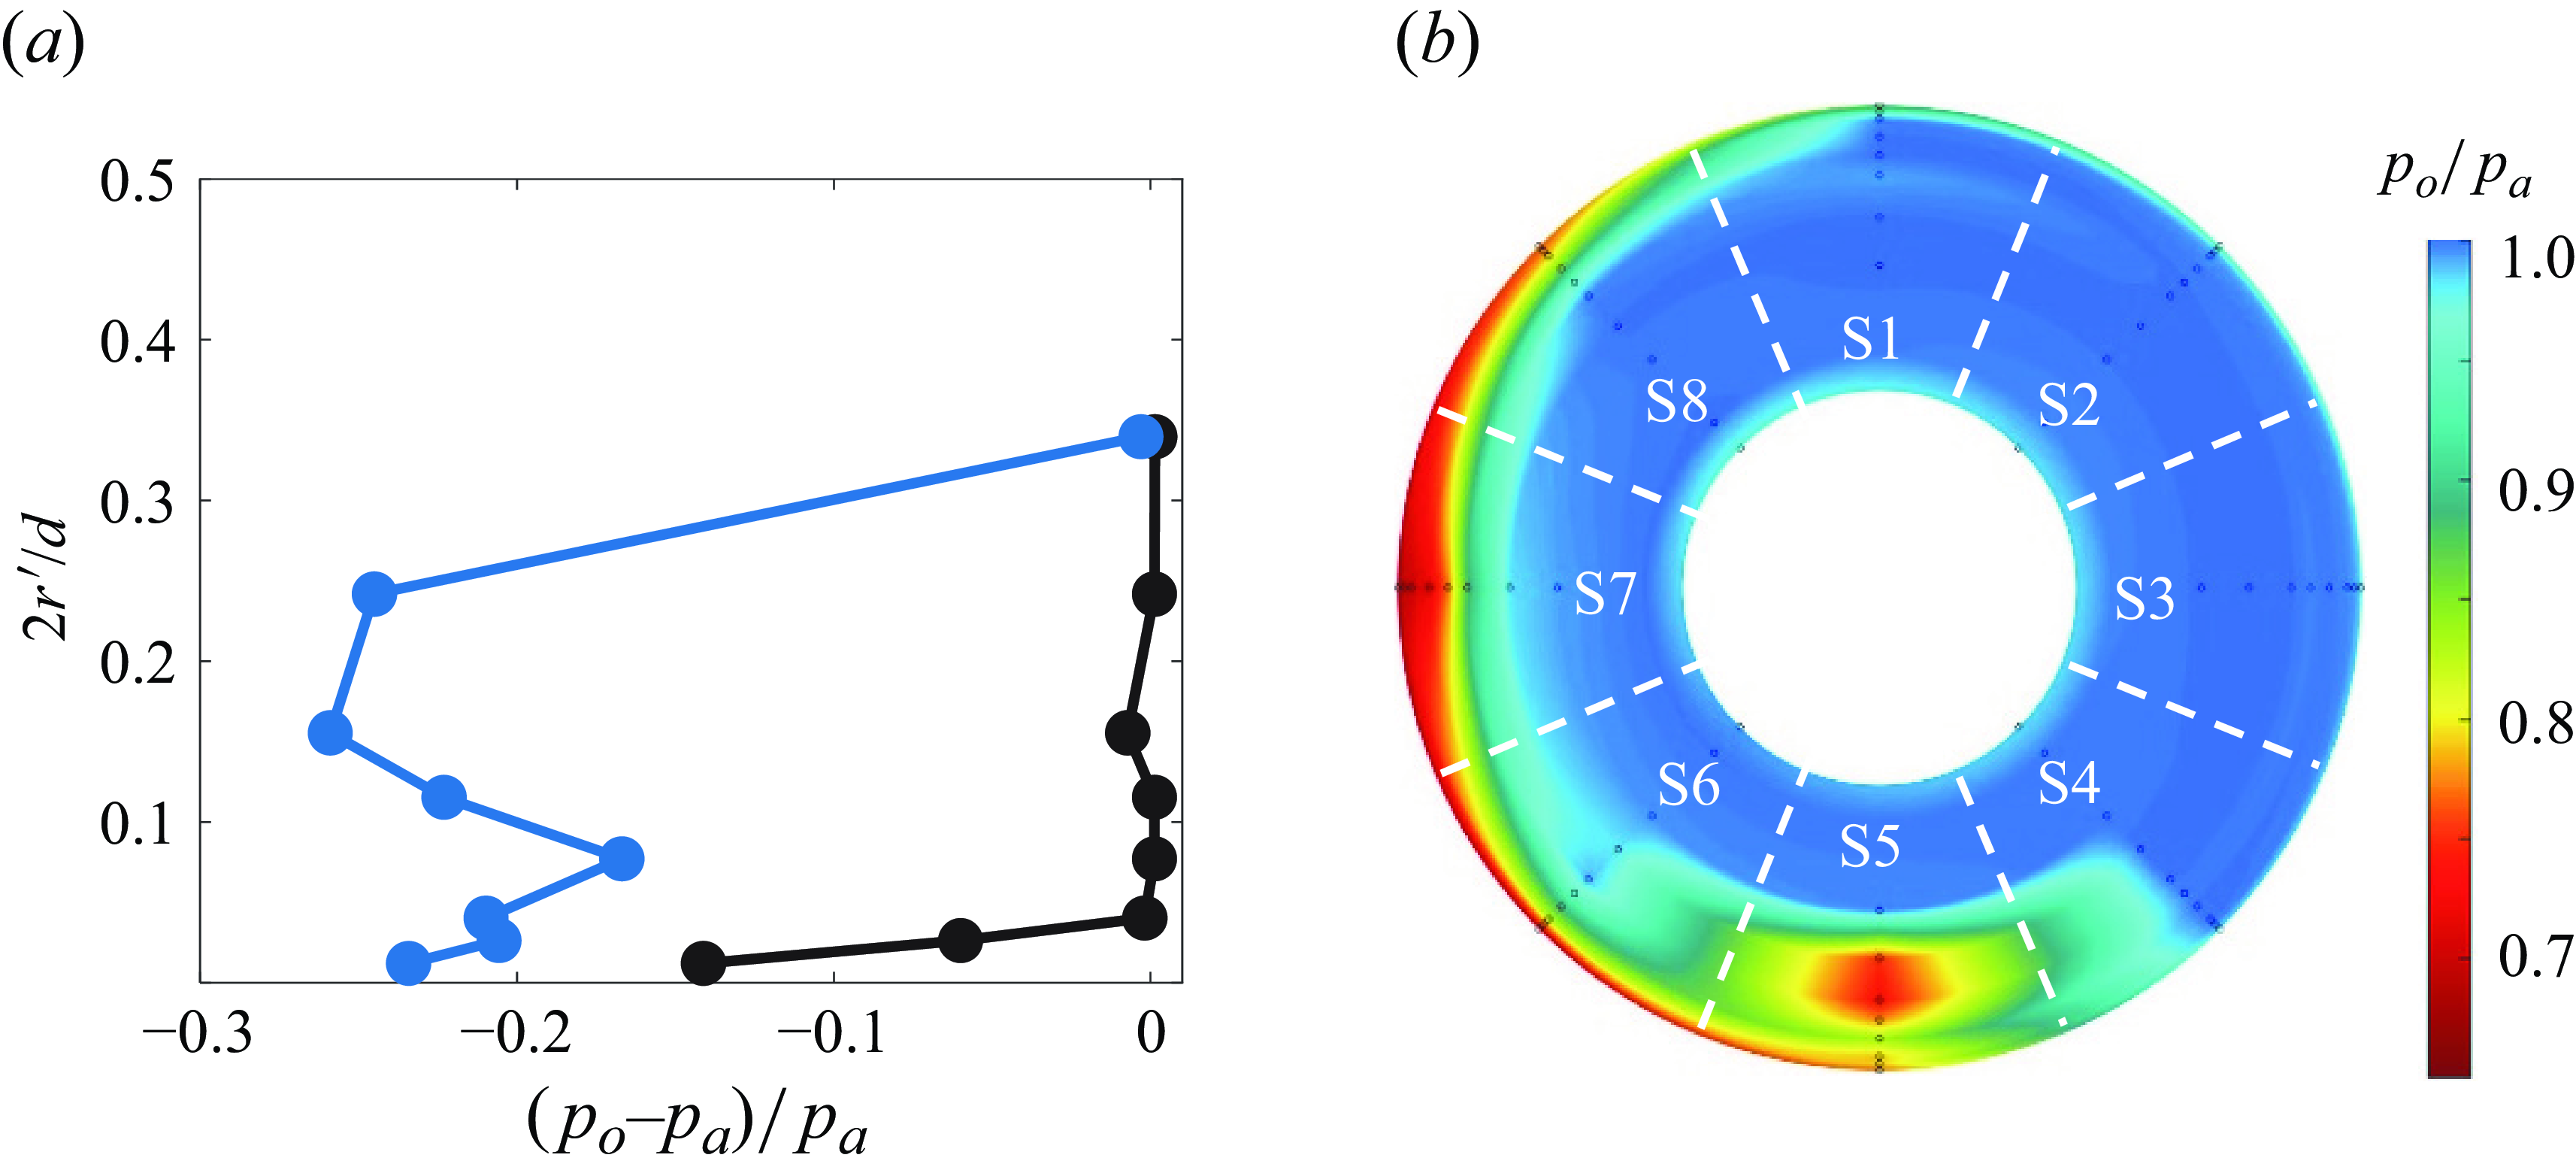
The radial total pressure distributions measured by the pressure rakes were used to detect the presence of a vortex within the inlet and map its approximate position within the inlet by searching for the pressure minima within its core for a range of the three primary operating parameters, namely, the inlet’s momentum flux $\dot{P}$
, the cross-flow speed U
o
and the inlet’s elevation above the ground plane H (in the present investigations the inlet’s inner diameter D was invariant). In this analysis, the inlet’s cross-section at the location of the total pressure probes was divided into eight azimuthal sectors (S1–S8) each spanning 45° and centred about one of the rakes, as shown schematically in figure 5(b). When a vortex was detected (by the local off-surface minima of the total pressure), it was assigned to a given sector by considering the weighted simultaneous pressure distributions of adjacent radial rakes. High-speed videos indicated that, for given operating conditions, the characteristic azimuthal oscillations of a ground vortex within the inlet was within ±6° at approximately 1–2 Hz, so the pressure distributions were sampled at 2 Hz). Figure 5(b) shows a colour raster plot of the time-averaged simultaneous distributions of total pressure that are captured by the azimuthal rakes within the inlet’s sectional plane y = 0.40D corresponding to the vortex case in figure 5(a) and shows the characteristic total pressure deficit within the core of the time-averaged vortex whose structural details (168° < θ< 192°) are clearly limited by the azimuthal spacings of the pressure rakes. The additional domain of low total pressure on the windward side of the inlet’s inner surface (180° < θ< 330°) is attributed to local flow separation along the inner surface of the inlet that is caused by interaction between the suction and cross-flow, as discussed by Nichols et al. (Reference Nichols, Vukasinovic, Glezer and Rafferty2024).
$\dot{P}$
, the cross-flow speed U
o
and the inlet’s elevation above the ground plane H (in the present investigations the inlet’s inner diameter D was invariant). In this analysis, the inlet’s cross-section at the location of the total pressure probes was divided into eight azimuthal sectors (S1–S8) each spanning 45° and centred about one of the rakes, as shown schematically in figure 5(b). When a vortex was detected (by the local off-surface minima of the total pressure), it was assigned to a given sector by considering the weighted simultaneous pressure distributions of adjacent radial rakes. High-speed videos indicated that, for given operating conditions, the characteristic azimuthal oscillations of a ground vortex within the inlet was within ±6° at approximately 1–2 Hz, so the pressure distributions were sampled at 2 Hz). Figure 5(b) shows a colour raster plot of the time-averaged simultaneous distributions of total pressure that are captured by the azimuthal rakes within the inlet’s sectional plane y = 0.40D corresponding to the vortex case in figure 5(a) and shows the characteristic total pressure deficit within the core of the time-averaged vortex whose structural details (168° < θ< 192°) are clearly limited by the azimuthal spacings of the pressure rakes. The additional domain of low total pressure on the windward side of the inlet’s inner surface (180° < θ< 330°) is attributed to local flow separation along the inner surface of the inlet that is caused by interaction between the suction and cross-flow, as discussed by Nichols et al. (Reference Nichols, Vukasinovic, Glezer and Rafferty2024).
To determine the threshold conditions for the appearance of a vortex within the inlet, the inlet momentum flux was gradually increased at a fixed cross-wind speed and a given inlet elevation until an unstable ground vortex was intermittently detected in the total pressure measurements. One such intermittent realisation is shown in figure 6(a), where each distribution is an instantaneous measurement of the total pressure at θ = 135° acquired at 2 Hz and compared with the time-averaged measurement where each measurement is the average of 64 samples. Before the vortex forms (circles), the profile resembles the mean; however, the next realisation (diamonds) changes significantly as the vortex forms and is ingested, which is detected by the rake in that location based on the off-surface minima as discussed in connection with figure 5(a). Subsequent realisations (triangles and squares) show a reduction in the losses which relax back to the time-averaged levels. It is important to note that, due to its intermittent nature, the signature of this vortex (figure 6 a) is much weaker than that of the fully formed vortex in figure 5(a). In addition, the lower pressure signature of this vortex may be attributed to lower circulation.
(a) Instantaneous total pressure distributions at θ = 135° at H = 0.183 m, U
o
= 15.4 m s–1 and $\dot{{P}}$
= 493 N demonstrating pressure losses, in four successive measurements 0.5 s apart, before (
$\dot{{P}}$
= 493 N demonstrating pressure losses, in four successive measurements 0.5 s apart, before (![]() ), during (
), during (![]() ) and after (
) and after (![]() ,
, ![]() ) an unstable vortex is formed compared with the time-averaged pressure distribution (
) an unstable vortex is formed compared with the time-averaged pressure distribution ( $\circ$
); and (b) the inlet momentum flux at which a vortex first forms at a given elevation H relative to the surface at U
o
= 5.1 (
$\circ$
); and (b) the inlet momentum flux at which a vortex first forms at a given elevation H relative to the surface at U
o
= 5.1 (![]() ), 7.7 (
), 7.7 (![]() ), 10.3 (
), 10.3 (![]() ), 12.9 (
), 12.9 (![]() ), 15.4 (
), 15.4 (![]() ) and 18.0 m s–1 (
) and 18.0 m s–1 (![]() ). The elevations of the tip of the inlet (
). The elevations of the tip of the inlet (![]() ) and outer inlet surfaces (
) and outer inlet surfaces (![]() ) are included for reference.
) are included for reference.
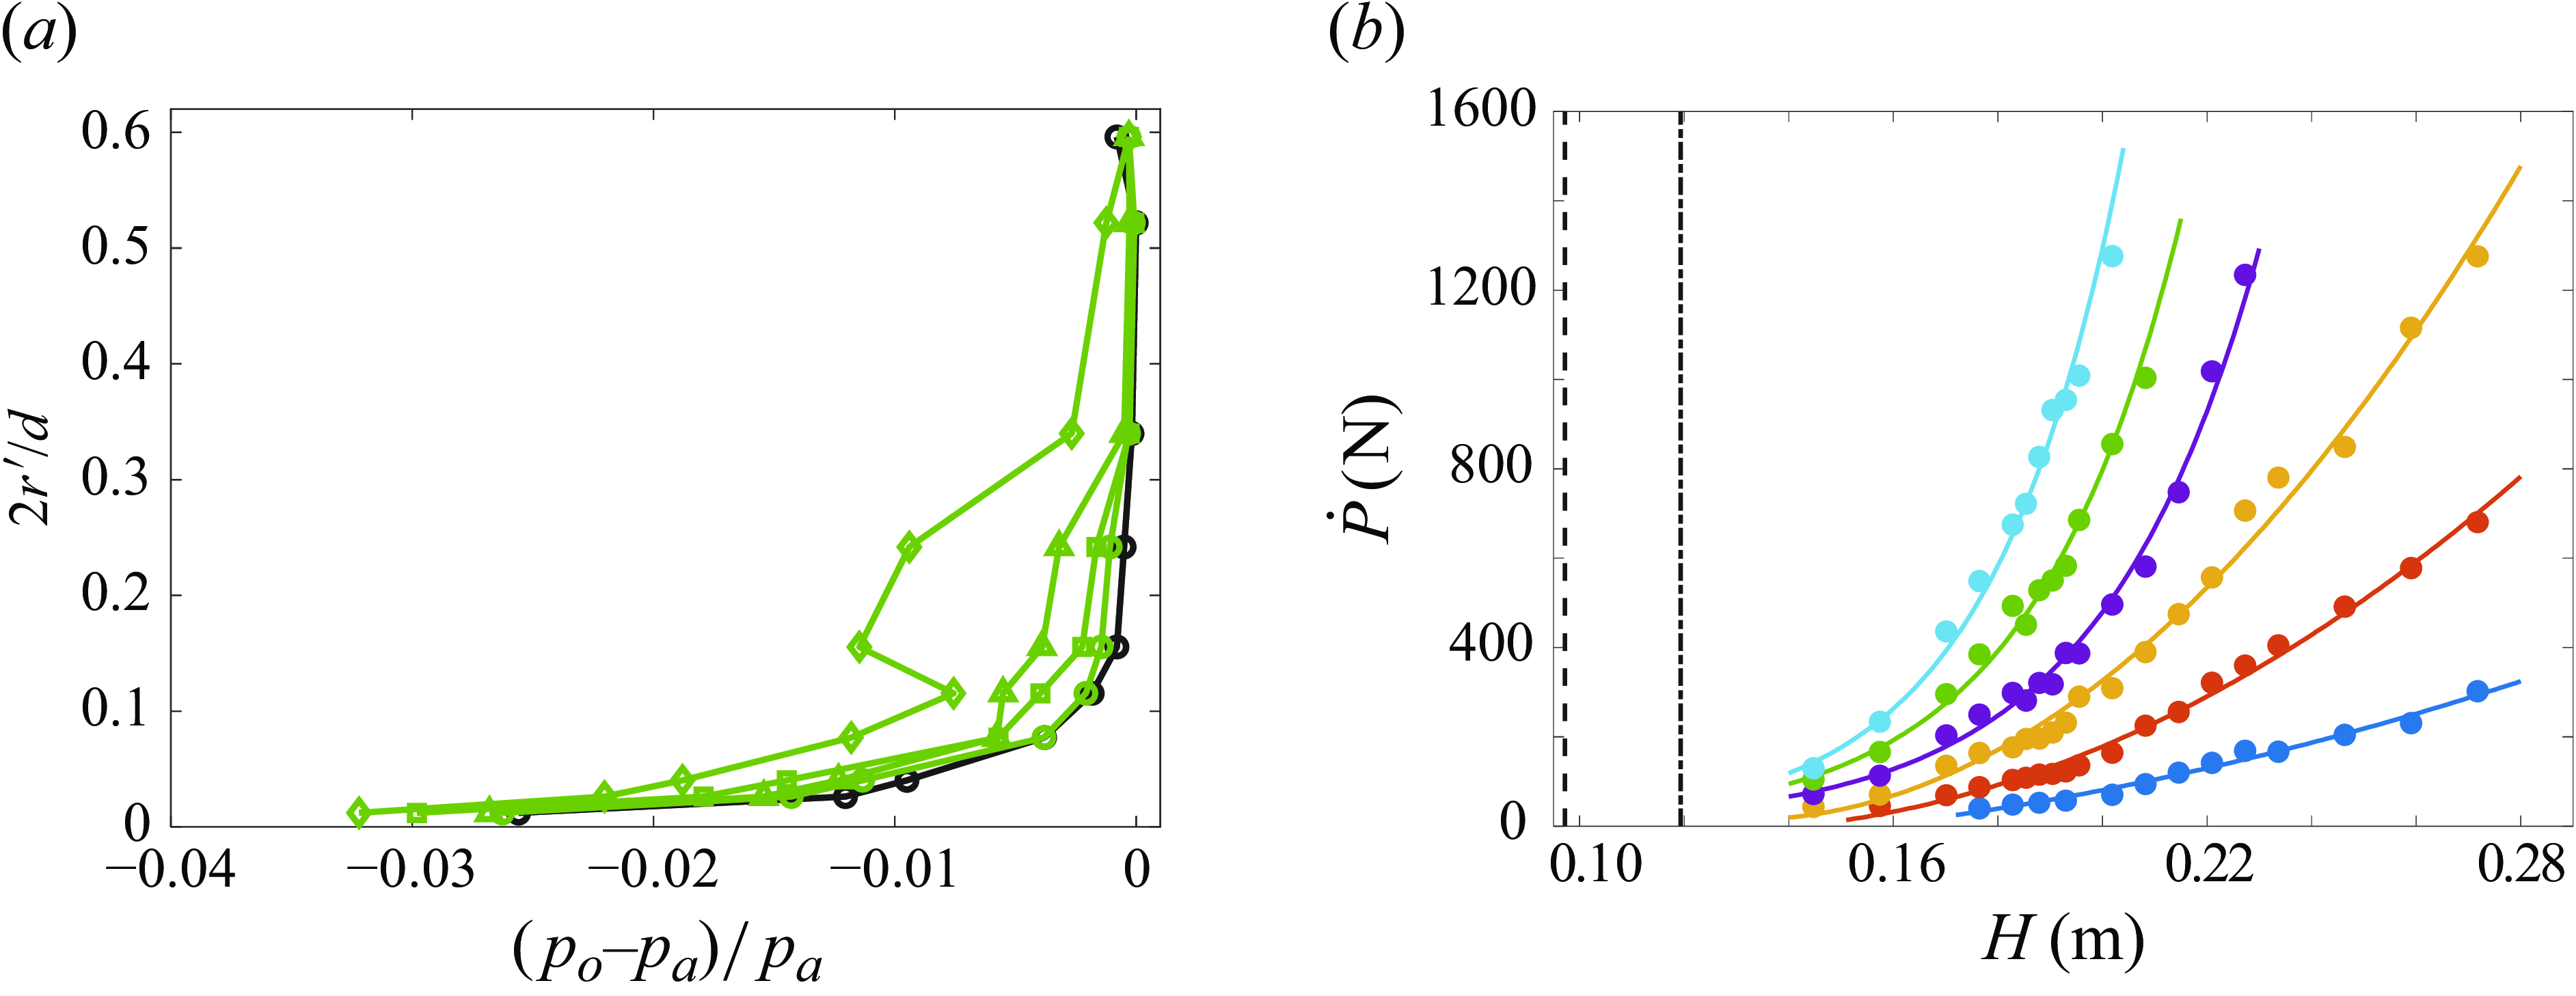
Following this procedure to determine the vortex initiation, a family of (dimensional) formation boundaries is obtained for various cross-wind speeds and inlet elevations, which are shown in figure 6(b). It is noted that vortices that are first detected at these conditions are unstable and can intermittently vanish, as seen in figure 6(a). For each cross-wind speed, $\dot{P}$
was varied for increasing H and, as shown in figure 6(b), the formation curves (with least-squares fit to the data) become steeper indicating (as expected) that, for a given H, the necessary
$\dot{P}$
was varied for increasing H and, as shown in figure 6(b), the formation curves (with least-squares fit to the data) become steeper indicating (as expected) that, for a given H, the necessary $\dot{P}$
required to form a vortex increases with U
o
or that alternatively, for a given U
o
,
$\dot{P}$
required to form a vortex increases with U
o
or that alternatively, for a given U
o
, $\dot{P}$
increases nonlinearly with H. Clearly, the lower limit on H is the inlet’s radius at its face plane (here, R = 0.097 m), although the practical limit depends on the inlet’s outer wall thickness (for the present inlet, H≥ 0.12 m). As a result,
$\dot{P}$
increases nonlinearly with H. Clearly, the lower limit on H is the inlet’s radius at its face plane (here, R = 0.097 m), although the practical limit depends on the inlet’s outer wall thickness (for the present inlet, H≥ 0.12 m). As a result, $\dot{P}$
diminishes to some low, positive, non-zero level as the ground plane approaches the inlet.
$\dot{P}$
diminishes to some low, positive, non-zero level as the ground plane approaches the inlet.
The data in figure 6(b) are replotted in figure 7(a) using the scaled variables V/U o and H* = H/D, as proposed by Shin et al. (Reference Shin, Greitzer, Cheng, Tan and Shippee1986) and Nakayama & Jones (Reference Nakayama and Jones1996) along with each of their linear fits to the current data, while a least-squares linear fit to the present data is also included for comparison. While the linear fits of Shin et al. and Nakayama and Jones exhibit reasonable agreement with the data of figure 6(b), there are some subtle deviations where the data exhibit domains of increasing and decreasing slopes for H* < 1 and H* > 1.2. Overall, the present data tend to agree better with the fit of Shin et al. (Reference Shin, Greitzer, Cheng, Tan and Shippee1986); however, the present data also suggest that a linear fit may not best represent the formation at small and large H* .
(a) The threshold levels at which a ground vortex first appears at the inlet in terms of H
* and V/U
o
, and (b) $\dot{{P}}_{{C}}^{{*}}=\dot{{P}}/{\unicode[Arial]{x03C1}} {U}_{{o}}^{2}{D}^{2}$
at U
o
= 5.1 (
$\dot{{P}}_{{C}}^{{*}}=\dot{{P}}/{\unicode[Arial]{x03C1}} {U}_{{o}}^{2}{D}^{2}$
at U
o
= 5.1 (![]() ), 7.7 (
), 7.7 (![]() ), 10.3 (
), 10.3 (![]() ), 12.9 (
), 12.9 (![]() ), 15.4 (
), 15.4 (![]() ) and 18.0 m s–1 (
) and 18.0 m s–1 (![]() ). The fit to the present data (
). The fit to the present data (![]() ) as well as the fits of Shin et al. (Reference Shin, Greitzer, Cheng, Tan and Shippee1986) (
) as well as the fits of Shin et al. (Reference Shin, Greitzer, Cheng, Tan and Shippee1986) (![]() ) and Nakayama & Jones (Reference Nakayama and Jones1996) (
) and Nakayama & Jones (Reference Nakayama and Jones1996) (![]() ) are shown in (a) for reference.
) are shown in (a) for reference.
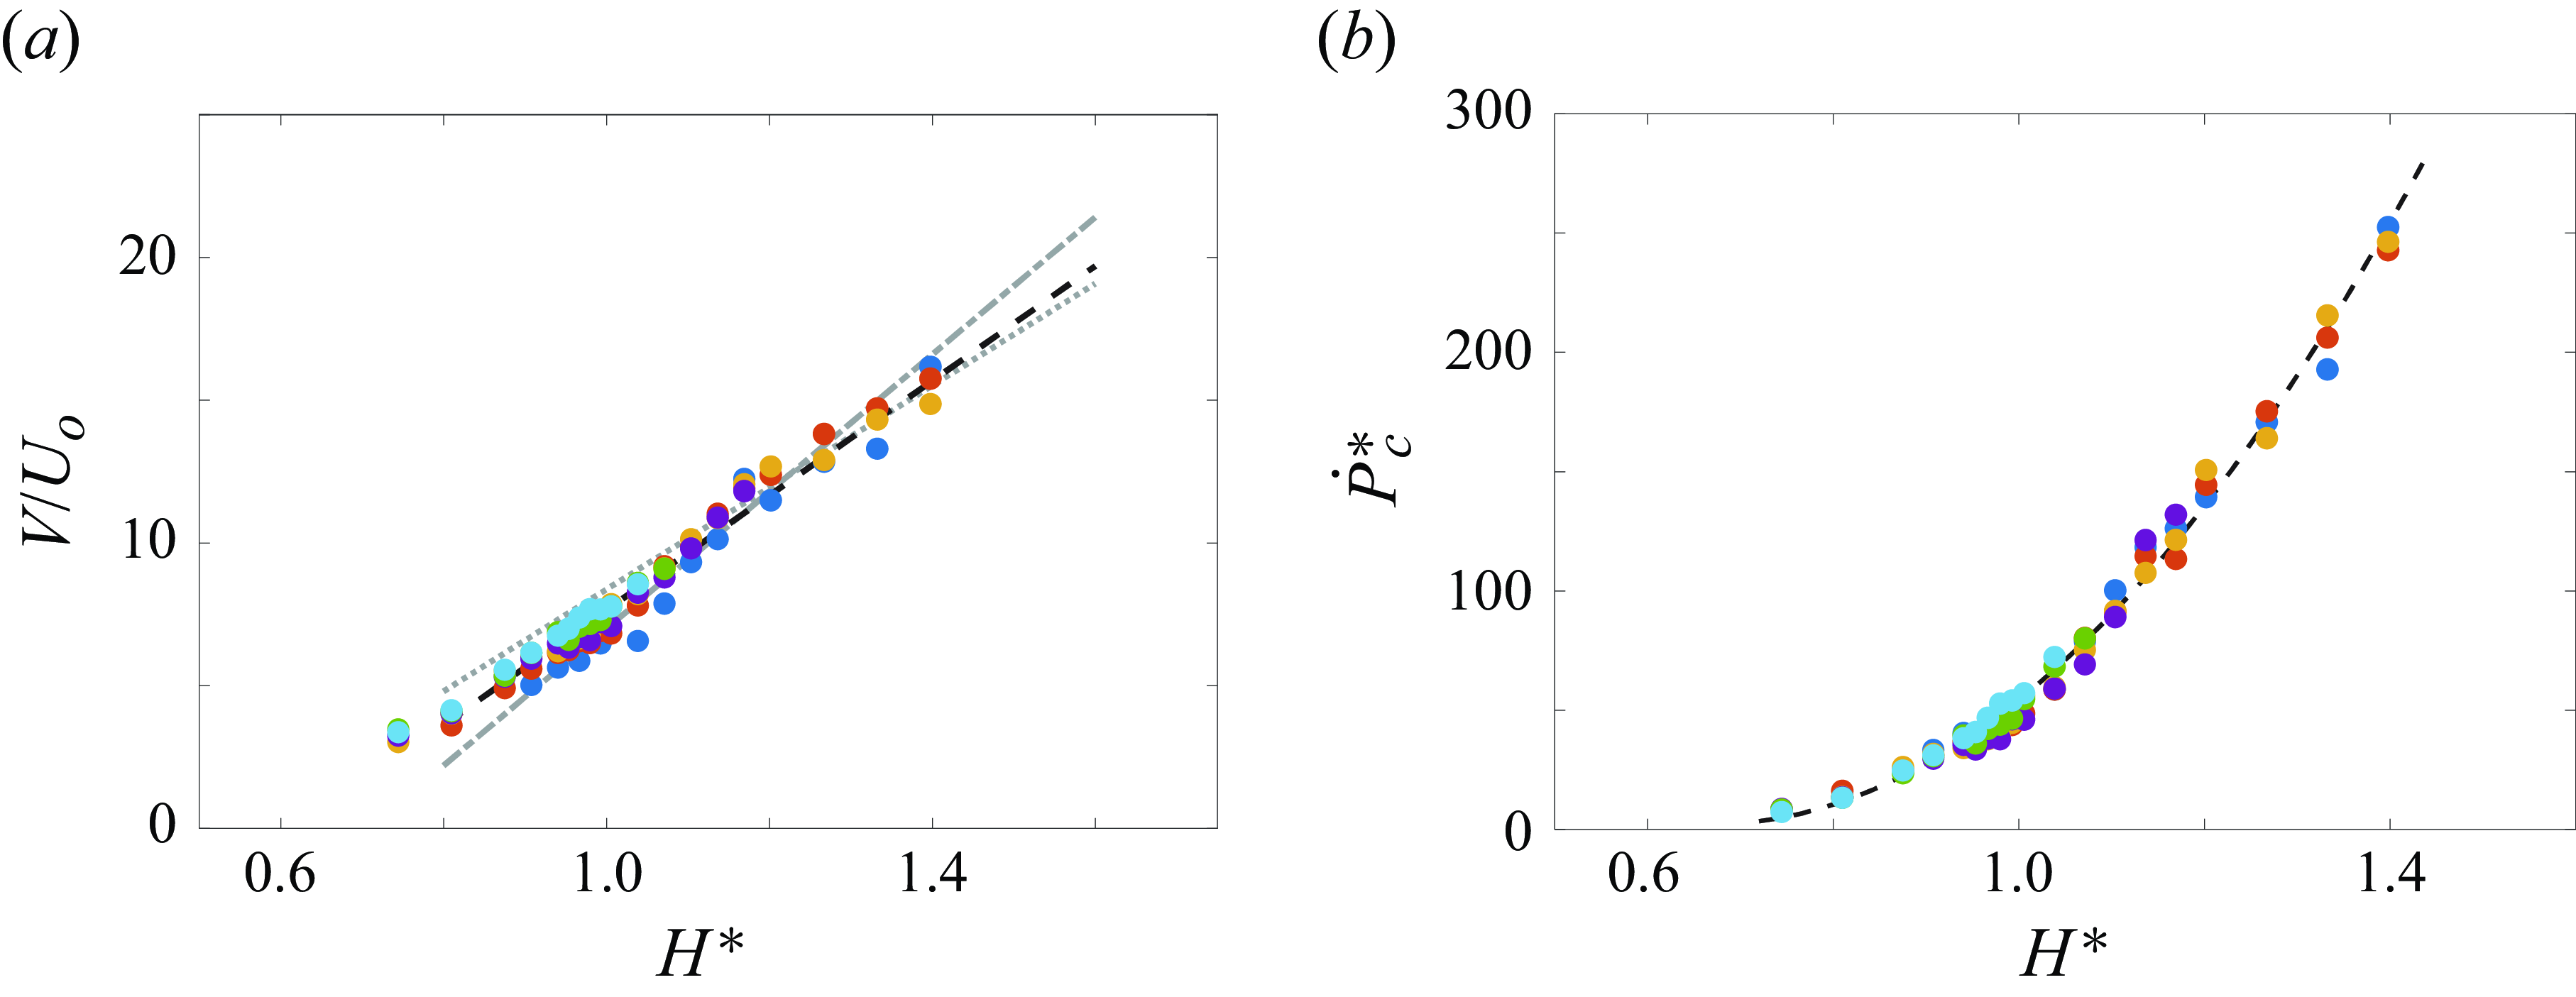
The threshold for the appearance of the ground vortex is captured with higher fidelity compared with the velocity ratio V/U
o
by using an integral scale based on the momentum flux $\dot{P}$
measured in the reference plane y/D = 0.40 along the duct’s centreline (relative to the inlet plane). This momentum flux is scaled by the equivalent cross-wind momentum flux through the inlet plane
$\dot{P}$
measured in the reference plane y/D = 0.40 along the duct’s centreline (relative to the inlet plane). This momentum flux is scaled by the equivalent cross-wind momentum flux through the inlet plane $\dot{P}^{*}=\dot{P}/\rho U_{o}^{2}D^{2}$
akin to the definition of a momentum coefficient in aerodynamic applications that involve jet actuation (e.g. circulation control (Pfingsten & Radespiel Reference Pfingsten and Radespiel2009) or separation control (Otto et al. Reference Otto, Little, Rafferty and Woszidlo2022)). The data in figure 6(b) are replotted in figure 7(b) in terms of
$\dot{P}^{*}=\dot{P}/\rho U_{o}^{2}D^{2}$
akin to the definition of a momentum coefficient in aerodynamic applications that involve jet actuation (e.g. circulation control (Pfingsten & Radespiel Reference Pfingsten and Radespiel2009) or separation control (Otto et al. Reference Otto, Little, Rafferty and Woszidlo2022)). The data in figure 6(b) are replotted in figure 7(b) in terms of $\dot{P}^{*}$
and H*
= H/D to establish a formation boundary where the family of such boundaries for different cross-wind speeds collapse onto a single curve that separates realisable vortical states (above) from the flow states without ground vortices (below). On one end, as the inlet elevation above the ground plane increases, the inlet momentum flux must also increase to enable the ground vortex formation, indicating that the ground vortex becomes unattainable for large H*
. Conversely, as H*
decreases, the critical inlet momentum for vortex formation decreases asymptotically, approaching a small but non-zero thrust of approximately
$\dot{P}^{*}$
and H*
= H/D to establish a formation boundary where the family of such boundaries for different cross-wind speeds collapse onto a single curve that separates realisable vortical states (above) from the flow states without ground vortices (below). On one end, as the inlet elevation above the ground plane increases, the inlet momentum flux must also increase to enable the ground vortex formation, indicating that the ground vortex becomes unattainable for large H*
. Conversely, as H*
decreases, the critical inlet momentum for vortex formation decreases asymptotically, approaching a small but non-zero thrust of approximately $\dot{P}^{*}$
≈ 5 such that a ground vortex can form even at a very low inlet momentum flux (or thrust). The formation boundary can be represented using a quadratic polynomial of the form
$\dot{P}^{*}$
≈ 5 such that a ground vortex can form even at a very low inlet momentum flux (or thrust). The formation boundary can be represented using a quadratic polynomial of the form $\dot{P}_{c}^{*}$
= a · H*
2 + b · H*
+ c (here, a = 480, b = –650 and c = 225). This formation criterion captures the limits of small and large H
* and is therefore arguably more representative than the simple linear model based on velocity scale V/U
o
.
$\dot{P}_{c}^{*}$
= a · H*
2 + b · H*
+ c (here, a = 480, b = –650 and c = 225). This formation criterion captures the limits of small and large H
* and is therefore arguably more representative than the simple linear model based on velocity scale V/U
o
.
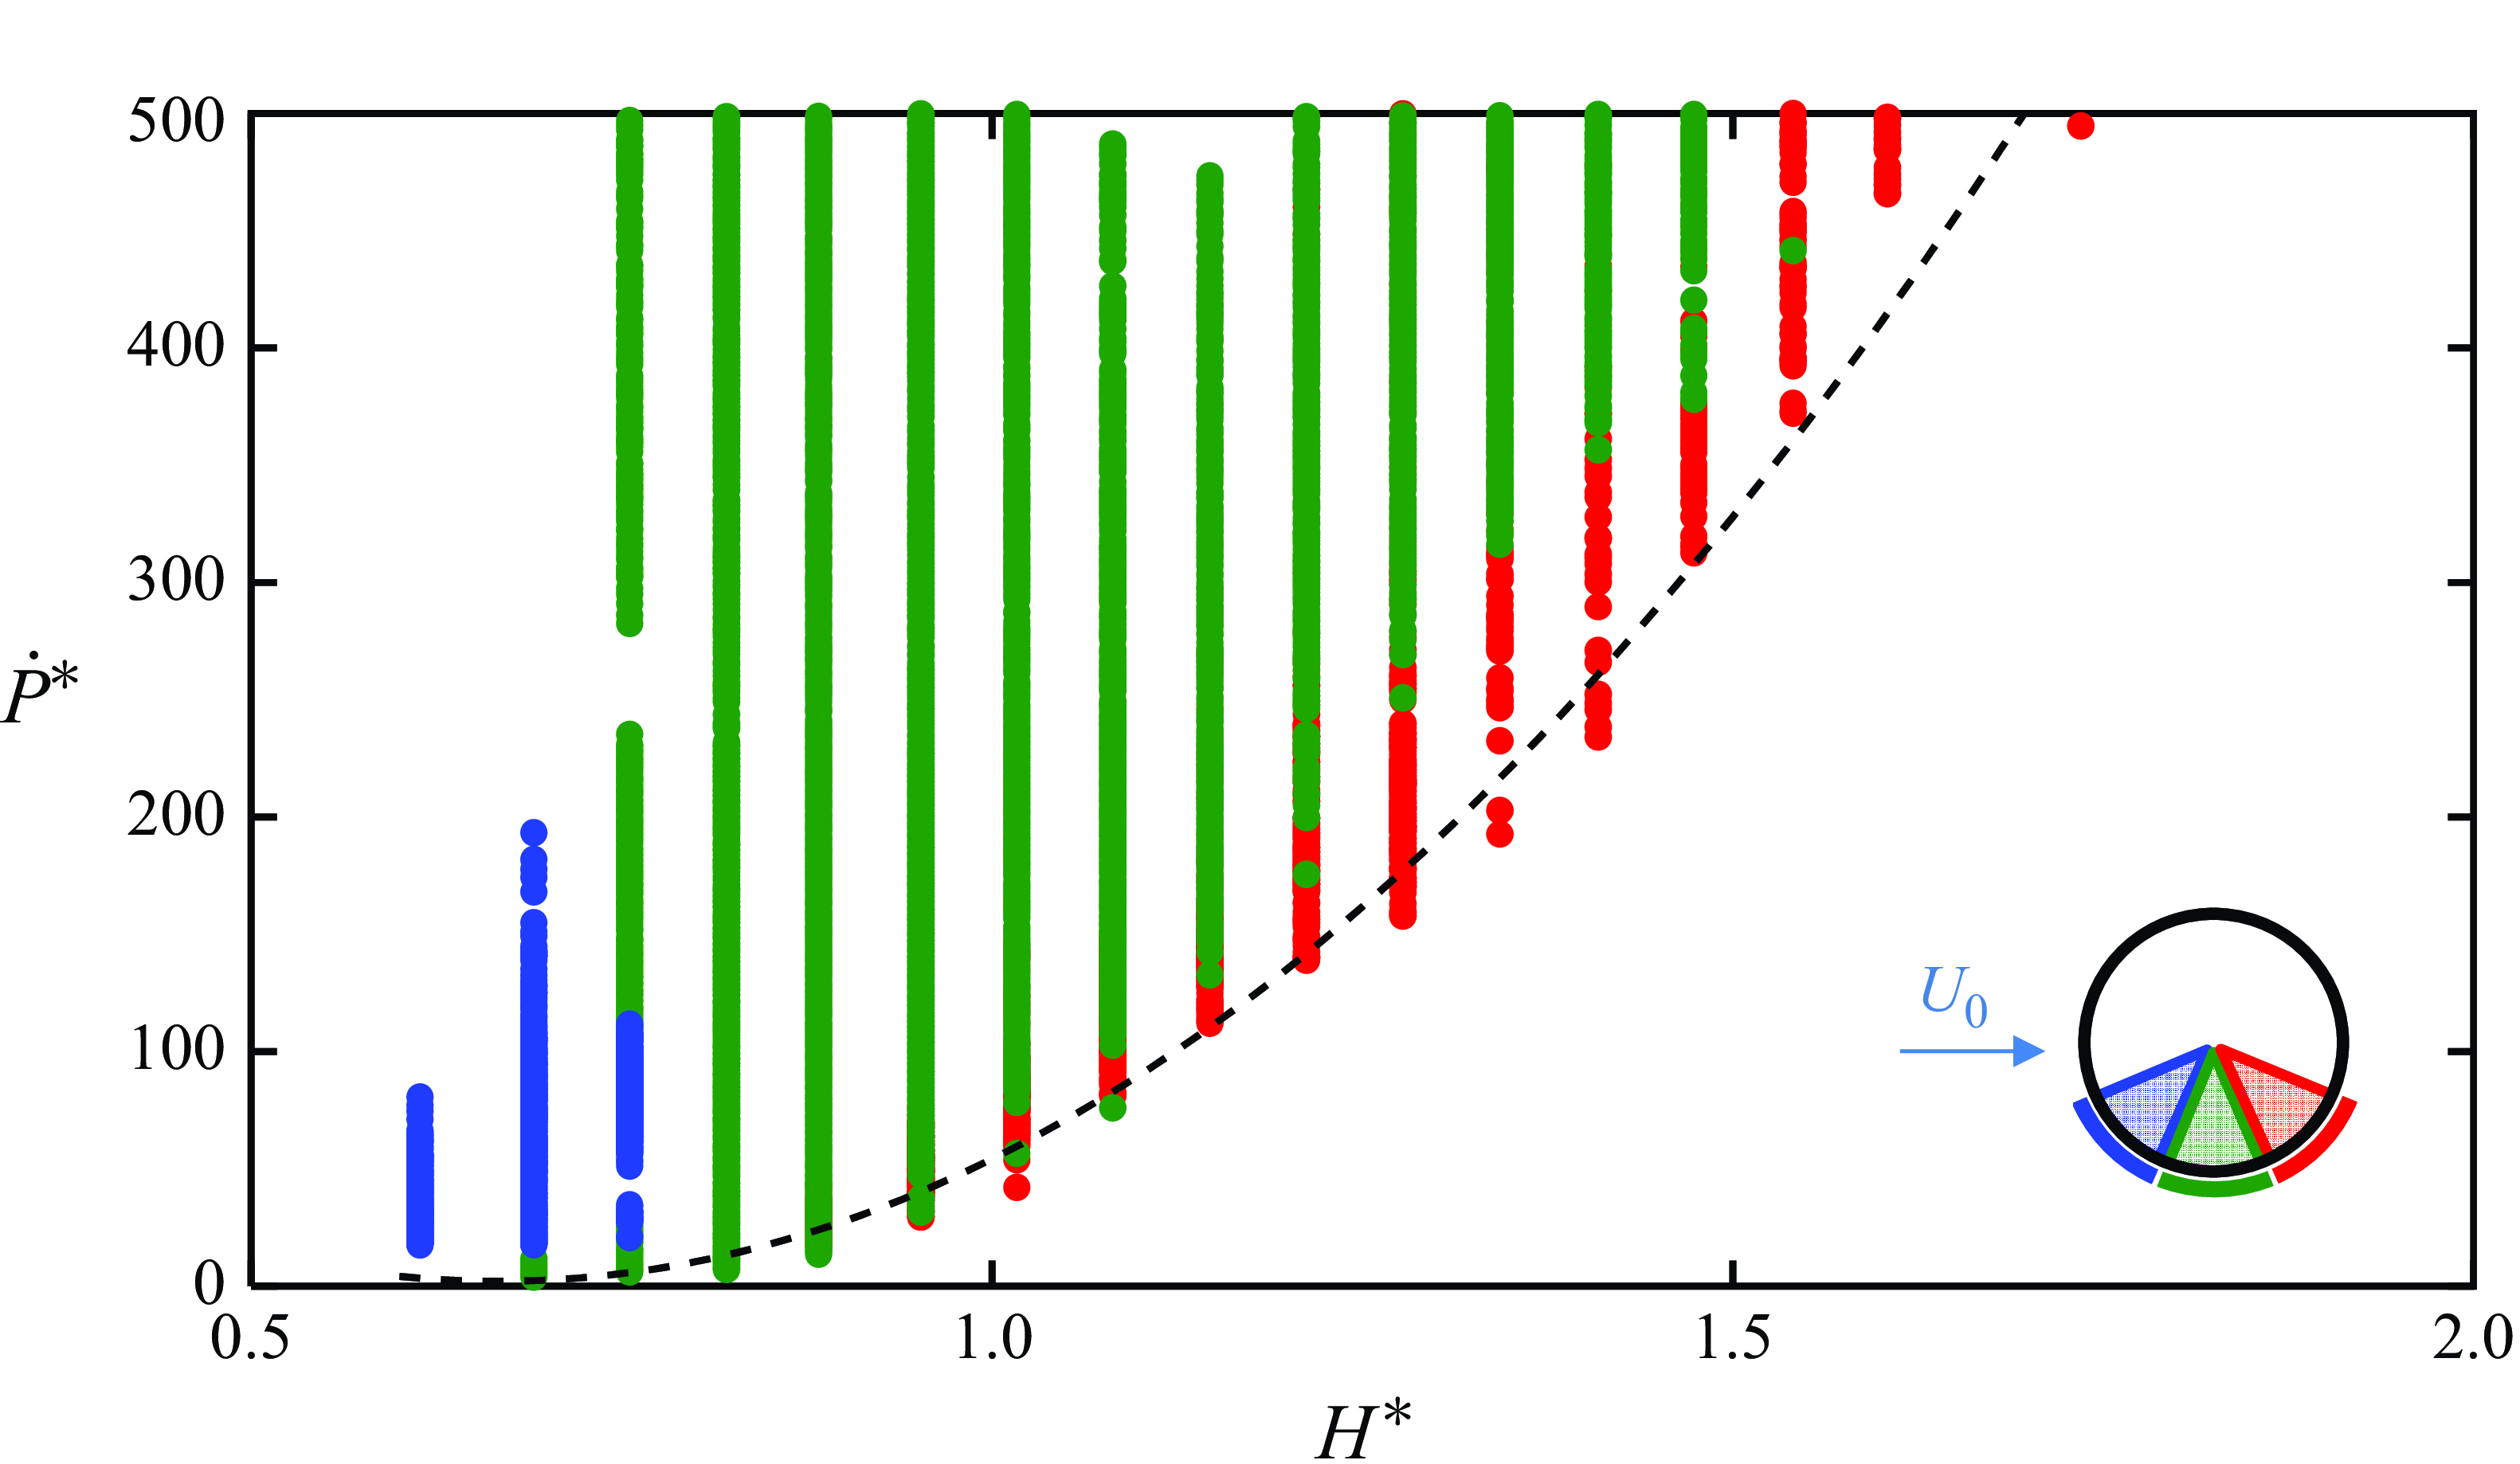
A state map showing the presence of a ground vortex in sectors S4 (![]() ), S5 (
), S5 (![]() ) and S6 (
) and S6 (![]() ) at various ground plane elevations and inlet momentum coefficients. The formation (threshold) curve from figure 7(b) is included for reference using a dashed line.
) at various ground plane elevations and inlet momentum coefficients. The formation (threshold) curve from figure 7(b) is included for reference using a dashed line.
The collapse of the formation curves (figure 6
b) into the vortex existence envelope (figure 7
b) suggests that any vortex flow state may be uniquely defined by the two dimensionless parameters ( $\dot{P}^{{*}}$
, H*
). The effects of the formation parameters
$\dot{P}^{{*}}$
, H*
). The effects of the formation parameters $\dot{P}^{*}$
and H*
on the azimuthal position of the vortex within the inlet’s eight 45° sectors (S1–S8) defined by the total pressure rakes using the procedure discussed in connection with figure 5(b) is explored in figure 8. The presence of a ground vortex was investigated over a range of the three primary dimensional parameters
$\dot{P}^{*}$
and H*
on the azimuthal position of the vortex within the inlet’s eight 45° sectors (S1–S8) defined by the total pressure rakes using the procedure discussed in connection with figure 5(b) is explored in figure 8. The presence of a ground vortex was investigated over a range of the three primary dimensional parameters $\dot{P}$
, U
o
and H and a corresponding map that shows the presence of a vortex on and above the formation boundary is shown in figure 8 in terms of
$\dot{P}$
, U
o
and H and a corresponding map that shows the presence of a vortex on and above the formation boundary is shown in figure 8 in terms of $\dot{P}^{*}$
and H*
. For this experiment, the cross-wind speed and ground plane distance are fixed, and the inlet momentum flux is increased from some minimum to maximum value. Simultaneously, the total pressures are recorded and used to detect the presence and location of a vortex. Each point on this map indicates the presence of a ground vortex and identifies the sector where it was detected (S4, S5 and S6, the sectors are identified by colour). The map clearly shows the formation boundary depicted in figure 7(b) even though the data in figure 8 were acquired over a broader range of steady cross-wind speeds and during temporal, quasi-steady variation of the inlet momentum. The map shows that at the highest elevation relative to the ground plane, the vortex is first detected in sector S4 and migrates clockwise towards the inlet’s windward edge with increasing
$\dot{P}^{*}$
and H*
. For this experiment, the cross-wind speed and ground plane distance are fixed, and the inlet momentum flux is increased from some minimum to maximum value. Simultaneously, the total pressures are recorded and used to detect the presence and location of a vortex. Each point on this map indicates the presence of a ground vortex and identifies the sector where it was detected (S4, S5 and S6, the sectors are identified by colour). The map clearly shows the formation boundary depicted in figure 7(b) even though the data in figure 8 were acquired over a broader range of steady cross-wind speeds and during temporal, quasi-steady variation of the inlet momentum. The map shows that at the highest elevation relative to the ground plane, the vortex is first detected in sector S4 and migrates clockwise towards the inlet’s windward edge with increasing $\dot{P}^{*}$
. As H*
decreases, the appearance of the vortex which occurs at lower
$\dot{P}^{*}$
. As H*
decreases, the appearance of the vortex which occurs at lower $\dot{P}^{*}$
is within S5 for H*
< 1 and then migrates farther towards the windward side of the inlet within S6. Overall, the data in figure 8 clearly indicate that, at least within this range of operating conditions, the vortex’s most probable presence is within S5 and that once the vortex appears at low H*
it can move towards the windward edge with increased
$\dot{P}^{*}$
is within S5 for H*
< 1 and then migrates farther towards the windward side of the inlet within S6. Overall, the data in figure 8 clearly indicate that, at least within this range of operating conditions, the vortex’s most probable presence is within S5 and that once the vortex appears at low H*
it can move towards the windward edge with increased $\dot{P}^{*}$
. Conversely, these data show that, when
$\dot{P}^{*}$
. Conversely, these data show that, when $\dot{P}^{*}$
is decreased through an increase in the cross-flow speed or decrease in the inlet momentum flux while H*
remains fixed, the vortex migrates towards the leeward side and if the threshold or formation boundary defined above is crossed, the vortex disappears from the inlet. Furthermore, when
$\dot{P}^{*}$
is decreased through an increase in the cross-flow speed or decrease in the inlet momentum flux while H*
remains fixed, the vortex migrates towards the leeward side and if the threshold or formation boundary defined above is crossed, the vortex disappears from the inlet. Furthermore, when $\dot{P}^{*}$
is increased, the ultimate vortex position and its measured pressure signature within the inlet are independent of the rate of increase of
$\dot{P}^{*}$
is increased, the ultimate vortex position and its measured pressure signature within the inlet are independent of the rate of increase of $\dot{P}^{*}$
(even when the rate changes by a factor of four).
$\dot{P}^{*}$
(even when the rate changes by a factor of four).
Given the collapse of the data on the formation boundary in figures 7(b) and 8, it is conjectured that the dimensionless momentum flux and the inlet’s normalised elevation also characterise the velocity field outside of the inlet and govern the evolution of the ground vortex which depends on the same primary parameters. For example, it is desired to test whether for a given elevation above the ground plane, the flow state can be uniquely prescribed by a momentum coefficient $\dot{P}^{*}$
that can be set by multiple combinations of the inlet momentum flux
$\dot{P}^{*}$
that can be set by multiple combinations of the inlet momentum flux $\dot{P}$
and cross-wind speed U
o
such that the flow fields associated with these combinations would be similar for the invariant
$\dot{P}$
and cross-wind speed U
o
such that the flow fields associated with these combinations would be similar for the invariant $\dot{P}^{*}$
. To this end, flow fields in the absence and presence of a ground vortex are investigated at two respective disparate levels of
$\dot{P}^{*}$
. To this end, flow fields in the absence and presence of a ground vortex are investigated at two respective disparate levels of $\dot{P}^{*}$
for the same inlet elevation H*
that are selected from the vortex map in figure 7(b). The approach is to compare 2-D projections of the flow field in the inlet (x–z) plane at two sufficiently different combinations of
$\dot{P}^{*}$
for the same inlet elevation H*
that are selected from the vortex map in figure 7(b). The approach is to compare 2-D projections of the flow field in the inlet (x–z) plane at two sufficiently different combinations of $\dot{P}$
and U
o
for each
$\dot{P}$
and U
o
for each $\dot{P}^{*}$
:
i.
when a vortex is clearly absent as shown in figure 9(a) (
$\dot{P}^{*}$
:
i.
when a vortex is clearly absent as shown in figure 9(a) ( $\dot{P}^{*}$
= 16.5 formed by (1)
$\dot{P}^{*}$
= 16.5 formed by (1) $\dot{P}$
= 45 N and U
o
= 7.7 m s−1 and (2)
$\dot{P}$
= 45 N and U
o
= 7.7 m s−1 and (2) $\dot{P}$
= 179 N and U
o
= 15.4 m s−1); and
ii.
when a vortex is present as shown in figure 9(b) (
$\dot{P}$
= 179 N and U
o
= 15.4 m s−1); and
ii.
when a vortex is present as shown in figure 9(b) ( $\dot{P}^{*}$
= 205 formed by (1)
$\dot{P}^{*}$
= 205 formed by (1) $\dot{P}$
= 62 N and U
o
= 2.6 m s−1 and (2)
$\dot{P}$
= 62 N and U
o
= 2.6 m s−1 and (2) $\dot{P}$
= 988 N and U
o
= 10.3 m s−1). Each pair of the corresponding projected distributions of velocity vectors within the inlet plane in figures 9(a) and 9(b) includes two superimposed maps (−0.59 < x/D< 1.96, −0.92 < z/D< 0.87), each acquired at one of the combinations of
$\dot{P}$
= 988 N and U
o
= 10.3 m s−1). Each pair of the corresponding projected distributions of velocity vectors within the inlet plane in figures 9(a) and 9(b) includes two superimposed maps (−0.59 < x/D< 1.96, −0.92 < z/D< 0.87), each acquired at one of the combinations of $\dot{P}$
and U
o
, and the vectors in each map are scaled by the respective cross-wind speed and plotted using different colours (for clarity of comparison, the two vector maps are slightly displaced by z/D = −0.013). As is evident in figures 9(a) and 9(b), the scaled superimposed flow field pairs in the absence (figure 9
a) and presence (figure 9
b) of the ground vortex exhibit remarkable similarity in their overall features, although these planar flow maps do not include the normal out of plane velocity component. Specifically, in the absence of the ground vortex (figure 9
a) the almost symmetric flow about the streamwise (x) axis also exhibits clear streamwise (left/right) asymmetry of the flow that is captured by suction into the inlet upstream and downstream along the direction of the cross-flow and there is evidence of a local saddle downstream of the inlet duct at x/D = 0.58, z/R = 0 (as marked on the map) that delineates between cross-stream flow into and along the duct’s axis. In the presence of the vortex (figure 9
b), the vector field clearly shows flow from the ground plane into the inlet with upwash flows upstream and downstream of the vortex core while the vortex appears to be bending into the inlet at θ = 185o. It is noteworthy that the upwash downstream of the vortex along the direction of the cross-flow is stronger as a result of downward tilt of the inlet’s wake as discussed in more detail in § 4. It is noteworthy that, in the presence of the vortex, the streamwise asymmetry of the suction flow diminishes somewhat, as the domain that is affected by the suction downstream of the duct’s inlet plane expands while the saddle in figure 9(a) appears to migrate down to the ground plane as the wake is ingested into the inlet.
$\dot{P}$
and U
o
, and the vectors in each map are scaled by the respective cross-wind speed and plotted using different colours (for clarity of comparison, the two vector maps are slightly displaced by z/D = −0.013). As is evident in figures 9(a) and 9(b), the scaled superimposed flow field pairs in the absence (figure 9
a) and presence (figure 9
b) of the ground vortex exhibit remarkable similarity in their overall features, although these planar flow maps do not include the normal out of plane velocity component. Specifically, in the absence of the ground vortex (figure 9
a) the almost symmetric flow about the streamwise (x) axis also exhibits clear streamwise (left/right) asymmetry of the flow that is captured by suction into the inlet upstream and downstream along the direction of the cross-flow and there is evidence of a local saddle downstream of the inlet duct at x/D = 0.58, z/R = 0 (as marked on the map) that delineates between cross-stream flow into and along the duct’s axis. In the presence of the vortex (figure 9
b), the vector field clearly shows flow from the ground plane into the inlet with upwash flows upstream and downstream of the vortex core while the vortex appears to be bending into the inlet at θ = 185o. It is noteworthy that the upwash downstream of the vortex along the direction of the cross-flow is stronger as a result of downward tilt of the inlet’s wake as discussed in more detail in § 4. It is noteworthy that, in the presence of the vortex, the streamwise asymmetry of the suction flow diminishes somewhat, as the domain that is affected by the suction downstream of the duct’s inlet plane expands while the saddle in figure 9(a) appears to migrate down to the ground plane as the wake is ingested into the inlet.
(a, b) Pairs of distributions of time-averaged velocity vectors in the inlet (x–z) plane normalised and colour marked by U
o
in the absence (a, $\dot{{P}}^{{*}}$
= 16.5, H
* = 0.94) and presence (b),
$\dot{{P}}^{{*}}$
= 16.5, H
* = 0.94) and presence (b), $\dot{{P}}^{{*}}$
= 205, H
* = 0.94) of a ground vortex: in (a)
$\dot{{P}}^{{*}}$
= 205, H
* = 0.94) of a ground vortex: in (a) $\dot{{P}}^{{*}}$
= 16.5
$\dot{{P}}^{{*}}$
= 16.5 $(\dot{{P}}$
, U
o
) = (
$(\dot{{P}}$
, U
o
) = (![]() ) and (
) and (![]() ) and in (b)
) and in (b) $\dot{{P}}^{{*}}$
= 205
$\dot{{P}}^{{*}}$
= 205 $(\dot{{P}}$
, U
o
) = (
$(\dot{{P}}$
, U
o
) = (![]() ) and (
) and (![]() ); (c, d) pairs of traces of the streamwise velocity component normalised by U
o
along z/D = 0 where each of the traces in (c) and (d) corresponds to a flow field in (a) and (b), respectively; and (e, f) pairs of colour raster plots of the total pressure distributions in the plane y/D = 0.40 corresponding to the vector maps in (a) and (b): in the absence (
); (c, d) pairs of traces of the streamwise velocity component normalised by U
o
along z/D = 0 where each of the traces in (c) and (d) corresponds to a flow field in (a) and (b), respectively; and (e, f) pairs of colour raster plots of the total pressure distributions in the plane y/D = 0.40 corresponding to the vector maps in (a) and (b): in the absence (![]() ) and presence
) and presence ![]() of the ground vortex.
of the ground vortex.
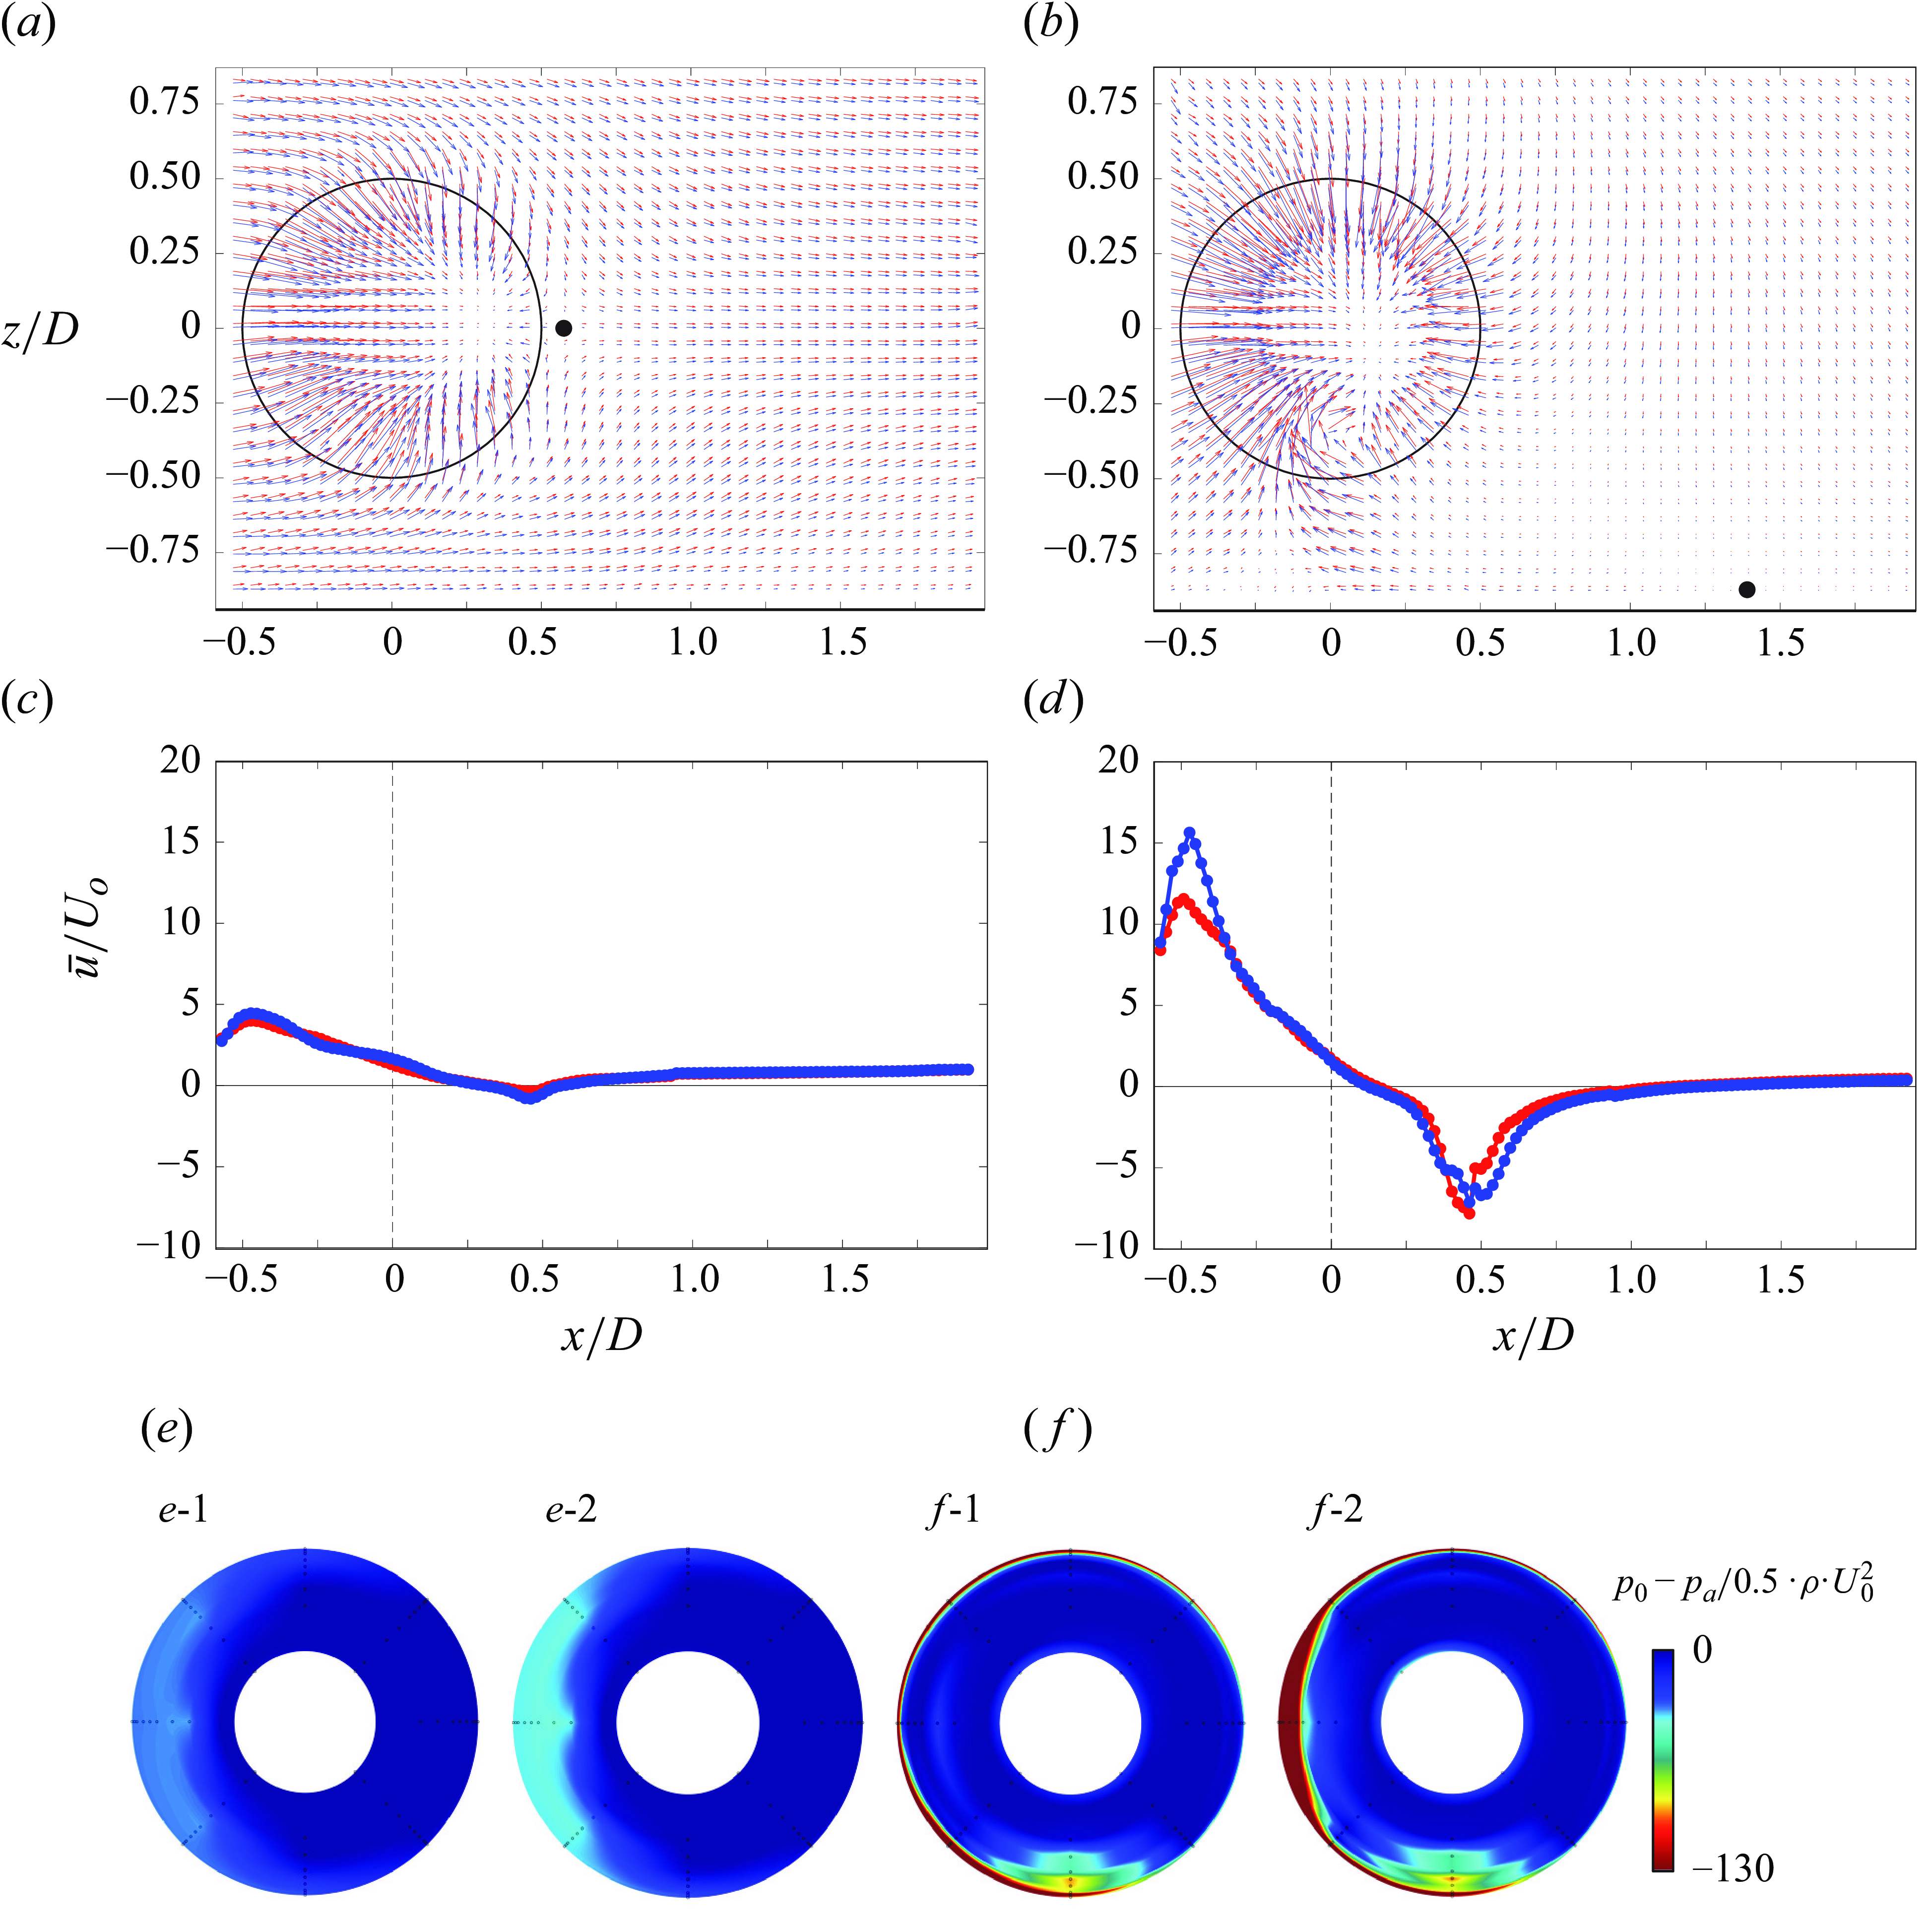
The similarity of the velocity flow fields both in the absence and presence of the ground vortex in figures 9(a) and 9(b), respectively, is also shown by plotting traces of the variation along x of the corresponding time-averaged streamwise velocity component normalised by the cross-wind speed, $\overline{u}$
/U
o
, along z/D = 0 within each vector plane (figures 9
c and 9
d, respectively). The traces in each pair exhibit reasonable similarity except at the velocity peaks near the edge (tip) of the inlet at x/D = ±0.5 owing to accentuated differences in local acceleration at the two disparate levels of
$\overline{u}$
/U
o
, along z/D = 0 within each vector plane (figures 9
c and 9
d, respectively). The traces in each pair exhibit reasonable similarity except at the velocity peaks near the edge (tip) of the inlet at x/D = ±0.5 owing to accentuated differences in local acceleration at the two disparate levels of $\dot{P}$
. These differences in velocity magnitude near the inlet’s tip may also be attributed to significant differences in the internal flow within the inlet that are depicted in colour raster plots of the total pressure measured in the plane y/D = 0.40 (cf. figure 2), which are shown in figures 9(e) and 9(f) for
$\dot{P}$
. These differences in velocity magnitude near the inlet’s tip may also be attributed to significant differences in the internal flow within the inlet that are depicted in colour raster plots of the total pressure measured in the plane y/D = 0.40 (cf. figure 2), which are shown in figures 9(e) and 9(f) for $\dot{P}$
and U
o
of each of the vector flow field pairs in figures 9(a) and 9(b), respectively. These maps show that at the higher
$\dot{P}$
and U
o
of each of the vector flow field pairs in figures 9(a) and 9(b), respectively. These maps show that at the higher $\dot{P}$
and U
o
, the flow on the inner surface of the inlet’s windward side sustains total pressure losses that may be accompanied by a local azimuthal segment of a separation domain (figures 9
e and 9
f-2), as discussed by Nichols et al. (Reference Nichols, Vukasinovic, Glezer and Rafferty2024). When the vortex is formed at a given (dimensionless) momentum flux, the signature of total pressure at the base of the inlet is nearly invariant when scaled by the dynamic pressure of the cross-wind. This indicates that the total pressure of the vortex for a given momentum coefficient is similar regardless of the combination of
$\dot{P}$
and U
o
, the flow on the inner surface of the inlet’s windward side sustains total pressure losses that may be accompanied by a local azimuthal segment of a separation domain (figures 9
e and 9
f-2), as discussed by Nichols et al. (Reference Nichols, Vukasinovic, Glezer and Rafferty2024). When the vortex is formed at a given (dimensionless) momentum flux, the signature of total pressure at the base of the inlet is nearly invariant when scaled by the dynamic pressure of the cross-wind. This indicates that the total pressure of the vortex for a given momentum coefficient is similar regardless of the combination of $\dot{P}$
and U
o
which make up
$\dot{P}$
and U
o
which make up $\dot{P}^{*}$
. As there is evidence of flow separation for both cases in figure 9(e) that differ in their scaled magnitudes while separation only exists for one case in figure 9(f), it might be argued that the scaling or similarity of the velocity field externally to inlet may not fully apply to its internal flow field as the presence and signature of the windward flow separation does not scale with the dynamic pressure.
$\dot{P}^{*}$
. As there is evidence of flow separation for both cases in figure 9(e) that differ in their scaled magnitudes while separation only exists for one case in figure 9(f), it might be argued that the scaling or similarity of the velocity field externally to inlet may not fully apply to its internal flow field as the presence and signature of the windward flow separation does not scale with the dynamic pressure.
4. Mechanism of ground vortex formation
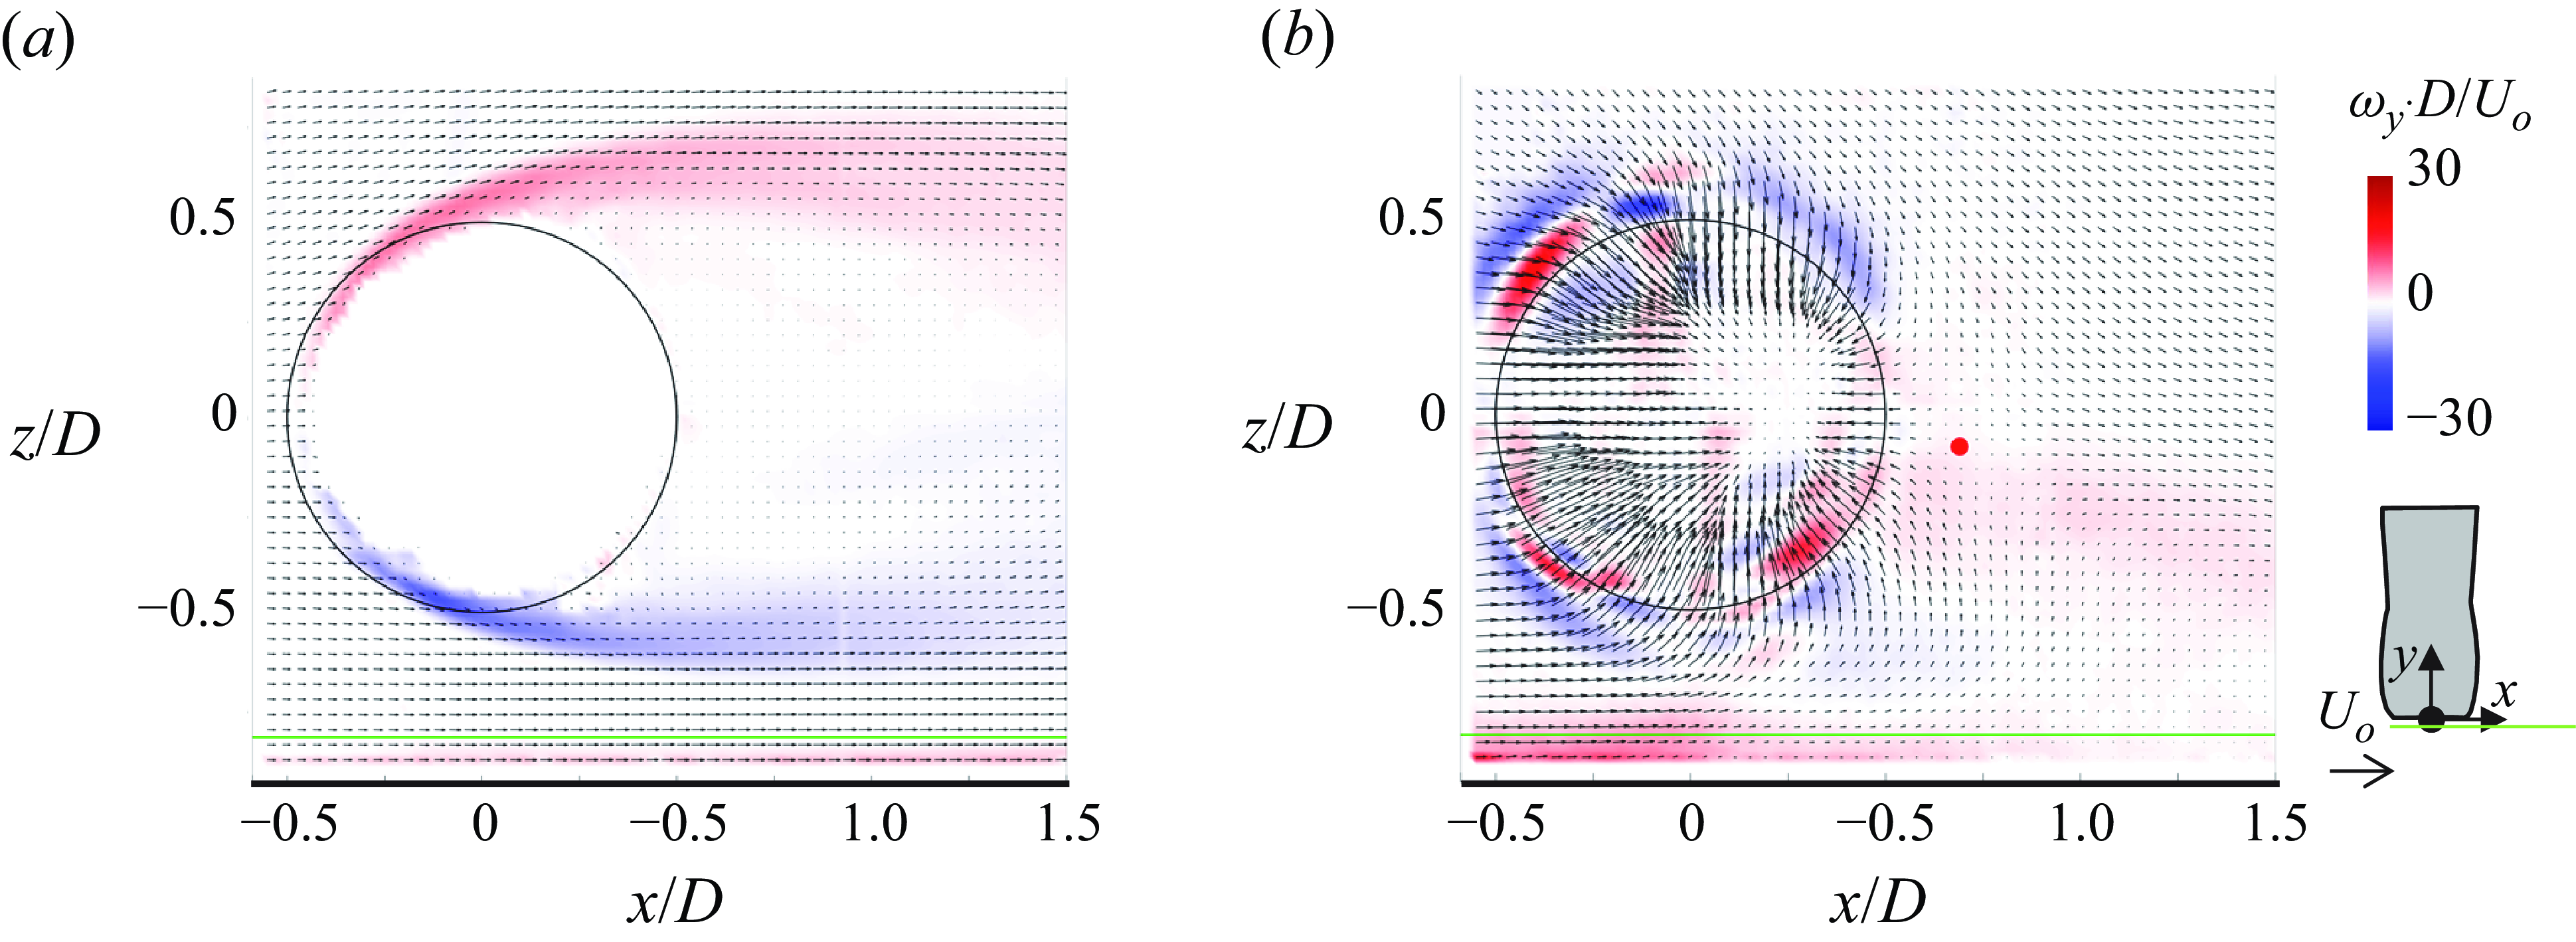
Characteristic interactions between the inlet and the cross-flow in the absence and presence of suction (below $\dot{P}_{c}^{*}$
for ground vortex formation) are shown for reference in the (vertical) x–z inlet plane y/D = –0.03 in figures 10(a) and 10(b), respectively, using colour raster plots of spanwise vorticity concentrations
$\dot{P}_{c}^{*}$
for ground vortex formation) are shown for reference in the (vertical) x–z inlet plane y/D = –0.03 in figures 10(a) and 10(b), respectively, using colour raster plots of spanwise vorticity concentrations $ \omega $
y
superposed with velocity vectors. In the absence of suction, the flow over the inlet exhibits a typical wake flow with slight asymmetry owing to the presence of the ground plane at z/D = –0.94). The image also shows the clockwise (CW) vorticity layer over the ground plane (nominal thickness of 0.08D at x = 0). The flow field in the inlet plane is significantly altered in the presence of suction into the inlet. As shown in figure 10(
b) (
$ \omega $
y
superposed with velocity vectors. In the absence of suction, the flow over the inlet exhibits a typical wake flow with slight asymmetry owing to the presence of the ground plane at z/D = –0.94). The image also shows the clockwise (CW) vorticity layer over the ground plane (nominal thickness of 0.08D at x = 0). The flow field in the inlet plane is significantly altered in the presence of suction into the inlet. As shown in figure 10(
b) ( $\dot{P}^{*}$
= 29), the suction flow in the inlet plane is characterised by four quadrant domains: two each within the windward and leeward segments of the inlet. The windward radial flows centred about θ ≈ 315° and 225° (cf. figure 2
a) are tilted upward and downward, respectively, and the projections of the induced flows in the inlet plane are characterised by pairs of azimuthal outer and inner bands of counterclockwise (CCW) and CW concentrations of spanwise vorticity. It is noted that the sense of the inner CW bands is inverted as the flow is turned over the inner surface of the inlet. The suction flow over the leeward side of the inlet is marked by corresponding downward and upward flows centred about θ ≈ 45° and 135°, respectively. An important feature of the flow induced by the suction is the marked thickening of the CW spanwise vorticity over the ground plane that peaks at x/D ≈ 0, z/D ≈ –0.76 with thickness of 0.18D above the surface. These data indicate that the intensification of the surface vorticity layer underneath the inlet is associated with the contraction of the cross-flow. Farther downstream along the direction of the cross-flow for x/D> 0, the flow diverges as it is turned backwards towards the inlet by the suction and the flow over the ground plane is slowed significantly as manifested by significant reduction in the magnitude of
$\dot{P}^{*}$
= 29), the suction flow in the inlet plane is characterised by four quadrant domains: two each within the windward and leeward segments of the inlet. The windward radial flows centred about θ ≈ 315° and 225° (cf. figure 2
a) are tilted upward and downward, respectively, and the projections of the induced flows in the inlet plane are characterised by pairs of azimuthal outer and inner bands of counterclockwise (CCW) and CW concentrations of spanwise vorticity. It is noted that the sense of the inner CW bands is inverted as the flow is turned over the inner surface of the inlet. The suction flow over the leeward side of the inlet is marked by corresponding downward and upward flows centred about θ ≈ 45° and 135°, respectively. An important feature of the flow induced by the suction is the marked thickening of the CW spanwise vorticity over the ground plane that peaks at x/D ≈ 0, z/D ≈ –0.76 with thickness of 0.18D above the surface. These data indicate that the intensification of the surface vorticity layer underneath the inlet is associated with the contraction of the cross-flow. Farther downstream along the direction of the cross-flow for x/D> 0, the flow diverges as it is turned backwards towards the inlet by the suction and the flow over the ground plane is slowed significantly as manifested by significant reduction in the magnitude of $ \omega $
y
over the surface. As marked on figure 10(b), the flow field in the x–z plane downstream of the duct’s inlet includes a saddle point at x/D ≈ 0.67, z/D ≈ –0.08 that delineates the flow that is advected into the inlet from the streamwise flow along the direction of the cross-flow.
$ \omega $
y
over the surface. As marked on figure 10(b), the flow field in the x–z plane downstream of the duct’s inlet includes a saddle point at x/D ≈ 0.67, z/D ≈ –0.08 that delineates the flow that is advected into the inlet from the streamwise flow along the direction of the cross-flow.
Colour raster plots of the time-averaged vorticity component $\omega$
y
normal to the inlet plane y/D = −0.03 (shown schematically in the inset), overlaid with velocity vectors, measured at H
* = 0.94 and
$\omega$
y
normal to the inlet plane y/D = −0.03 (shown schematically in the inset), overlaid with velocity vectors, measured at H
* = 0.94 and $\dot{{P}}^{{*}}$
= 0 (a) and 29 (b), before the appearance of a ground vortex). The elevations of the surface plane (z/D = –0.94) and of the x–y plane at z/D = −0.88 are marked for reference using solid black and green lines, respectively, along with the critical saddle point in (b) in red.
$\dot{{P}}^{{*}}$
= 0 (a) and 29 (b), before the appearance of a ground vortex). The elevations of the surface plane (z/D = –0.94) and of the x–y plane at z/D = −0.88 are marked for reference using solid black and green lines, respectively, along with the critical saddle point in (b) in red.
Time-averaged colour raster plots of wall-normal vorticity $\omega$
z
in the x–y plane z′/D = 0.065 overlayed with spanwise distributions of velocity vectors at H
* = 0.94 and
$\omega$
z
in the x–y plane z′/D = 0.065 overlayed with spanwise distributions of velocity vectors at H
* = 0.94 and $\dot{{P}}^{{*}}$
= 13 (a), 29 (b), 40 (c) and 51 (d). The measured flow field when the vortex is formed in (d) is emphasised in (e) using different scales for the velocity vectors and the wall-normal vorticity.
$\dot{{P}}^{{*}}$
= 13 (a), 29 (b), 40 (c) and 51 (d). The measured flow field when the vortex is formed in (d) is emphasised in (e) using different scales for the velocity vectors and the wall-normal vorticity.
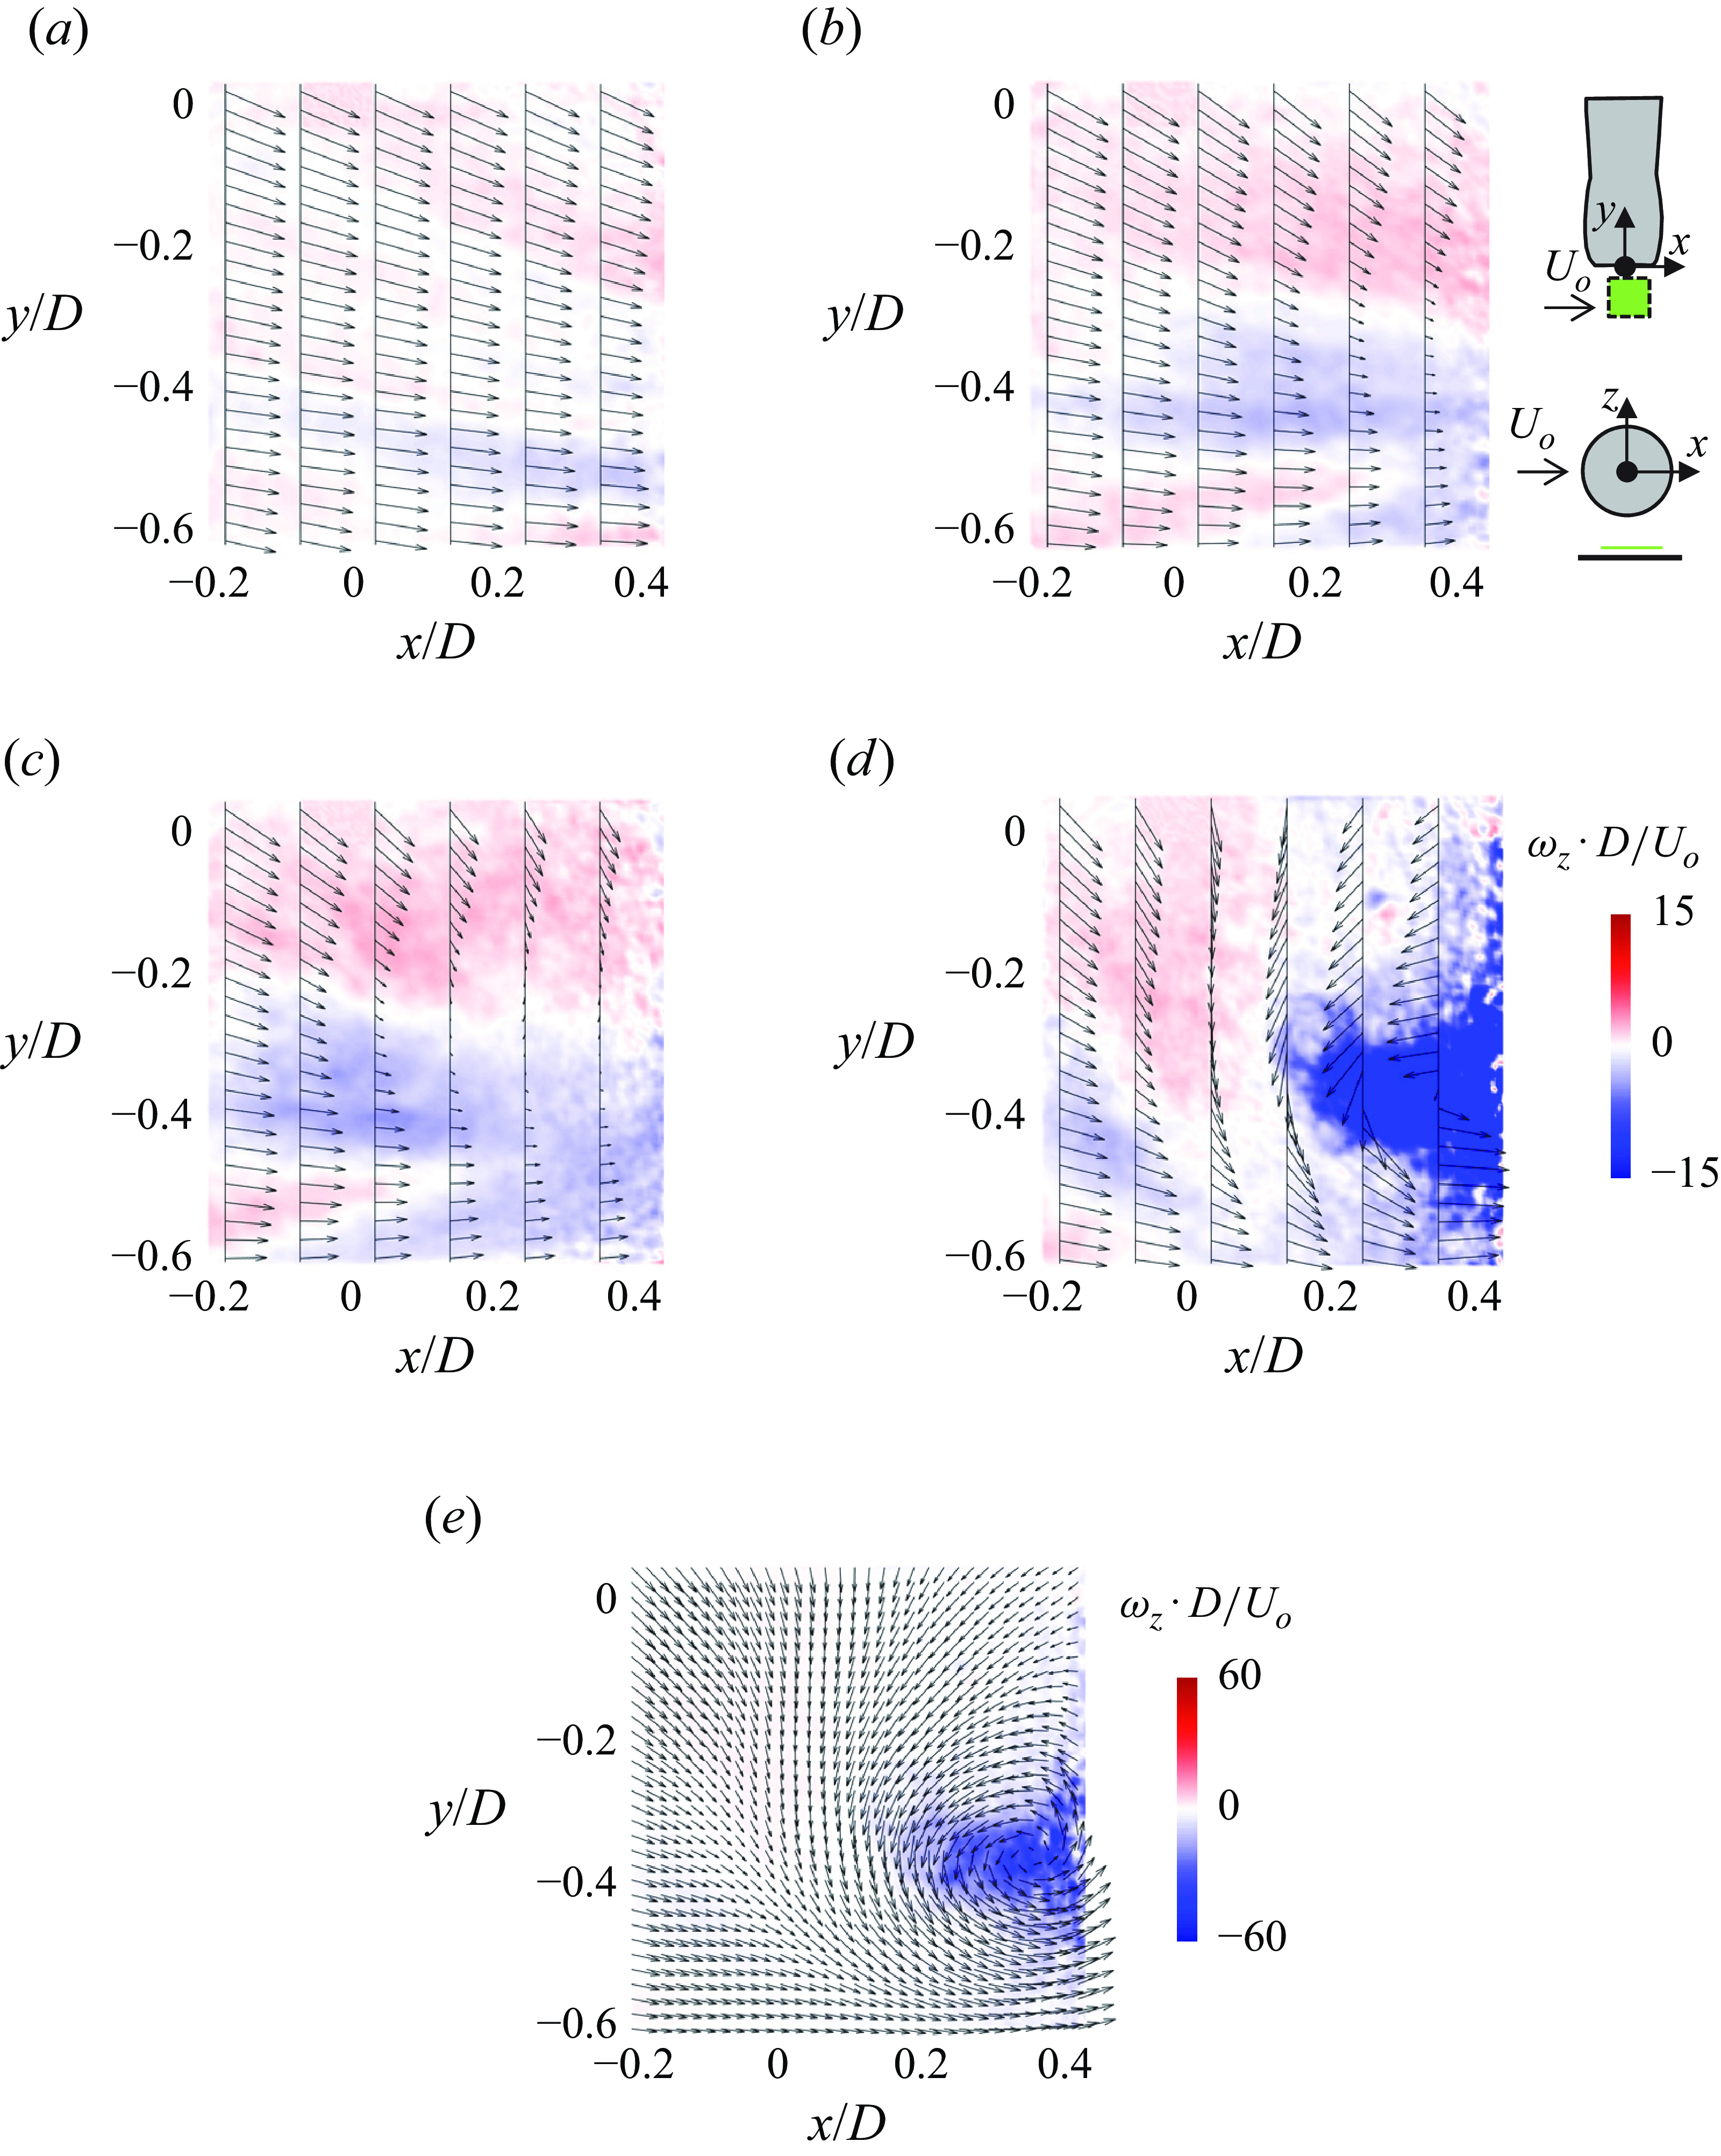
The effect of the suction flow on the predominantly spanwise vorticity layer underneath the inlet is accompanied by the presence of a local domain of shear above the ground plane. The projection of this shear in the x–y plane underneath the inlet’s opening (z/D = −0.88, 0.065D above the ground plane as marked by the green line in figure 10) is manifested by the appearance of a spanwise velocity deficit in figure 11(a–d) using time-averaged colour raster plots of wall-normal vorticity $ \omega $
z
superposed with velocity vectors. These measurements were acquired at H*
= 0.94 and increasing levels of
$ \omega $
z
superposed with velocity vectors. These measurements were acquired at H*
= 0.94 and increasing levels of $\dot{P}^{*}$
= 13, 29, 40 and 51, respectively, before and following the formation of a ground vortex (as shown in figure 7
b, at this H*
intermittent ground vortices first appear within the inlet’s opening at
$\dot{P}^{*}$
= 13, 29, 40 and 51, respectively, before and following the formation of a ground vortex (as shown in figure 7
b, at this H*
intermittent ground vortices first appear within the inlet’s opening at $\dot{P}^{*}_{c}$
= 38). At low momentum flux (
$\dot{P}^{*}_{c}$
= 38). At low momentum flux ( $\dot{P}^{*}$
= 13, figure 11
a), the projected flow in the x–y plane exhibits deflection away from the inlet’s opening, and the interaction between the suction into the inlet and the cross-flow shows some evidence of a velocity deficit centred nominally about y/D ≈ –0.3 and x/D > 0.2 that intensifies at
$\dot{P}^{*}$
= 13, figure 11
a), the projected flow in the x–y plane exhibits deflection away from the inlet’s opening, and the interaction between the suction into the inlet and the cross-flow shows some evidence of a velocity deficit centred nominally about y/D ≈ –0.3 and x/D > 0.2 that intensifies at $\dot{P}^{*}$
= 29 (figure 11b
) and more significantly at
$\dot{P}^{*}$
= 29 (figure 11b
) and more significantly at $\dot{P}^{*}$
= 40 (figure 11c
) where the velocity at the centre of the deficit domain nearly vanishes and some low-magnitude reversed flow is evident at y/D ≈ –0.3. These data show that the increased shear associated with the velocity deficit in figure 11(a
–
c) is accompanied by intensifying CW (
$\dot{P}^{*}$
= 40 (figure 11c
) where the velocity at the centre of the deficit domain nearly vanishes and some low-magnitude reversed flow is evident at y/D ≈ –0.3. These data show that the increased shear associated with the velocity deficit in figure 11(a
–
c) is accompanied by intensifying CW ( $ \omega $
z
> 0) and CCW (
$ \omega $
z
> 0) and CCW ( $ \omega $
z
< 0) wall-normal vorticity concentrations on either side of the peak deficit. It is argued that this wall-normal vorticity is induced by tilting of vortex lines of the predominantly spanwise vorticity layer over the ground plane in a manner that is similar to the formation of hairpin or lambda vortices in a nominally 2-D boundary layer (e.g. Adrian, Meinhart & Tomkins Reference Adrian, Meinhart and Tomkins2000; Jukes & Choi Reference Jukes and Choi2013). As discussed in connection with figure 6(a), the appearance of the ground vortex at or slightly above the formation boundary is intermittent and therefore the time-averaged vorticity does not show a coherent vortex structure. Spectral analysis of the streamwise velocity component (not shown) within the shear/formation band of the vortex flow includes spectral components within 0.053 < St
D
< 0.075, that are associated with the initial shedding of the wall-normal vortices, prior to the establishment of a stationary ground vortex. When the induced momentum flux into the inlet is increased to
$ \omega $
z
< 0) wall-normal vorticity concentrations on either side of the peak deficit. It is argued that this wall-normal vorticity is induced by tilting of vortex lines of the predominantly spanwise vorticity layer over the ground plane in a manner that is similar to the formation of hairpin or lambda vortices in a nominally 2-D boundary layer (e.g. Adrian, Meinhart & Tomkins Reference Adrian, Meinhart and Tomkins2000; Jukes & Choi Reference Jukes and Choi2013). As discussed in connection with figure 6(a), the appearance of the ground vortex at or slightly above the formation boundary is intermittent and therefore the time-averaged vorticity does not show a coherent vortex structure. Spectral analysis of the streamwise velocity component (not shown) within the shear/formation band of the vortex flow includes spectral components within 0.053 < St
D
< 0.075, that are associated with the initial shedding of the wall-normal vortices, prior to the establishment of a stationary ground vortex. When the induced momentum flux into the inlet is increased to $\dot{P}^{*}$
= 51 (figure 11
d), the velocity within the domain y/D > –0.4 and x/D> 0.11 is reversed resulting in a counter-current shear layer with predominantly CCW wall-normal vorticity whose magnitude is saturated within the scale of figure 11(a–c) and is therefore replotted in figure 11(e) showing clear CCW motion centred about y/D = -0.39 and x/D = 0.36. The CCW vortex in figure 11(e) represents a cross-section of a nominally stationary ground vortex, as discussed in more detail below, where the vorticity within its core that extends into the inlet plane originates from the surface vorticity layer.
$\dot{P}^{*}$
= 51 (figure 11
d), the velocity within the domain y/D > –0.4 and x/D> 0.11 is reversed resulting in a counter-current shear layer with predominantly CCW wall-normal vorticity whose magnitude is saturated within the scale of figure 11(a–c) and is therefore replotted in figure 11(e) showing clear CCW motion centred about y/D = -0.39 and x/D = 0.36. The CCW vortex in figure 11(e) represents a cross-section of a nominally stationary ground vortex, as discussed in more detail below, where the vorticity within its core that extends into the inlet plane originates from the surface vorticity layer.
The role of the ground vortex formation parameters on the evolution of the reversed, countercurrent shear flow that leads to the formation of a stationary ground vortex in figure 11(e), is demonstrated by considering the variation of the time-averaged streamwise velocity component u(x) along y/D = –0.03 underneath the inlet’s opening in the x–y plane z/D = –0.82. Figure 12 shows variations of u(x) with 0.88 < H*
< 2.06 at $\dot{P}^{*}$
= 80 (figure 12
a), and with 16 <
$\dot{P}^{*}$
= 80 (figure 12
a), and with 16 < $\dot{P}^{*}$
< 138 at H*
= 0.94 (as in figure 11) (figure 12
b) along with the corresponding plots that show the respective H*
and
$\dot{P}^{*}$
< 138 at H*
= 0.94 (as in figure 11) (figure 12
b) along with the corresponding plots that show the respective H*
and $\dot{P}^{*}$
relative to the formation curve in figure 7(b). When H*
is decreased from 2.06 to 1.14 (to the right of the formation curve), u(x) is nearly invariant upstream of x/D < 1 (the inlet’s centreline is at x = 0) but begins to diminish in the streamwise direction at a rate that increases with decreasing H*
. The flow near the ground does not become reversed until H*
< 1.01 (to the left of the formation curve) when u(x) is reversed for x/D< 0.9 and its peak reversed speed migrates upstream towards the centreline of the inlet (for H*
= 0.875, u/U
o
(x/D = 0.14) = –1.32). A similar evolution of reversed streamwise velocity is demonstrated when the inlet’s momentum flux coefficient is increased at fixed elevation of the inlet (H*
= 0.94, figure 12
b). For
$\dot{P}^{*}$
relative to the formation curve in figure 7(b). When H*
is decreased from 2.06 to 1.14 (to the right of the formation curve), u(x) is nearly invariant upstream of x/D < 1 (the inlet’s centreline is at x = 0) but begins to diminish in the streamwise direction at a rate that increases with decreasing H*
. The flow near the ground does not become reversed until H*
< 1.01 (to the left of the formation curve) when u(x) is reversed for x/D< 0.9 and its peak reversed speed migrates upstream towards the centreline of the inlet (for H*
= 0.875, u/U
o
(x/D = 0.14) = –1.32). A similar evolution of reversed streamwise velocity is demonstrated when the inlet’s momentum flux coefficient is increased at fixed elevation of the inlet (H*
= 0.94, figure 12
b). For $\dot{P}^{*}$
< 50, u(x) diminishes monotonically with x at a streamwise rate that increases with
$\dot{P}^{*}$
< 50, u(x) diminishes monotonically with x at a streamwise rate that increases with $\dot{P}^{*}$
. When
$\dot{P}^{*}$
. When $\dot{P}^{*}$
= 40.6 (on the formation boundary), u(x) becomes slightly reversed at x/D = 1.17 and the magnitude of the reversed flow increases with
$\dot{P}^{*}$
= 40.6 (on the formation boundary), u(x) becomes slightly reversed at x/D = 1.17 and the magnitude of the reversed flow increases with $\dot{P}^{*}$
, reaching a peak of u/U
o
= –3.33 close to the centreline of the inlet when
$\dot{P}^{*}$
, reaching a peak of u/U
o
= –3.33 close to the centreline of the inlet when $\dot{P}^{*}$
= 137. It is noted that, while the domain of the reversed flow extends somewhat beyond the leeward edge of the inlet, it is primarily confined to the domain underneath the inlet. As noted in connection with figures 11(d) and 11(e), and discussed further below, the concentrated wall-normal CCW vorticity that is engendered by the intensifying countercurrent flow over the wall vorticity layer and the intensified suction leads to the appearance of ground vortices that are detected at the inlet’s opening. The present investigations show that as the formation curve is first crossed at some
$\dot{P}^{*}$
= 137. It is noted that, while the domain of the reversed flow extends somewhat beyond the leeward edge of the inlet, it is primarily confined to the domain underneath the inlet. As noted in connection with figures 11(d) and 11(e), and discussed further below, the concentrated wall-normal CCW vorticity that is engendered by the intensifying countercurrent flow over the wall vorticity layer and the intensified suction leads to the appearance of ground vortices that are detected at the inlet’s opening. The present investigations show that as the formation curve is first crossed at some $\dot{P}^{*}$
and H*
, the ground vortices are initially intermittent as a result of insufficient reversed flow near the wall and eventually become stationary within the ‘existence’ domain after the reversed flow surpasses a critical magnitude.
$\dot{P}^{*}$
and H*
, the ground vortices are initially intermittent as a result of insufficient reversed flow near the wall and eventually become stationary within the ‘existence’ domain after the reversed flow surpasses a critical magnitude.
Distributions of the time-averaged streamwise velocity along the cross-flow direction at y/D = –0.03 and z/D = –0.82: (a) $\dot{{P}}^{{*}}$
= 80 for H
* =
$\dot{{P}}^{{*}}$
= 80 for H
* = ![]() , and (b) H
* = 0.94 for
, and (b) H
* = 0.94 for $\dot{{P}}^{{*}}$
=
$\dot{{P}}^{{*}}$
= ![]() . The variations in H
* and
. The variations in H
* and $\dot{{P}}^{{*}}$
in (a) and (b) in reference to the ground vortex formation (threshold) boundary are shown in (c) and (d), respectively.
$\dot{{P}}^{{*}}$
in (a) and (b) in reference to the ground vortex formation (threshold) boundary are shown in (c) and (d), respectively.
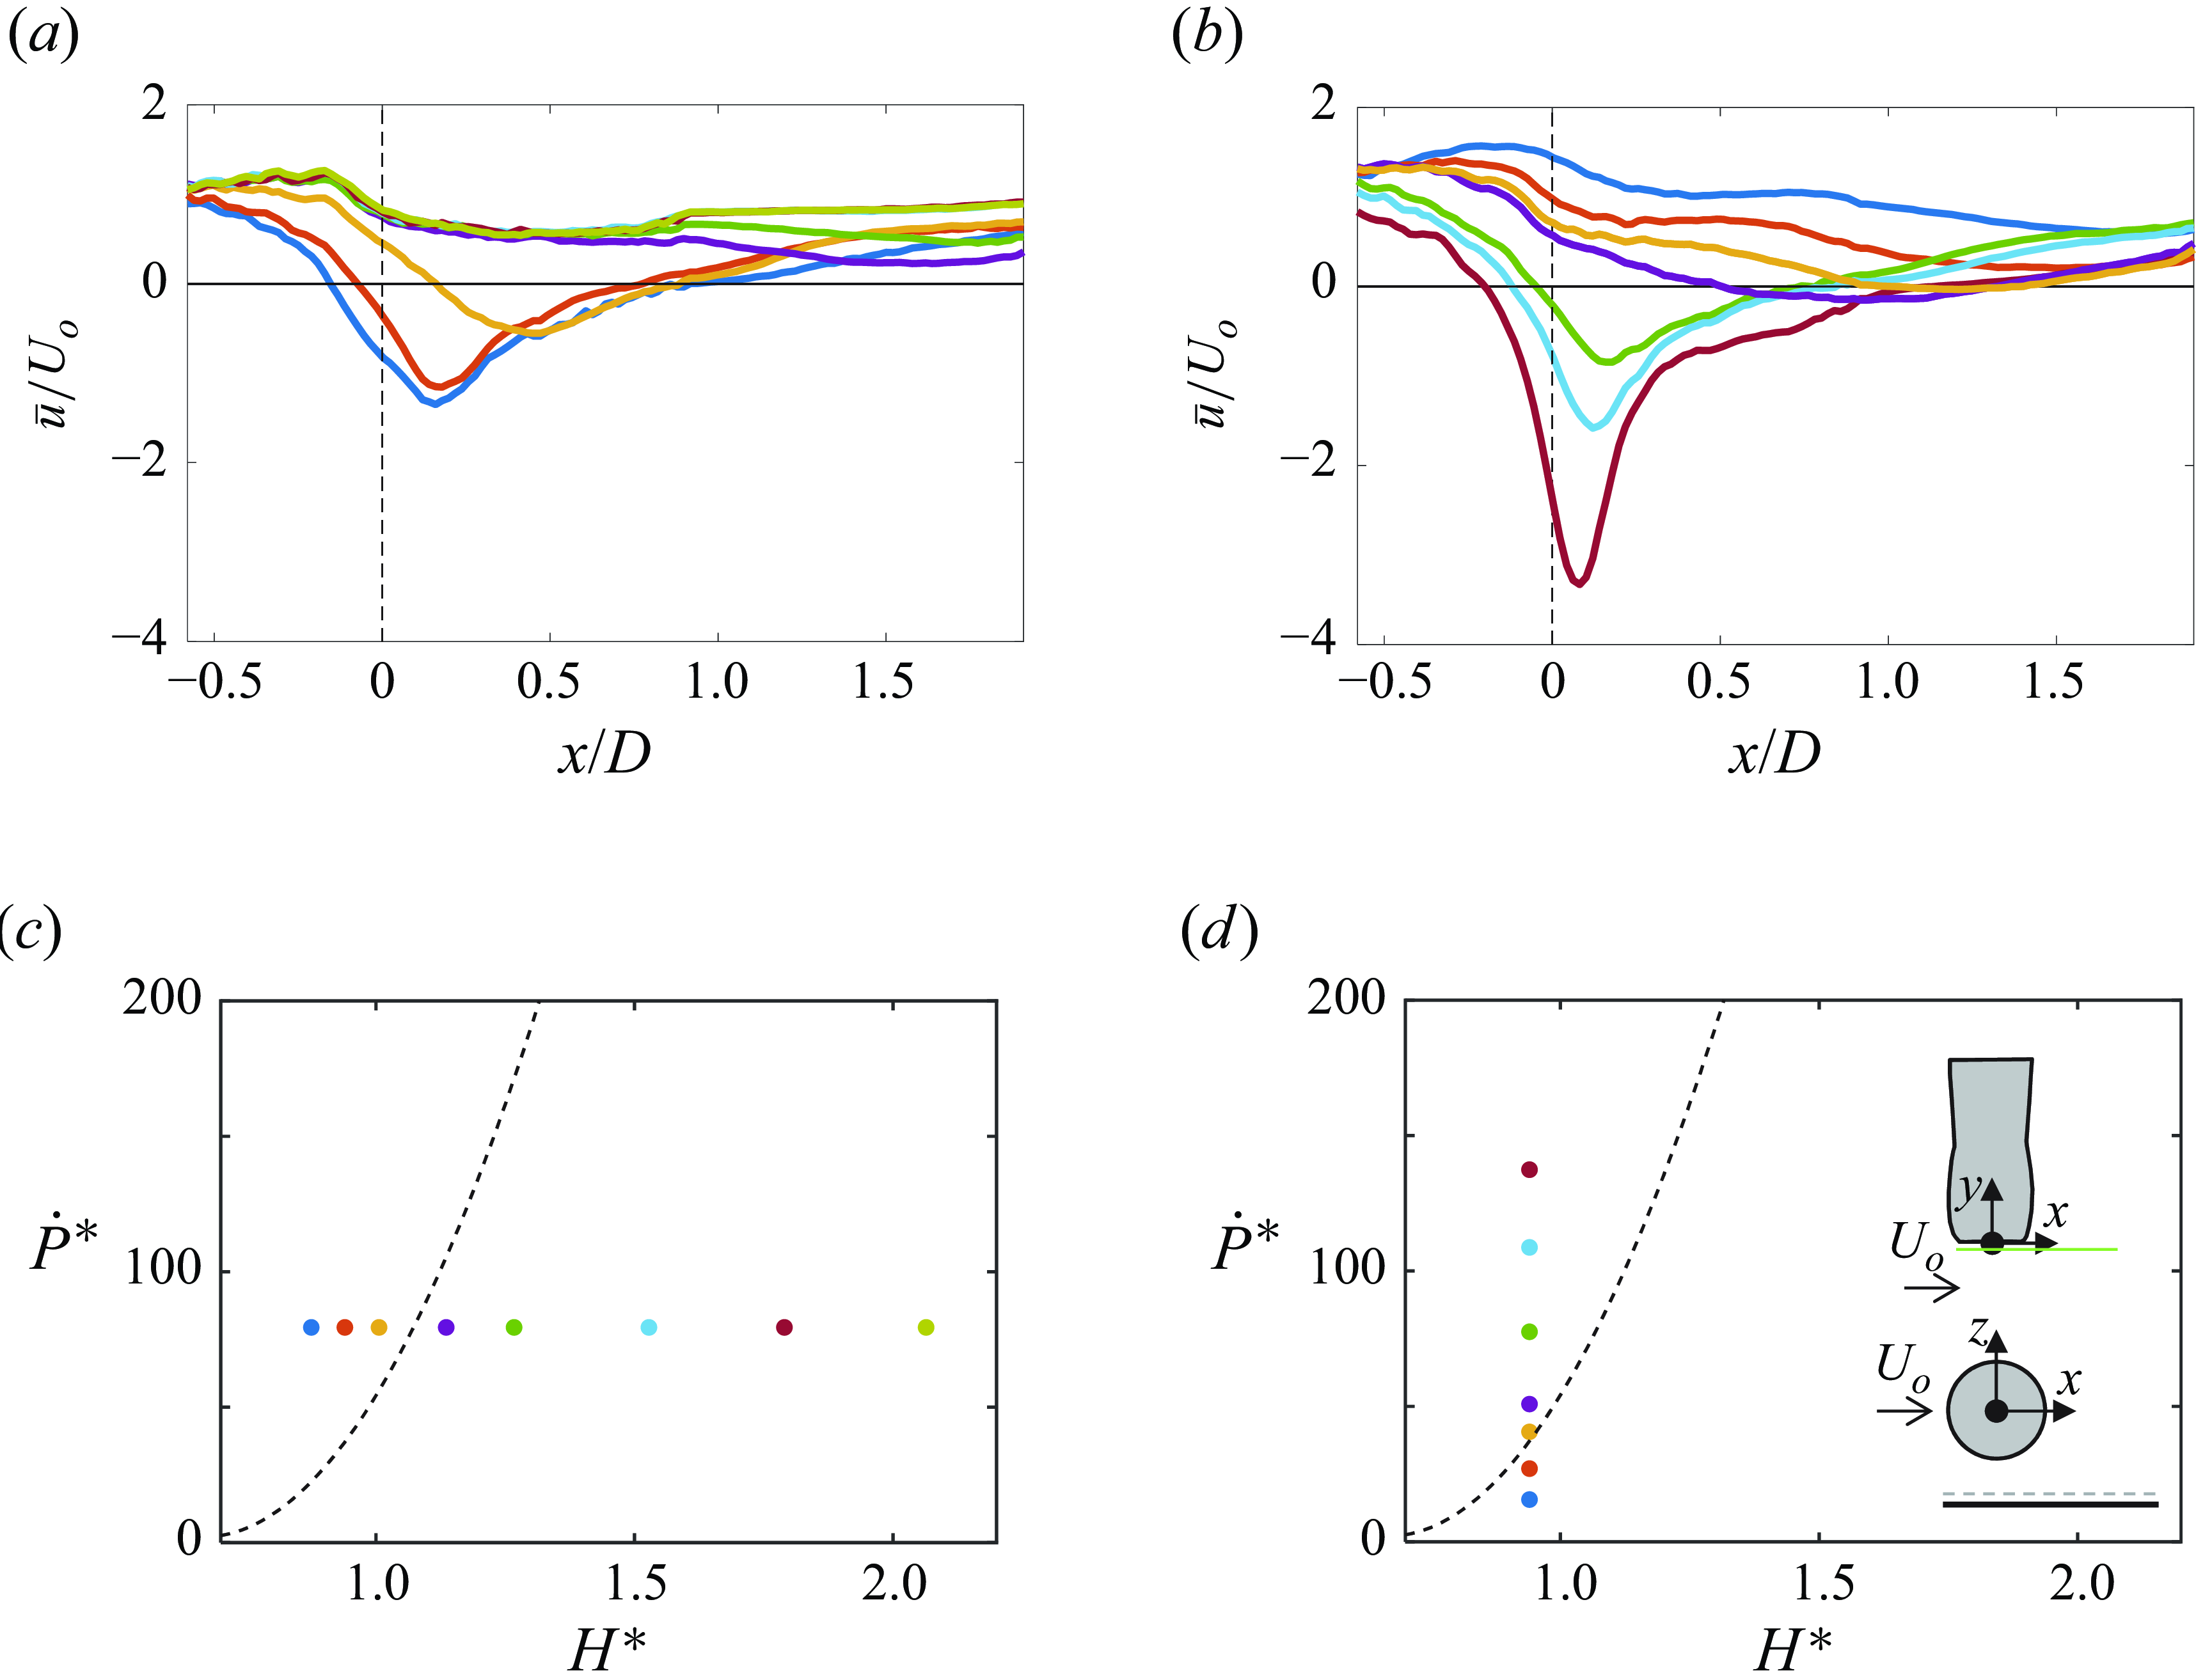
Time-averaged colour raster plot of wall-normal vorticity $ \omega $
z
overlayed with velocity vectors in the x–y plane z′/D = 0.13 at H
* = 0.94 and
$ \omega $
z
overlayed with velocity vectors in the x–y plane z′/D = 0.13 at H
* = 0.94 and $\dot{{P}}^{{*}}$
= 40. The solid line is the trace of the locus of points where the magnitudes of the velocity vectors vanish and marks the centre of the countercurrent flow.
$\dot{{P}}^{{*}}$
= 40. The solid line is the trace of the locus of points where the magnitudes of the velocity vectors vanish and marks the centre of the countercurrent flow.
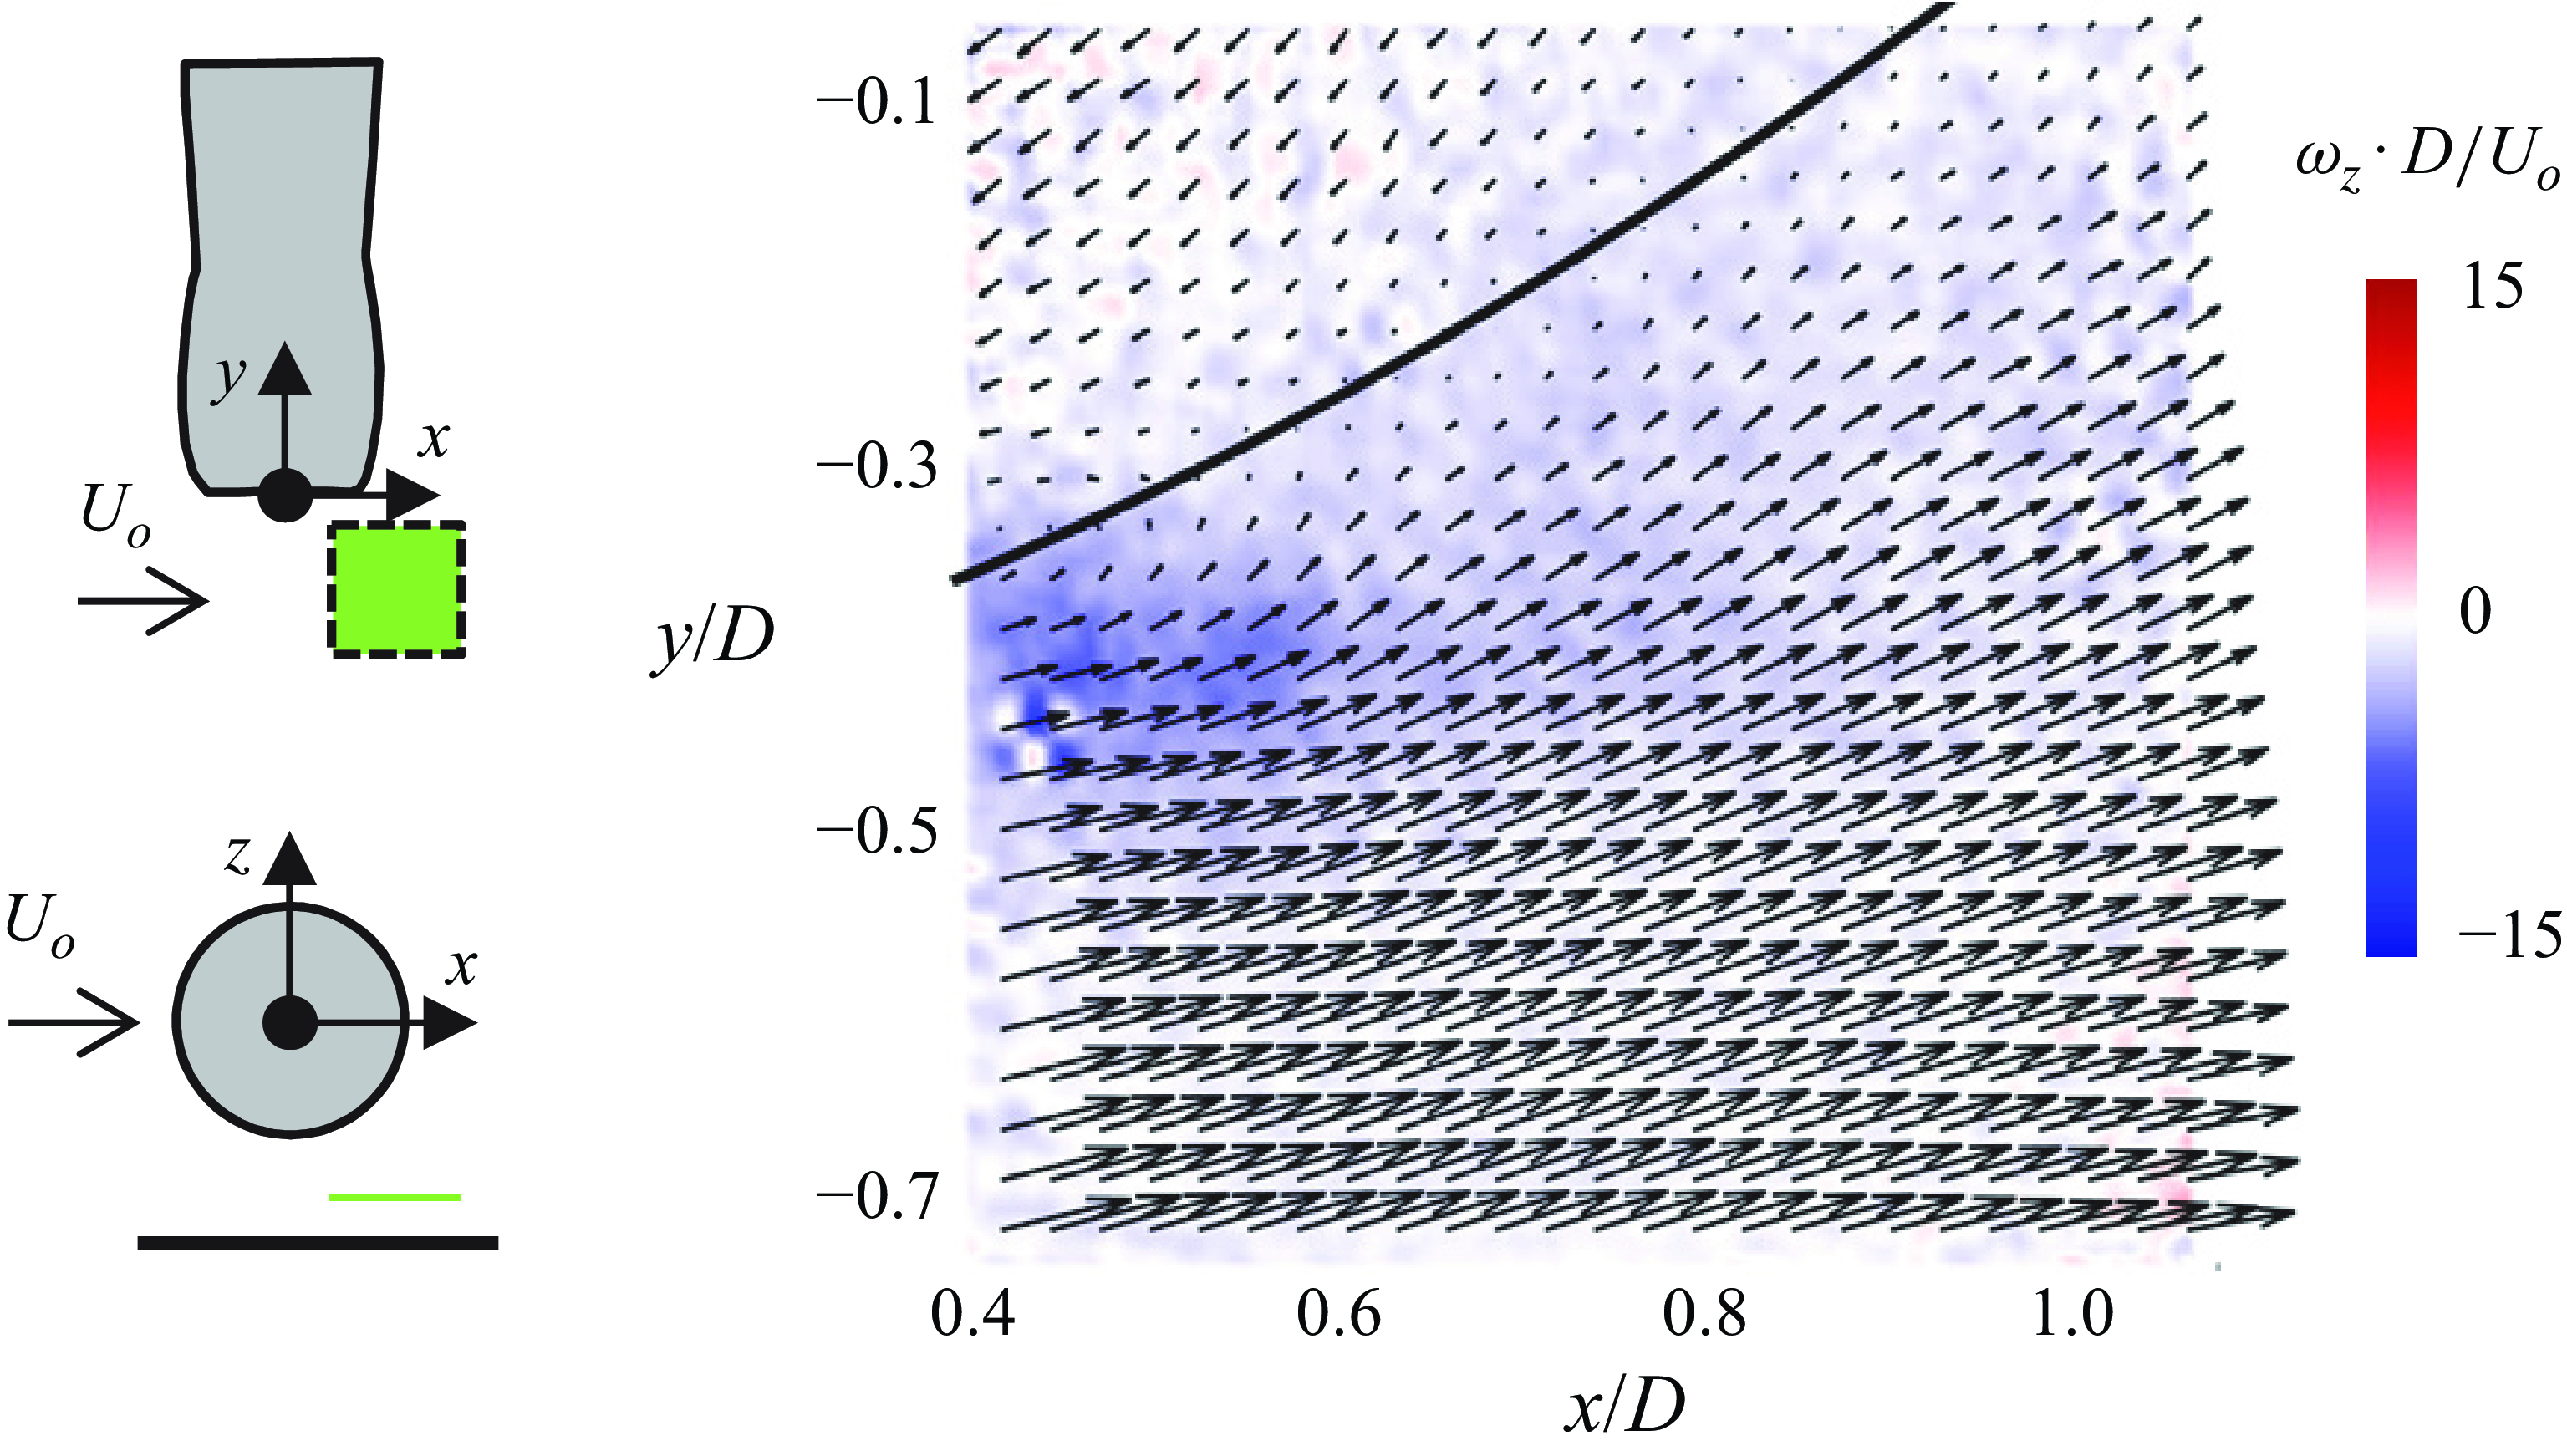
Details of the time-averaged countercurrent flow induced by the suction into the inlet near the ground plane (z
′/D = 0.13) before the formation of a stable ground vortex ( $\dot{P}^{*}$
= 40 and H*
= 0.94, similar to figure 11
c) are shown in figure 13 using a colour raster plot of the wall-normal vorticity component
$\dot{P}^{*}$
= 40 and H*
= 0.94, similar to figure 11
c) are shown in figure 13 using a colour raster plot of the wall-normal vorticity component $ \omega $
z
. These data show the extent of the domain of reversed flow that is induced by the suction and is separated from the surrounding streamwise flow driven by the cross-flow by a narrow low-level band around
$ \omega $
z
. These data show the extent of the domain of reversed flow that is induced by the suction and is separated from the surrounding streamwise flow driven by the cross-flow by a narrow low-level band around $\overline{V}$
= 0. Figure 13 also shows a trace of the locus of points where the magnitudes of the velocity vectors in this plane vanish and therefore marks the centre of the countercurrent flow in this plane. The present measurements show that CCW wall-normal vorticity concentrations nominally form in the vicinity of the centre of the countercurrent layer and are advected with the celerity of the local average velocity of the two countercurrent streams that are effected by the cross-stream and suction flows. Although the countercurrent shear flow above the ground plane is clearly complicated by the presence of the boundary layer underneath, it is postulated that these initial wall-normal vortices are formed by a Kelvin–Helmholtz-like instability of the countercurrent shear layers. Depending on whether the streamwise component of the celerity is positive or negative, these CCW vorticity concentrations would be advected either downstream with the cross-flow or upstream towards the inlet. As shown in figure 10(b), when these CCW vorticity concentrations are advected towards the inlet, they are also lifted away from the ground plane layer towards the inlet.
$\overline{V}$
= 0. Figure 13 also shows a trace of the locus of points where the magnitudes of the velocity vectors in this plane vanish and therefore marks the centre of the countercurrent flow in this plane. The present measurements show that CCW wall-normal vorticity concentrations nominally form in the vicinity of the centre of the countercurrent layer and are advected with the celerity of the local average velocity of the two countercurrent streams that are effected by the cross-stream and suction flows. Although the countercurrent shear flow above the ground plane is clearly complicated by the presence of the boundary layer underneath, it is postulated that these initial wall-normal vortices are formed by a Kelvin–Helmholtz-like instability of the countercurrent shear layers. Depending on whether the streamwise component of the celerity is positive or negative, these CCW vorticity concentrations would be advected either downstream with the cross-flow or upstream towards the inlet. As shown in figure 10(b), when these CCW vorticity concentrations are advected towards the inlet, they are also lifted away from the ground plane layer towards the inlet.
The evolution of wall-normal CCW vorticity concentrations was investigated by identifying and tracking them in successive instantaneous planar maps of wall-normal vorticity within the domain of the countercurrent flow that were acquired at 500 f.p.s. Dominant features of the wall-normal vorticity distributions were computed from instantaneous velocity fields that were reconstructed using proper orthogonal decomposition (POD) modes (e.g. Sirovich 1987; Berkooz, Holmes & Lumley Reference Berkooz, Holmes and Lumley1993) within the measurement plane to provide estimates of missing data at some isolated grid points due to instantaneous seeding non-uniformities. In addition, the use of a finite number of modes that capture most of the ‘energy’ of the flow provides an effective low-pass filter of small-scale motions and inherent noise. The reconstructed instantaneous velocity distributions are used to compute estimates of the instantaneous vorticity distributions that enable assessment of the evolution of vortical motions within the flow field that would otherwise be lost in the time-averaged data. Based on the snapshot POD decomposition approach, the reconstructed flow field is defined as $\boldsymbol{X}_{r}(t)= \langle \boldsymbol{X}\rangle + \sum _{n=1}^{nF}A_{n}(t)\cdot \boldsymbol{\varphi }_{n}$
, where
$\boldsymbol{X}_{r}(t)= \langle \boldsymbol{X}\rangle + \sum _{n=1}^{nF}A_{n}(t)\cdot \boldsymbol{\varphi }_{n}$
, where $\langle\boldsymbol{X}\rangle$
is the time-averaged state vector
$\langle\boldsymbol{X}\rangle$
is the time-averaged state vector $\boldsymbol{X}(t)$
,
$\boldsymbol{X}(t)$
, $\boldsymbol{\varphi }_{n}$
is the nth POD mode and
$\boldsymbol{\varphi }_{n}$
is the nth POD mode and $a_{n}(t)$
is the weighted time coefficient. The number of modes used in the reconstruction nF is typically based on their cumulative fraction of the total energy, where the energy fraction of each mode is defined as
$a_{n}(t)$
is the weighted time coefficient. The number of modes used in the reconstruction nF is typically based on their cumulative fraction of the total energy, where the energy fraction of each mode is defined as $E_{n}(\%25 )=({100| \lambda _{n}| ^{2}})/({\sum _{i=1}^{N}| \lambda _{i}| ^{2})}$
, and
$E_{n}(\%25 )=({100| \lambda _{n}| ^{2}})/({\sum _{i=1}^{N}| \lambda _{i}| ^{2})}$
, and $\lambda _{n}$
is the eigenvalue of the corresponding eigenvector
$\lambda _{n}$
is the eigenvalue of the corresponding eigenvector $\boldsymbol{\varphi }_{n}$
. Since the main motivation for using POD reconstruction of the instantaneous velocity fields is to capture the instantaneous vortical structures, the number of modes nF used for the reconstruction is guided by preserving the original vortical structures as represented by their total circulation, rather than by an energy fraction criterion. Although in most instances convergence of the asymptotic vortex circulation is reached for nF = 20 modes, the reconstruction was based on the most demanding cases for which nF = 40 modes were needed. Vortical structures were identified and tracked in these instantaneous POD-reconstructed vorticity distributions by using the Γ
1 criterion (e.g. Graftieaux, Michard & Grosjean Reference Graftieaux, Michard and Grosjean2001; Huang & Green Reference Huang and Green2015), where a threshold was first applied in the field for each Γ
1 to remove vorticity contributions that were past the asymptotic levelling of Γ
1. Following the application of the threshold, the centre of a vortex was determined by a standard weighted average procedure in the x–y plane to yield the coordinates of the vortex centre. The sequential POD-reconstructed vorticity maps were then used to determine locations where wall-normal vorticity concentrations appeared, further allowing the tracking of their motion in time. Figure 14(a) shows the locations at which these vortices first appeared in sequences of vorticity maps within the domain of the countercurrent flow at
$\boldsymbol{\varphi }_{n}$
. Since the main motivation for using POD reconstruction of the instantaneous velocity fields is to capture the instantaneous vortical structures, the number of modes nF used for the reconstruction is guided by preserving the original vortical structures as represented by their total circulation, rather than by an energy fraction criterion. Although in most instances convergence of the asymptotic vortex circulation is reached for nF = 20 modes, the reconstruction was based on the most demanding cases for which nF = 40 modes were needed. Vortical structures were identified and tracked in these instantaneous POD-reconstructed vorticity distributions by using the Γ
1 criterion (e.g. Graftieaux, Michard & Grosjean Reference Graftieaux, Michard and Grosjean2001; Huang & Green Reference Huang and Green2015), where a threshold was first applied in the field for each Γ
1 to remove vorticity contributions that were past the asymptotic levelling of Γ
1. Following the application of the threshold, the centre of a vortex was determined by a standard weighted average procedure in the x–y plane to yield the coordinates of the vortex centre. The sequential POD-reconstructed vorticity maps were then used to determine locations where wall-normal vorticity concentrations appeared, further allowing the tracking of their motion in time. Figure 14(a) shows the locations at which these vortices first appeared in sequences of vorticity maps within the domain of the countercurrent flow at $\dot{P}^{*}$
= 39.9, 41.2 and 43.2 all just above
$\dot{P}^{*}$
= 39.9, 41.2 and 43.2 all just above $\dot{P}_{c}^{*}$
= 38.2 (H*
= 0.94) but before a stable ground vortex is detected at the inlet’s face plane (the locations at each
$\dot{P}_{c}^{*}$
= 38.2 (H*
= 0.94) but before a stable ground vortex is detected at the inlet’s face plane (the locations at each $\dot{P}^{*}$
are colour coded). This map also includes corresponding colour-coded traces marking the centres of the time-averaged zero streamline of the countercurrent flows (cf. figure 13) that migrate into the duct across its inlet plane with increasing
$\dot{P}^{*}$
are colour coded). This map also includes corresponding colour-coded traces marking the centres of the time-averaged zero streamline of the countercurrent flows (cf. figure 13) that migrate into the duct across its inlet plane with increasing $\dot{P}^{*}$
for this ground plane elevation but before the formation of a nominally stable ground vortex. These traces show that the locations at which the vortices are first detected are clustered about the time-averaged centres of the countercurrent shear layers, and the open and closed symbols differentiate between vortices that were advected downstream with the cross-flow and upstream relative to the inlet, respectively.
$\dot{P}^{*}$
for this ground plane elevation but before the formation of a nominally stable ground vortex. These traces show that the locations at which the vortices are first detected are clustered about the time-averaged centres of the countercurrent shear layers, and the open and closed symbols differentiate between vortices that were advected downstream with the cross-flow and upstream relative to the inlet, respectively.
(a) Traces of points where the magnitudes of the velocity vectors vanish which mark the boundaries of the countercurrent flow in the plane z′/D = 0.13 at H
* = 0.94 and $\dot{{P}}^{\mathbf{*}}$
= 39.9, 41.2 and 43.2 for which
$\dot{{P}}^{\mathbf{*}}$
= 39.9, 41.2 and 43.2 for which $\dot{{P}}_{{c}}^{{*}}$
= 38.2, and the respective locations of first detections of wall-normal vorticity concentrations (based on Γ1 on lower rank POD-reconstructed flow fields) that are advected either downstream (open symbols) or upstream (solid symbols) of the cross-flow; (b) trajectories of wall-normal vorticity concentrations (at H
* = 0.94 and
$\dot{{P}}_{{c}}^{{*}}$
= 38.2, and the respective locations of first detections of wall-normal vorticity concentrations (based on Γ1 on lower rank POD-reconstructed flow fields) that are advected either downstream (open symbols) or upstream (solid symbols) of the cross-flow; (b) trajectories of wall-normal vorticity concentrations (at H
* = 0.94 and $\dot{{P}}^{{*}}$
= 39.9) that are advected downstream (
$\dot{{P}}^{{*}}$
= 39.9) that are advected downstream (![]() ) and upstream (
) and upstream (![]() ) of the cross-flow; and (c) time history of the circulation of the wall-normal vortices in (b).
) of the cross-flow; and (c) time history of the circulation of the wall-normal vortices in (b).
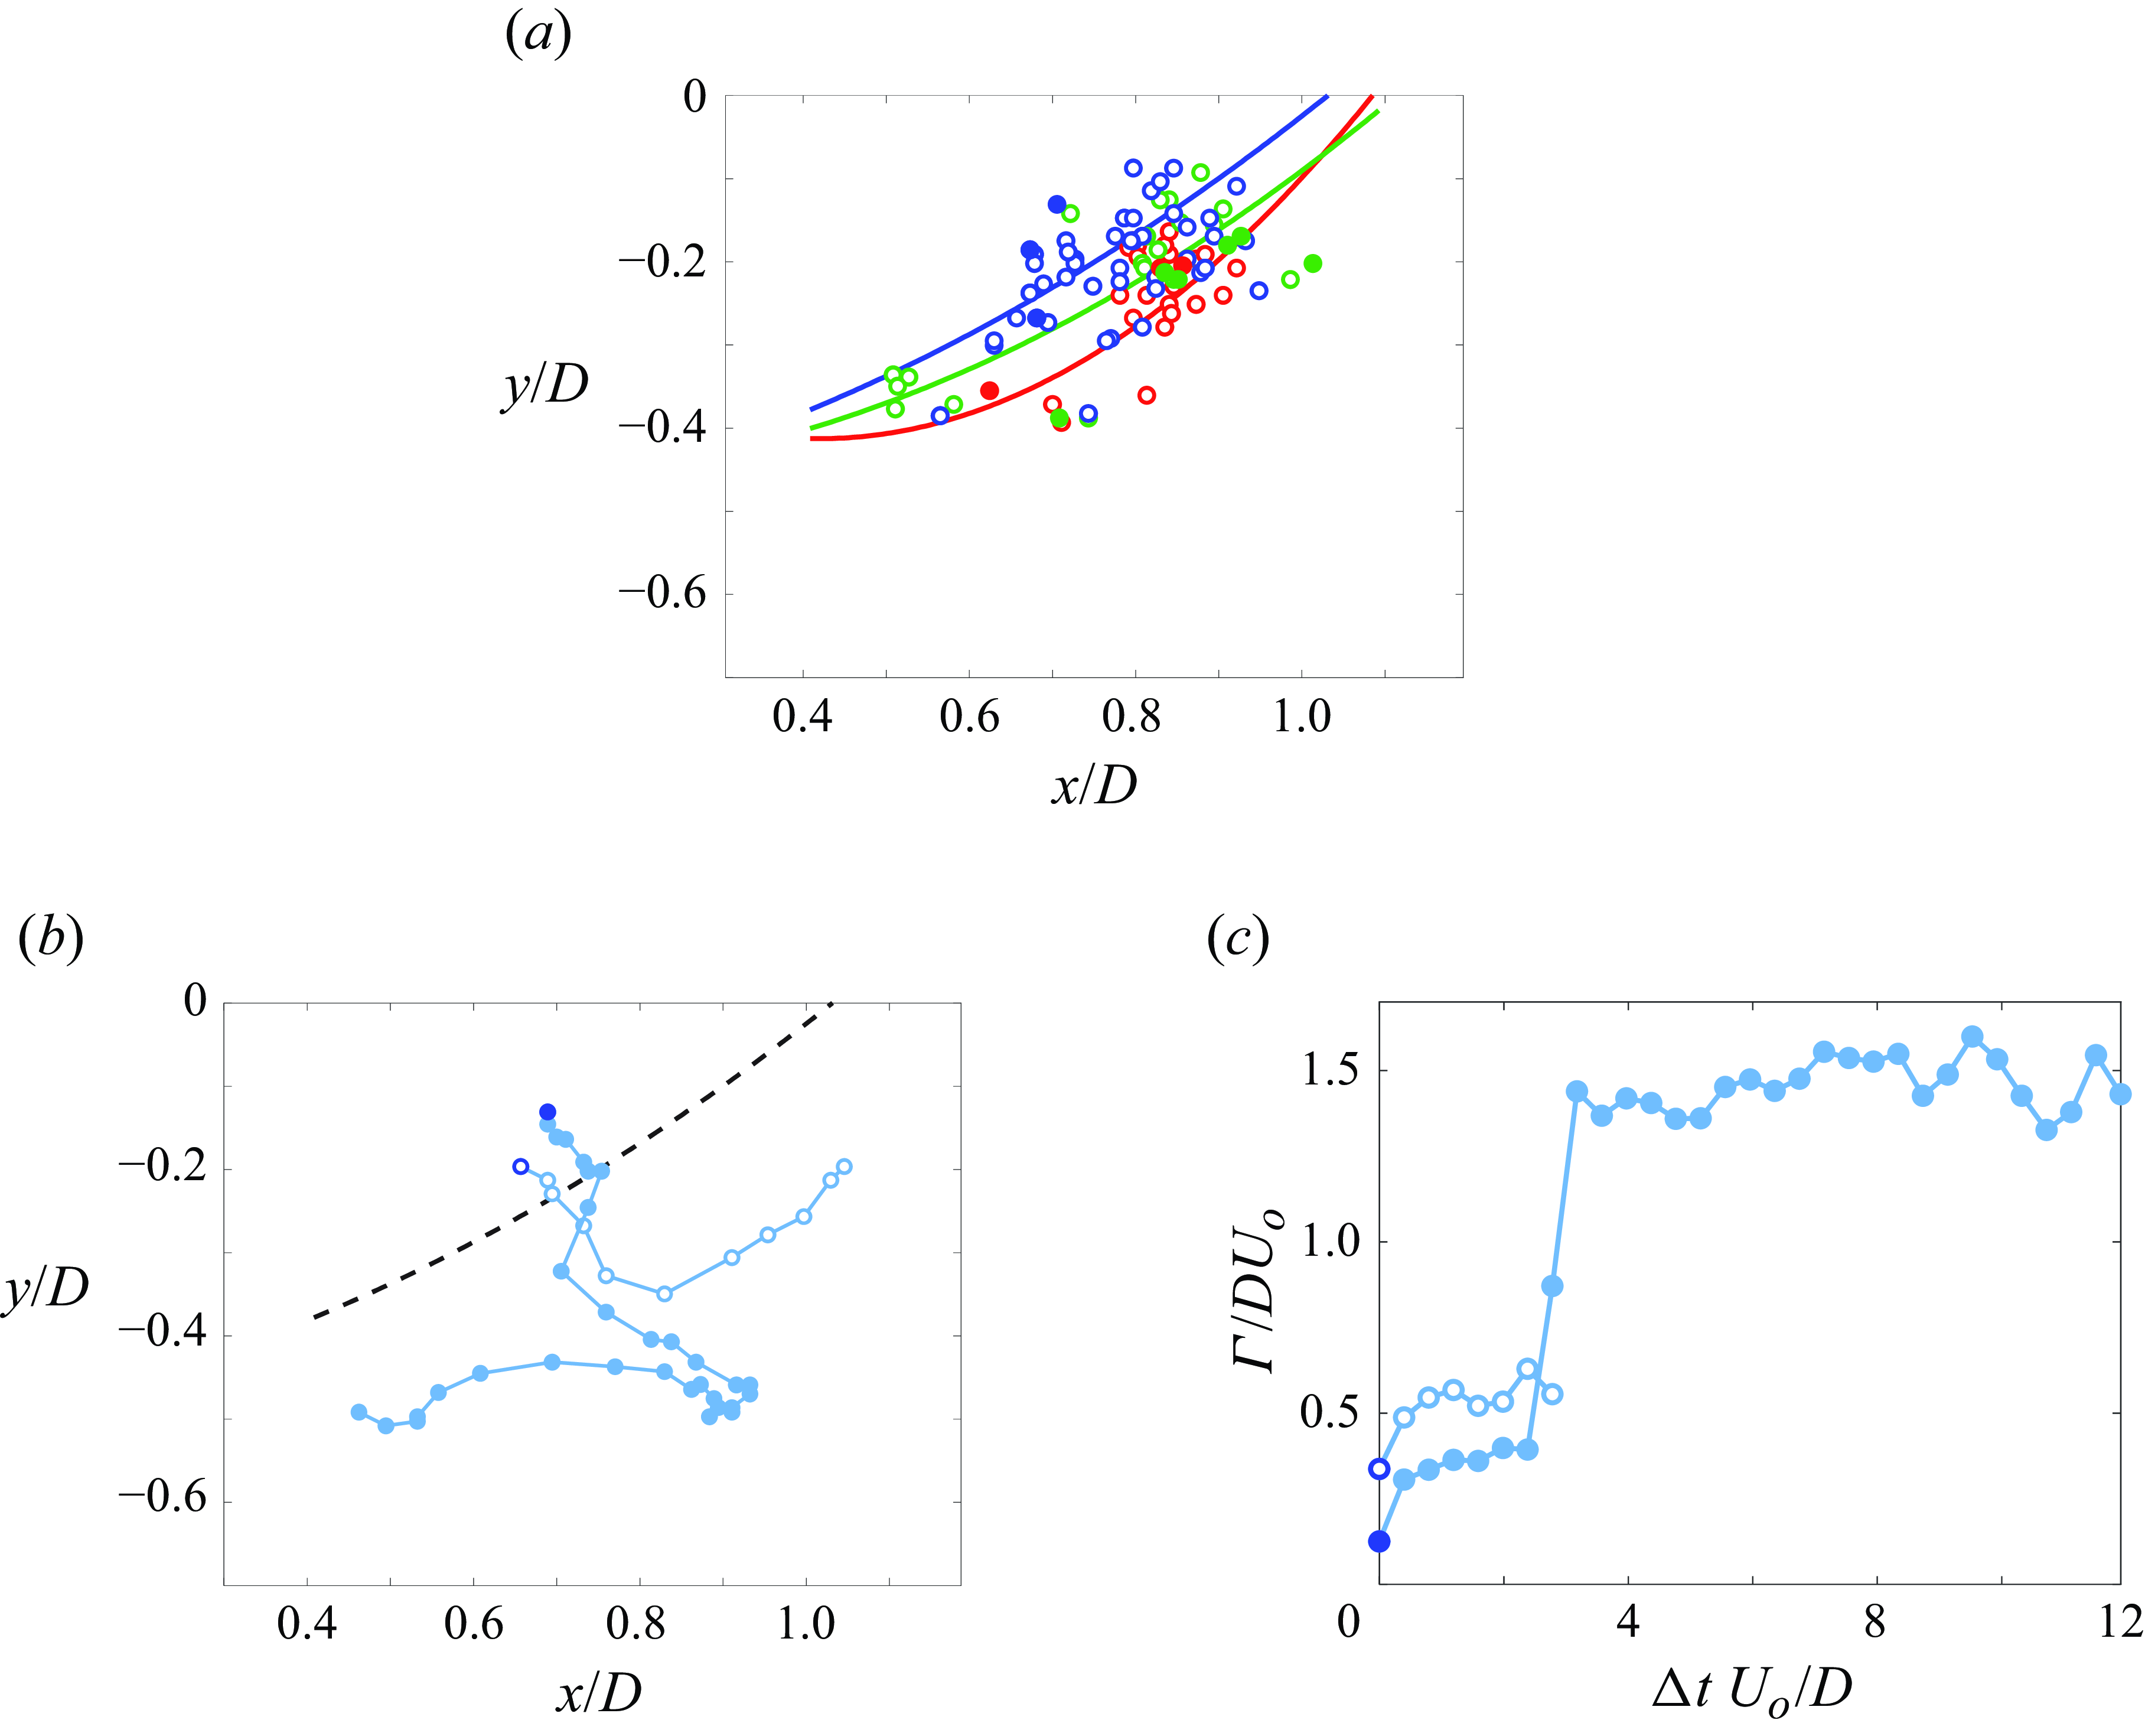
The trajectories of a downstream- and an upstream-advected vortex following their initial formation at $\dot{P}^{*}$
= 40 are shown in figure 14(b) using open and closed symbols. Both trajectories exhibit some tunnel spanwise meandering that are indicative of time-dependent variations of the countercurrent shear layers that lead to their formation; however, tunnel streamwise meandering is only observed for the vortex that is ingested into the inlet. In connection with figure 13, it should be noted that the instantaneous upstream motion of this vortex (over a period of nominally 150 ms) must occur when the countercurrent shear layer migrates in the spanwise direction away from the inlet’s entrance plane so that the wall-normal vortex is affected by the dominant upstream flow induced by the inlet’s suction. It is noted that the vortex that was advected upstream was eventually detected in the inlet’s face plane (the total pressure distribution within the inlet was recorded simultaneously with the PIV data) but did not form a persistent ground vortex.
$\dot{P}^{*}$
= 40 are shown in figure 14(b) using open and closed symbols. Both trajectories exhibit some tunnel spanwise meandering that are indicative of time-dependent variations of the countercurrent shear layers that lead to their formation; however, tunnel streamwise meandering is only observed for the vortex that is ingested into the inlet. In connection with figure 13, it should be noted that the instantaneous upstream motion of this vortex (over a period of nominally 150 ms) must occur when the countercurrent shear layer migrates in the spanwise direction away from the inlet’s entrance plane so that the wall-normal vortex is affected by the dominant upstream flow induced by the inlet’s suction. It is noted that the vortex that was advected upstream was eventually detected in the inlet’s face plane (the total pressure distribution within the inlet was recorded simultaneously with the PIV data) but did not form a persistent ground vortex.
The fundamental difference between the downstream- and upstream-advected vortices in figure 14(b) is demonstrated by computing the variation of their circulations Γ, as each was advected in the x–y plane, using the POD-reconstructed successive instantaneous velocity fields. Using the out-of-plane vorticity field, the circulation was calculated through circles of increasing radii moving outwards from the vortex centre determined in figure 14(b) until the circulation reached saturation. The variation of the circulation along each trajectory is shown in figure 14(c) at integer multiples of the time interval between image frames (5 m s). These data show that, while the circulation of the vortex that was advected upstream towards the inlet’s opening intensified along its trajectory, the circulation of the vortex that was advected downstream with the cross-flow remained significantly lower. It is interesting to note that the sharp rise in circulation of the upstream moving vortex (that is ultimately detected in the inlet) occurs when it begins to move upstream and then continues to intensify while it moves away from the inlet, indicating that the concentrations of wall-normal vorticity formed by the countercurrent flow intensify with the accumulation and turning of spanwise vorticity from the wall layer. This intensification of CCW vorticity is clearly enhanced by the countercurrent motion of the flow that leads to cancellation of wall-normal CW vorticity. As these wall-normal vortical structures intensify, the vorticity concentration within their cores is stretched along their centrelines aided by the presence of axial flow as the core is drawn by the suction towards the inlet.
5. The structure of the ground vortex
The flow field about the inlet in the presence of an anchored ground vortex (H*
= 0.94) was investigated using stereo PIV in multiple cross-stream (x–z) planes parallel to the inlet’s face plane (cf. figure 3
b) spaced at equal spanwise increments along its centreline, equal to the PIV grid spacing within each plane (i.e. Δx = Δy = Δz). These data were used to construct the 3-D time-averaged flow field within the domain: −0.58 ≤ x/D ≤ 0.82, −0.78 ≤ y/D ≤ −0.03 and −0.91 ≤ z/D ≤ −0.13. The volumetric distributions of the three velocity components are used to compute the three components of vorticity within the volume, and the vorticity magnitude is used to colour the points along each trajectory. The evolution of the 3-D flow with increasing suction is illustrated using the trajectories of particles that are ‘seeded’ on a square grid (d/D = 0.085) in the plane z
′/D = 0.083 above the ground plane and computed at equal time increments Δt = 0.0026D/U
o
, as shown in figure 15. The three velocity components and vorticity magnitude were determined at these points using linear interpolation onto the 3-D grid at each time increment. The particles advanced until reaching the bounds of the 3-D domain. For $\dot{P}^{*}$
= 23, below the vortex formation threshold (figure 15
a), the particles released at this elevation are slightly lifted off the surface by the suction flow as they are advected downstream with the cross-flow but do not enter the inlet. As the inlet momentum flux is increased to
$\dot{P}^{*}$
= 23, below the vortex formation threshold (figure 15
a), the particles released at this elevation are slightly lifted off the surface by the suction flow as they are advected downstream with the cross-flow but do not enter the inlet. As the inlet momentum flux is increased to $\dot{P}^{*}$
= 40 (just above the formation boundary), the particle trajectories in figure 15(b) are raised above the ground plane and enter the inlet along its lower leeward side. These trajectories indicate that the suction also induces upstream flow from the domain underneath and downstream of the duct’s inlet that is evident, for example, in figure 4(c). As discussed in connection with figure 13, while the countercurrent flow induced at this suction level over the ground plane underneath and downstream of the duct’s inlet spawns intermittent concentrations of wall-normal vorticity that are advected upstream and may be temporarily stretched into the inlet by the suction flow, they do not yet coalesce to form a persistent and stationary ground vortex that would be evident in the time-averaged flow field. However, when the inlet momentum flux is sufficiently high (
$\dot{P}^{*}$
= 40 (just above the formation boundary), the particle trajectories in figure 15(b) are raised above the ground plane and enter the inlet along its lower leeward side. These trajectories indicate that the suction also induces upstream flow from the domain underneath and downstream of the duct’s inlet that is evident, for example, in figure 4(c). As discussed in connection with figure 13, while the countercurrent flow induced at this suction level over the ground plane underneath and downstream of the duct’s inlet spawns intermittent concentrations of wall-normal vorticity that are advected upstream and may be temporarily stretched into the inlet by the suction flow, they do not yet coalesce to form a persistent and stationary ground vortex that would be evident in the time-averaged flow field. However, when the inlet momentum flux is sufficiently high ( $\dot{P}^{*}$
= 82), a stationary anchored ground vortex is evident in figure 15(c) whose core is enveloped by the particle trajectories that originate near the ground plane (figure 15
d). Increased particle spacing along the trajectories near the inlet face indicates increased local speed and the concurrent narrowing of the trajectories bundle indicates vortex stretching as it is ingested into the inlet. It is noted that particle trajectories within the core of the vortex in figure 15(c) originate at a lower elevation from the flow closer to the ground plane as CCW, wall-normal vorticity is advected into the core. As the vortex is stretched into the inlet, the vorticity is redistributed and pulled towards the core. Consequently, the particles originating near the ground in figure 15(d) that expand away from the surface decrease in their vorticity magnitude.
$\dot{P}^{*}$
= 82), a stationary anchored ground vortex is evident in figure 15(c) whose core is enveloped by the particle trajectories that originate near the ground plane (figure 15
d). Increased particle spacing along the trajectories near the inlet face indicates increased local speed and the concurrent narrowing of the trajectories bundle indicates vortex stretching as it is ingested into the inlet. It is noted that particle trajectories within the core of the vortex in figure 15(c) originate at a lower elevation from the flow closer to the ground plane as CCW, wall-normal vorticity is advected into the core. As the vortex is stretched into the inlet, the vorticity is redistributed and pulled towards the core. Consequently, the particles originating near the ground in figure 15(d) that expand away from the surface decrease in their vorticity magnitude.
Trajectories of particles that originate on a square grid (d/D = 0.085) within the plane z′/D = 0.083, computed at equal time increments Δt = 0.0026D/U
o
and coloured by the vorticity magnitude ζ along each trajectory for H
* = 0.94 and $\dot{{P}}^{\mathbf{*}}$
= 23 (a), 40 (b) and 82 (c). An ‘envelope’ about the centreline of the vortex core in (c) is shown in (d) using particle trajectories that originate within a subset of grid points around the core z′/D = 0.063 above the ground plane.
$\dot{{P}}^{\mathbf{*}}$
= 23 (a), 40 (b) and 82 (c). An ‘envelope’ about the centreline of the vortex core in (c) is shown in (d) using particle trajectories that originate within a subset of grid points around the core z′/D = 0.063 above the ground plane.
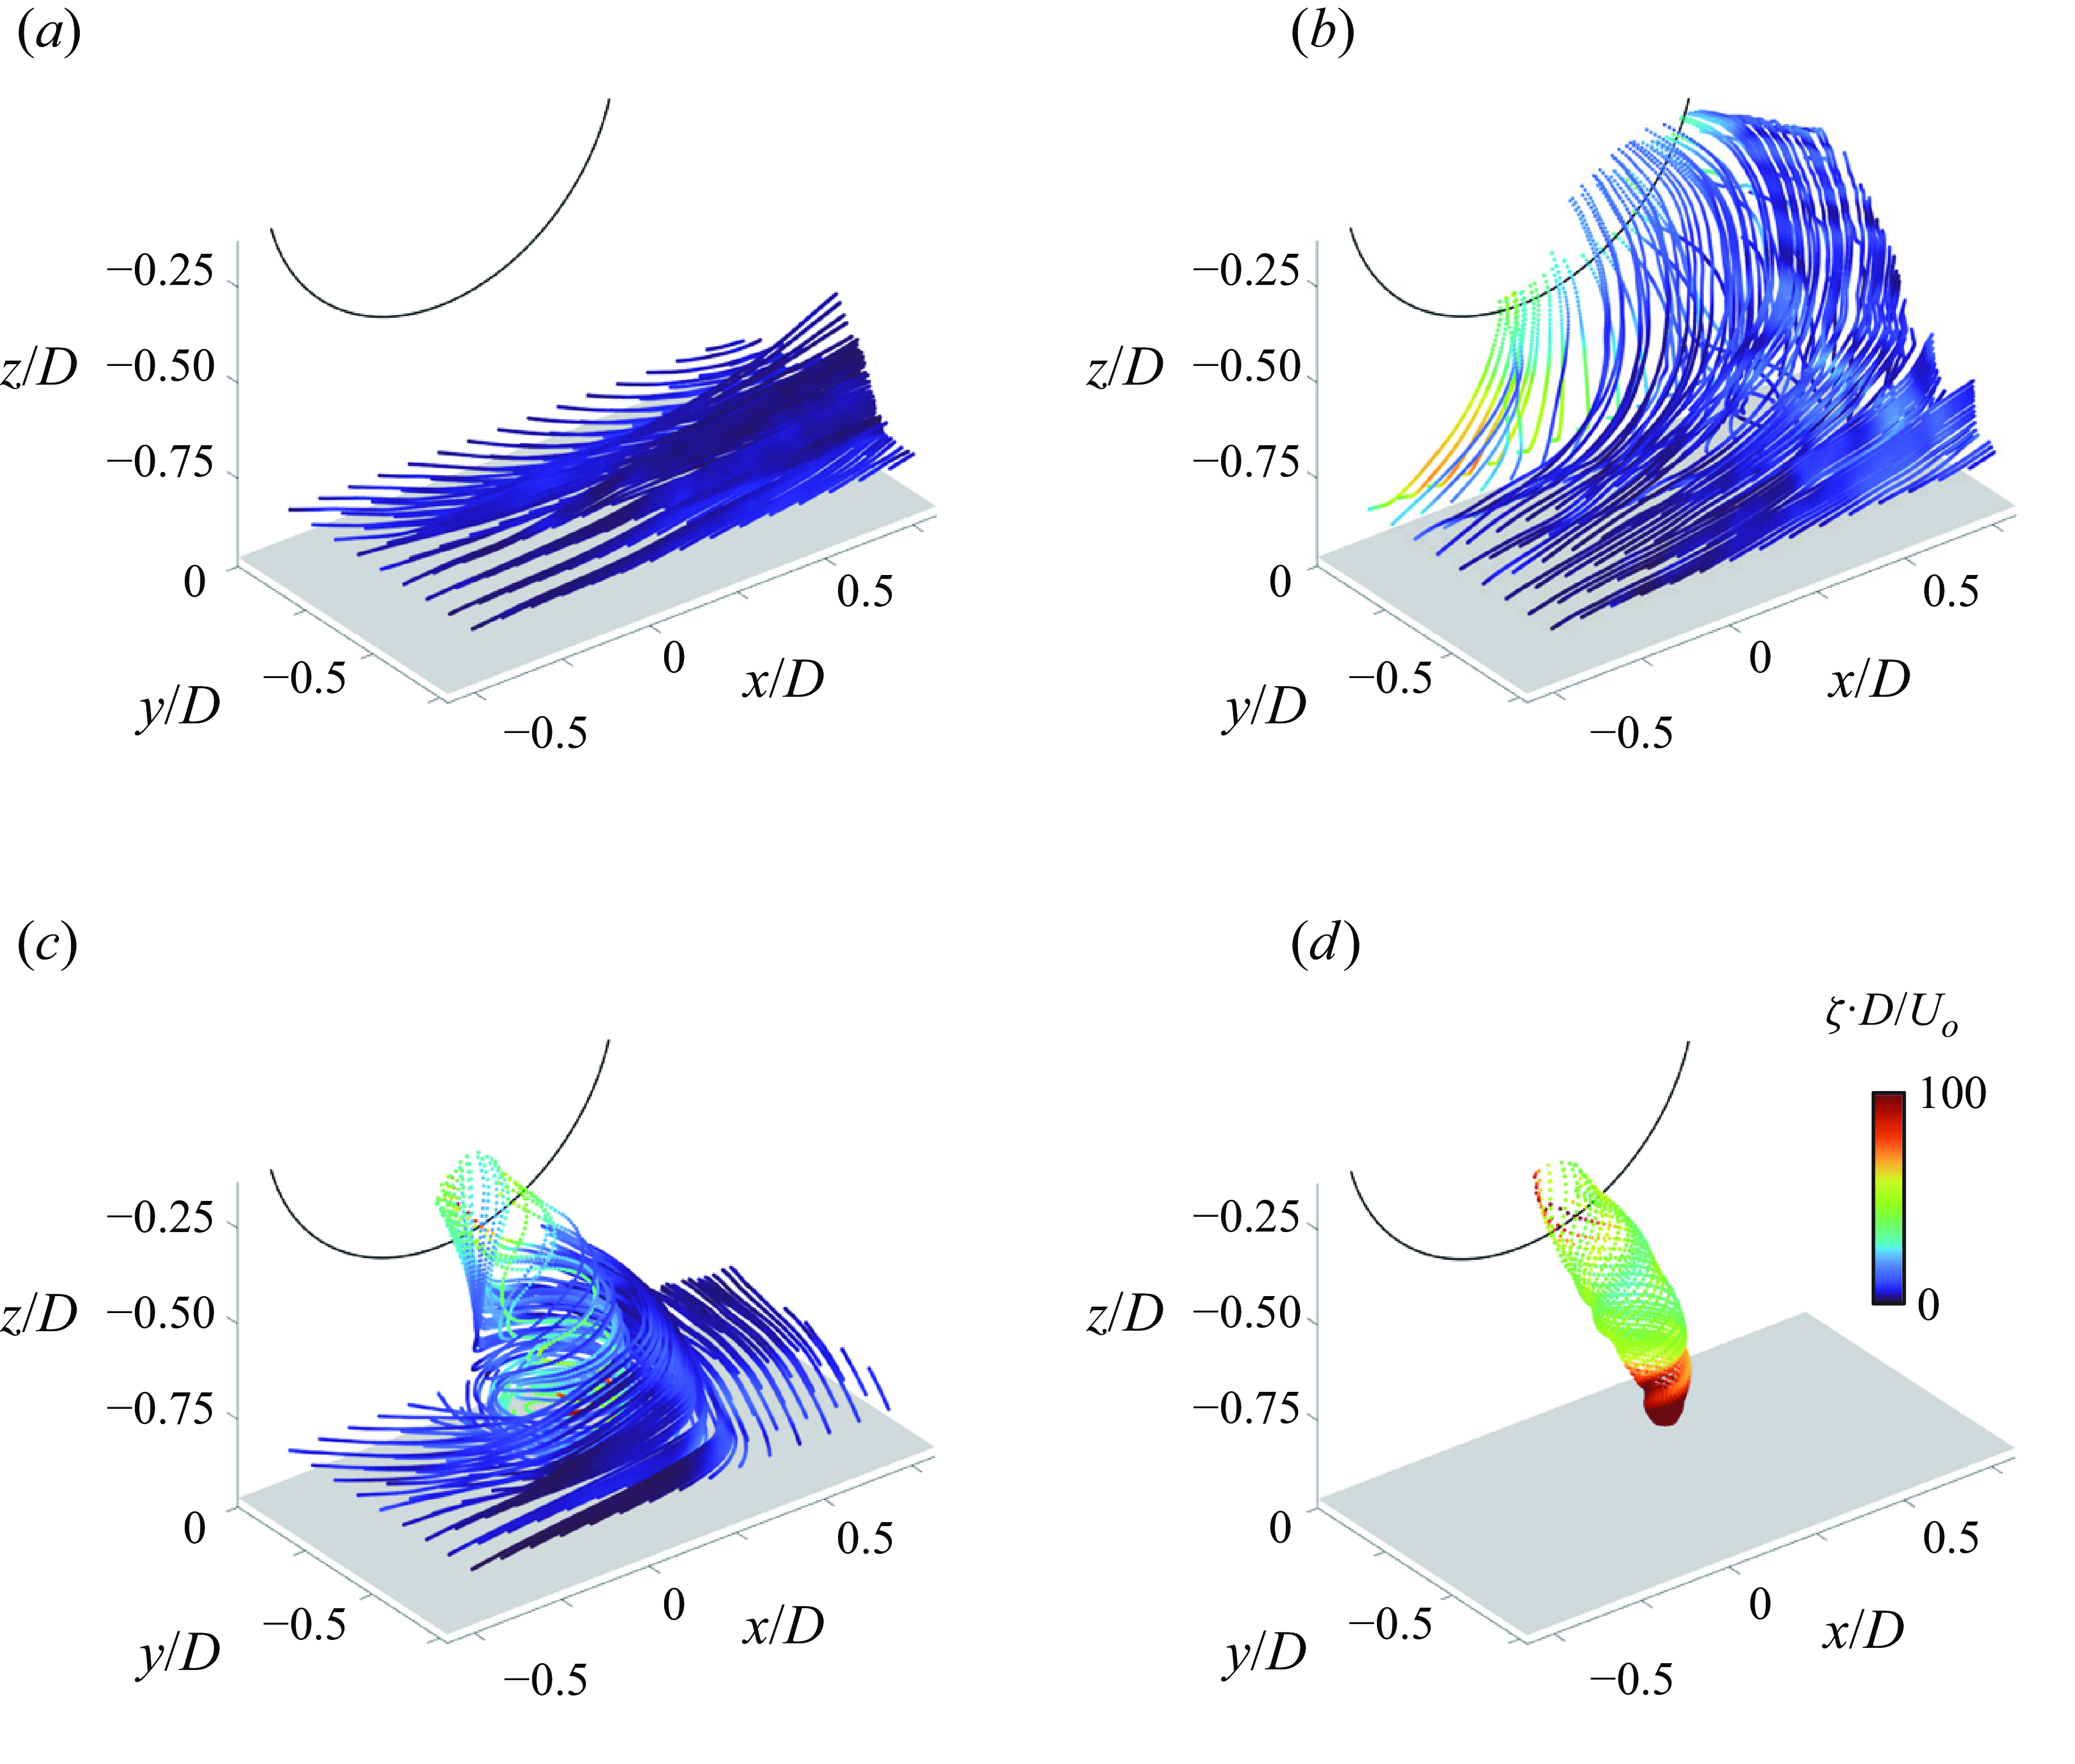
(a) Time-averaged centreline of the ground vortex (based on the Γ1 criterion) for $\dot{{P}}^{{*}}$
= 61 (
$\dot{{P}}^{{*}}$
= 61 (![]() ), 82 (
), 82 (![]() ) and 197 (
) and 197 (![]() ) (H
* = 0.94), and (b) colour raster plots of the axial vorticity distribution within equally spaced planes normal to the vortex centreline for H
* = 0.94 and
) (H
* = 0.94), and (b) colour raster plots of the axial vorticity distribution within equally spaced planes normal to the vortex centreline for H
* = 0.94 and $\dot{{P}}^{{*}}$
= 82.
$\dot{{P}}^{{*}}$
= 82.
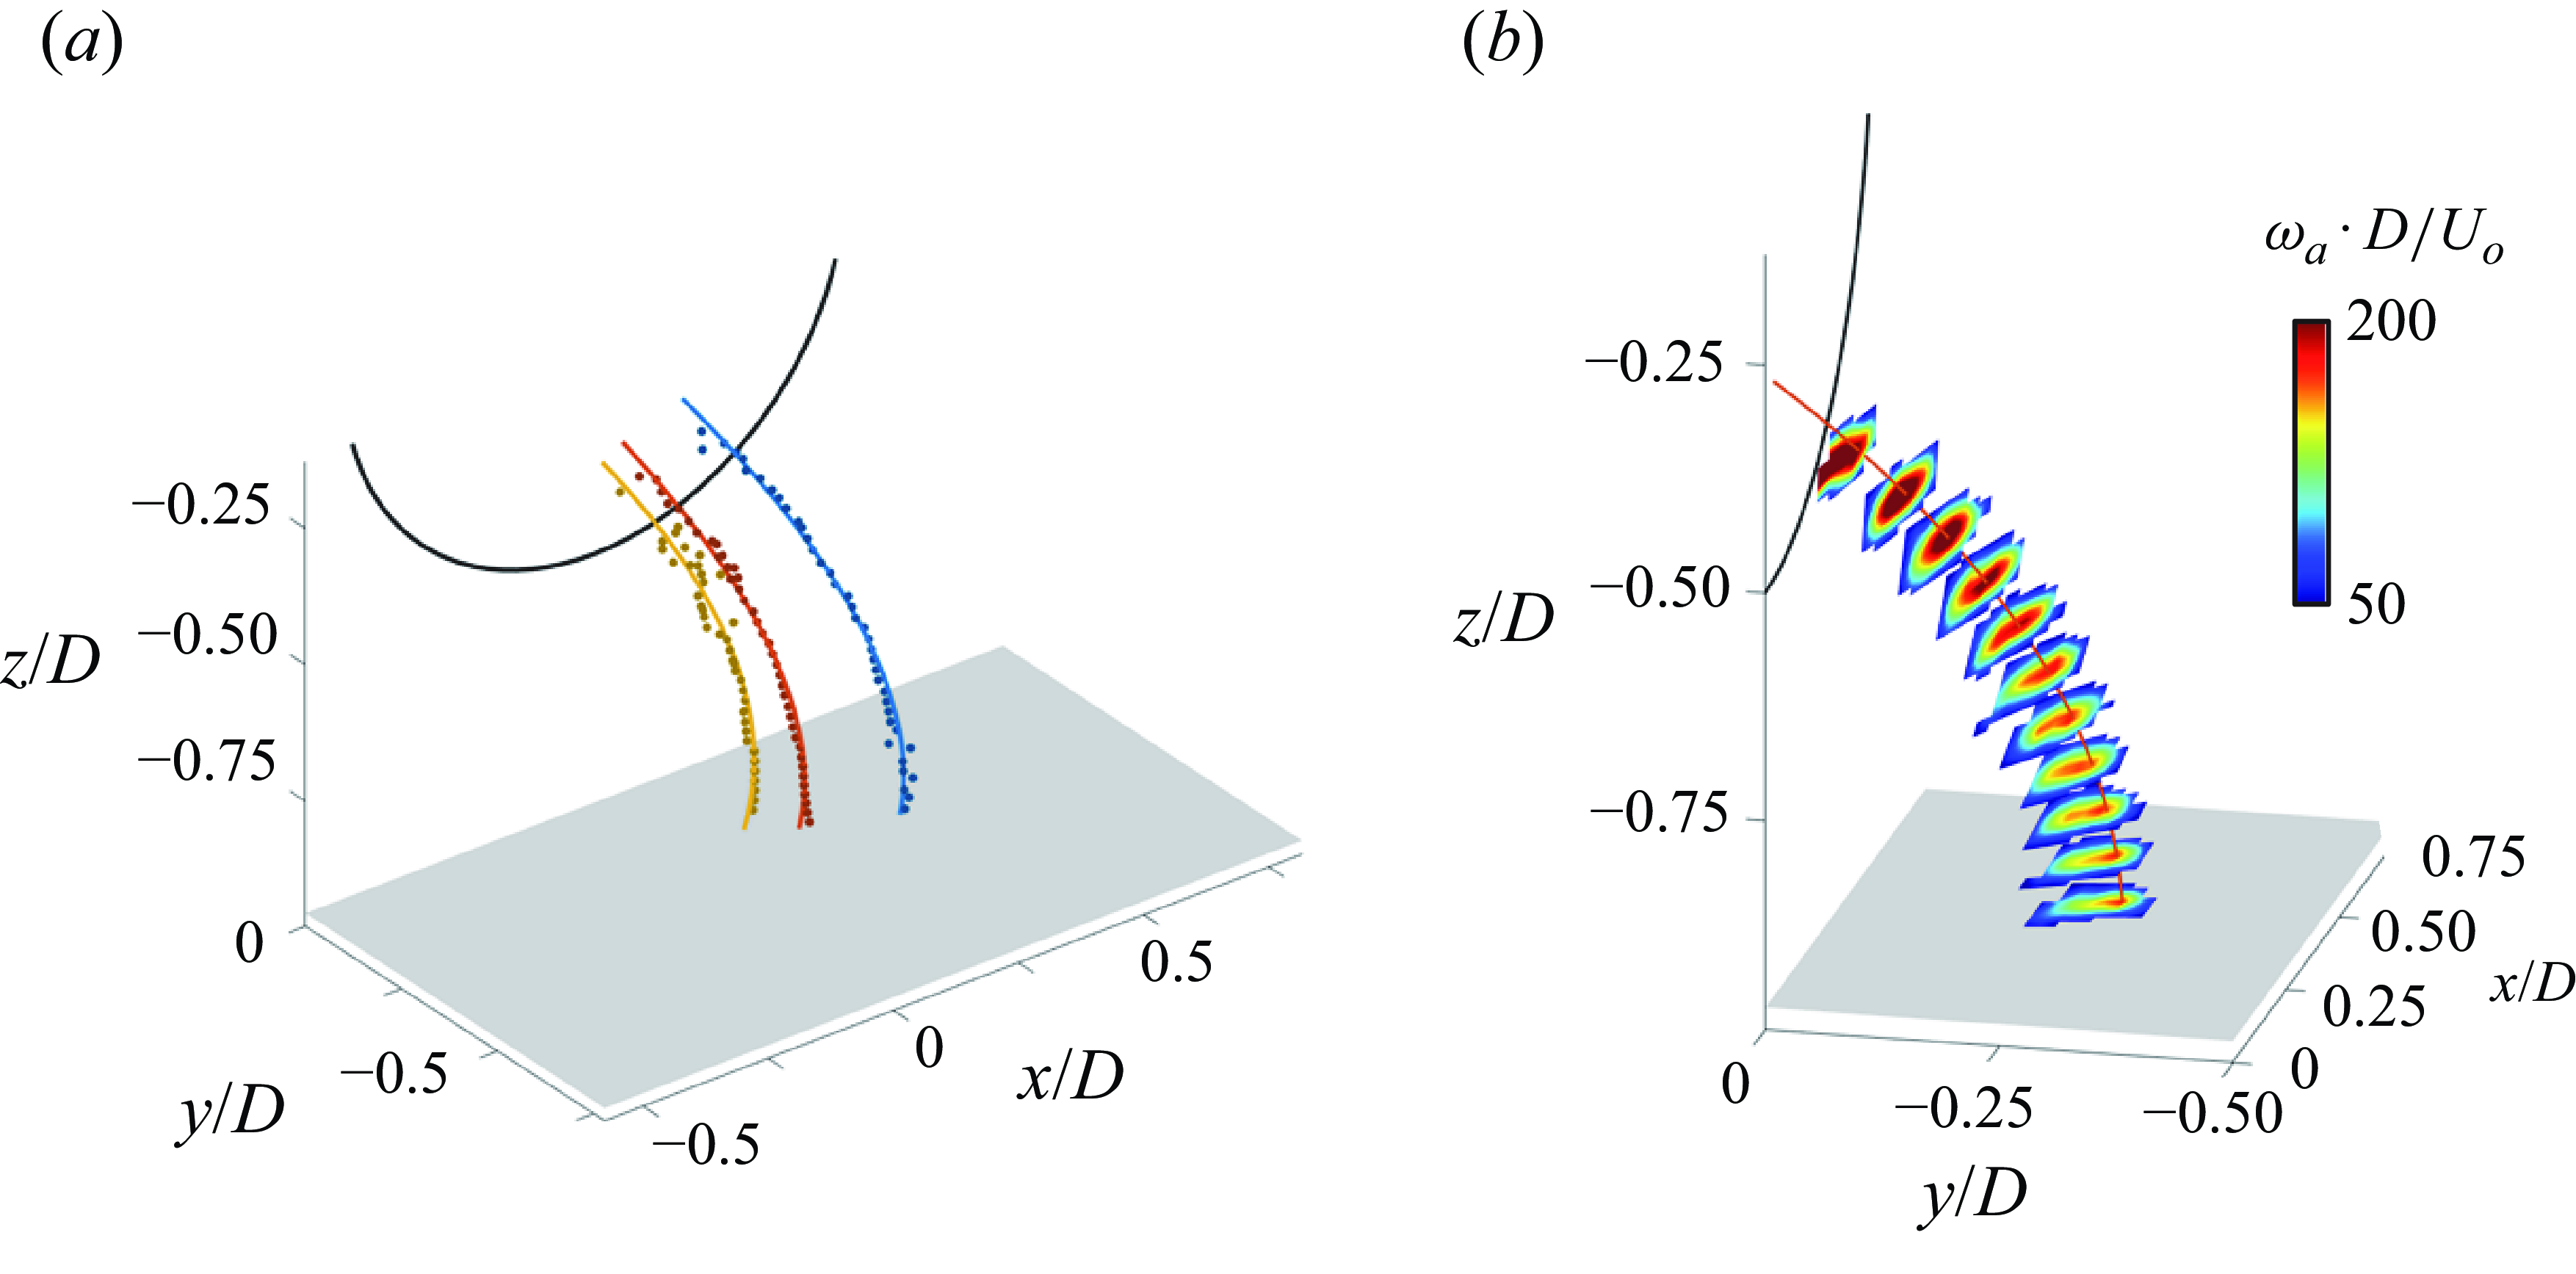
(a) Out-of-plane velocity and (b) flux of boundary layer vorticity through the plane at z′/D = 0.11, where the solid circle marks the centreline of the vortex core in figure 16 and the dashed circle marks the vortex diameter from figure 18, and (c) vorticity isosurfaces (H
* = 0.94 and $\dot{{P}}^{{*}}$
= 82) |
$\dot{{P}}^{{*}}$
= 82) | $\hat{\omega}$
x–y
D/U
o
| = 20 (
$\hat{\omega}$
x–y
D/U
o
| = 20 (![]() ) and axial vorticity within the vortex core |
) and axial vorticity within the vortex core | $ \omega $
a
D/U
o
| = 100 (
$ \omega $
a
D/U
o
| = 100 (![]() ).
).
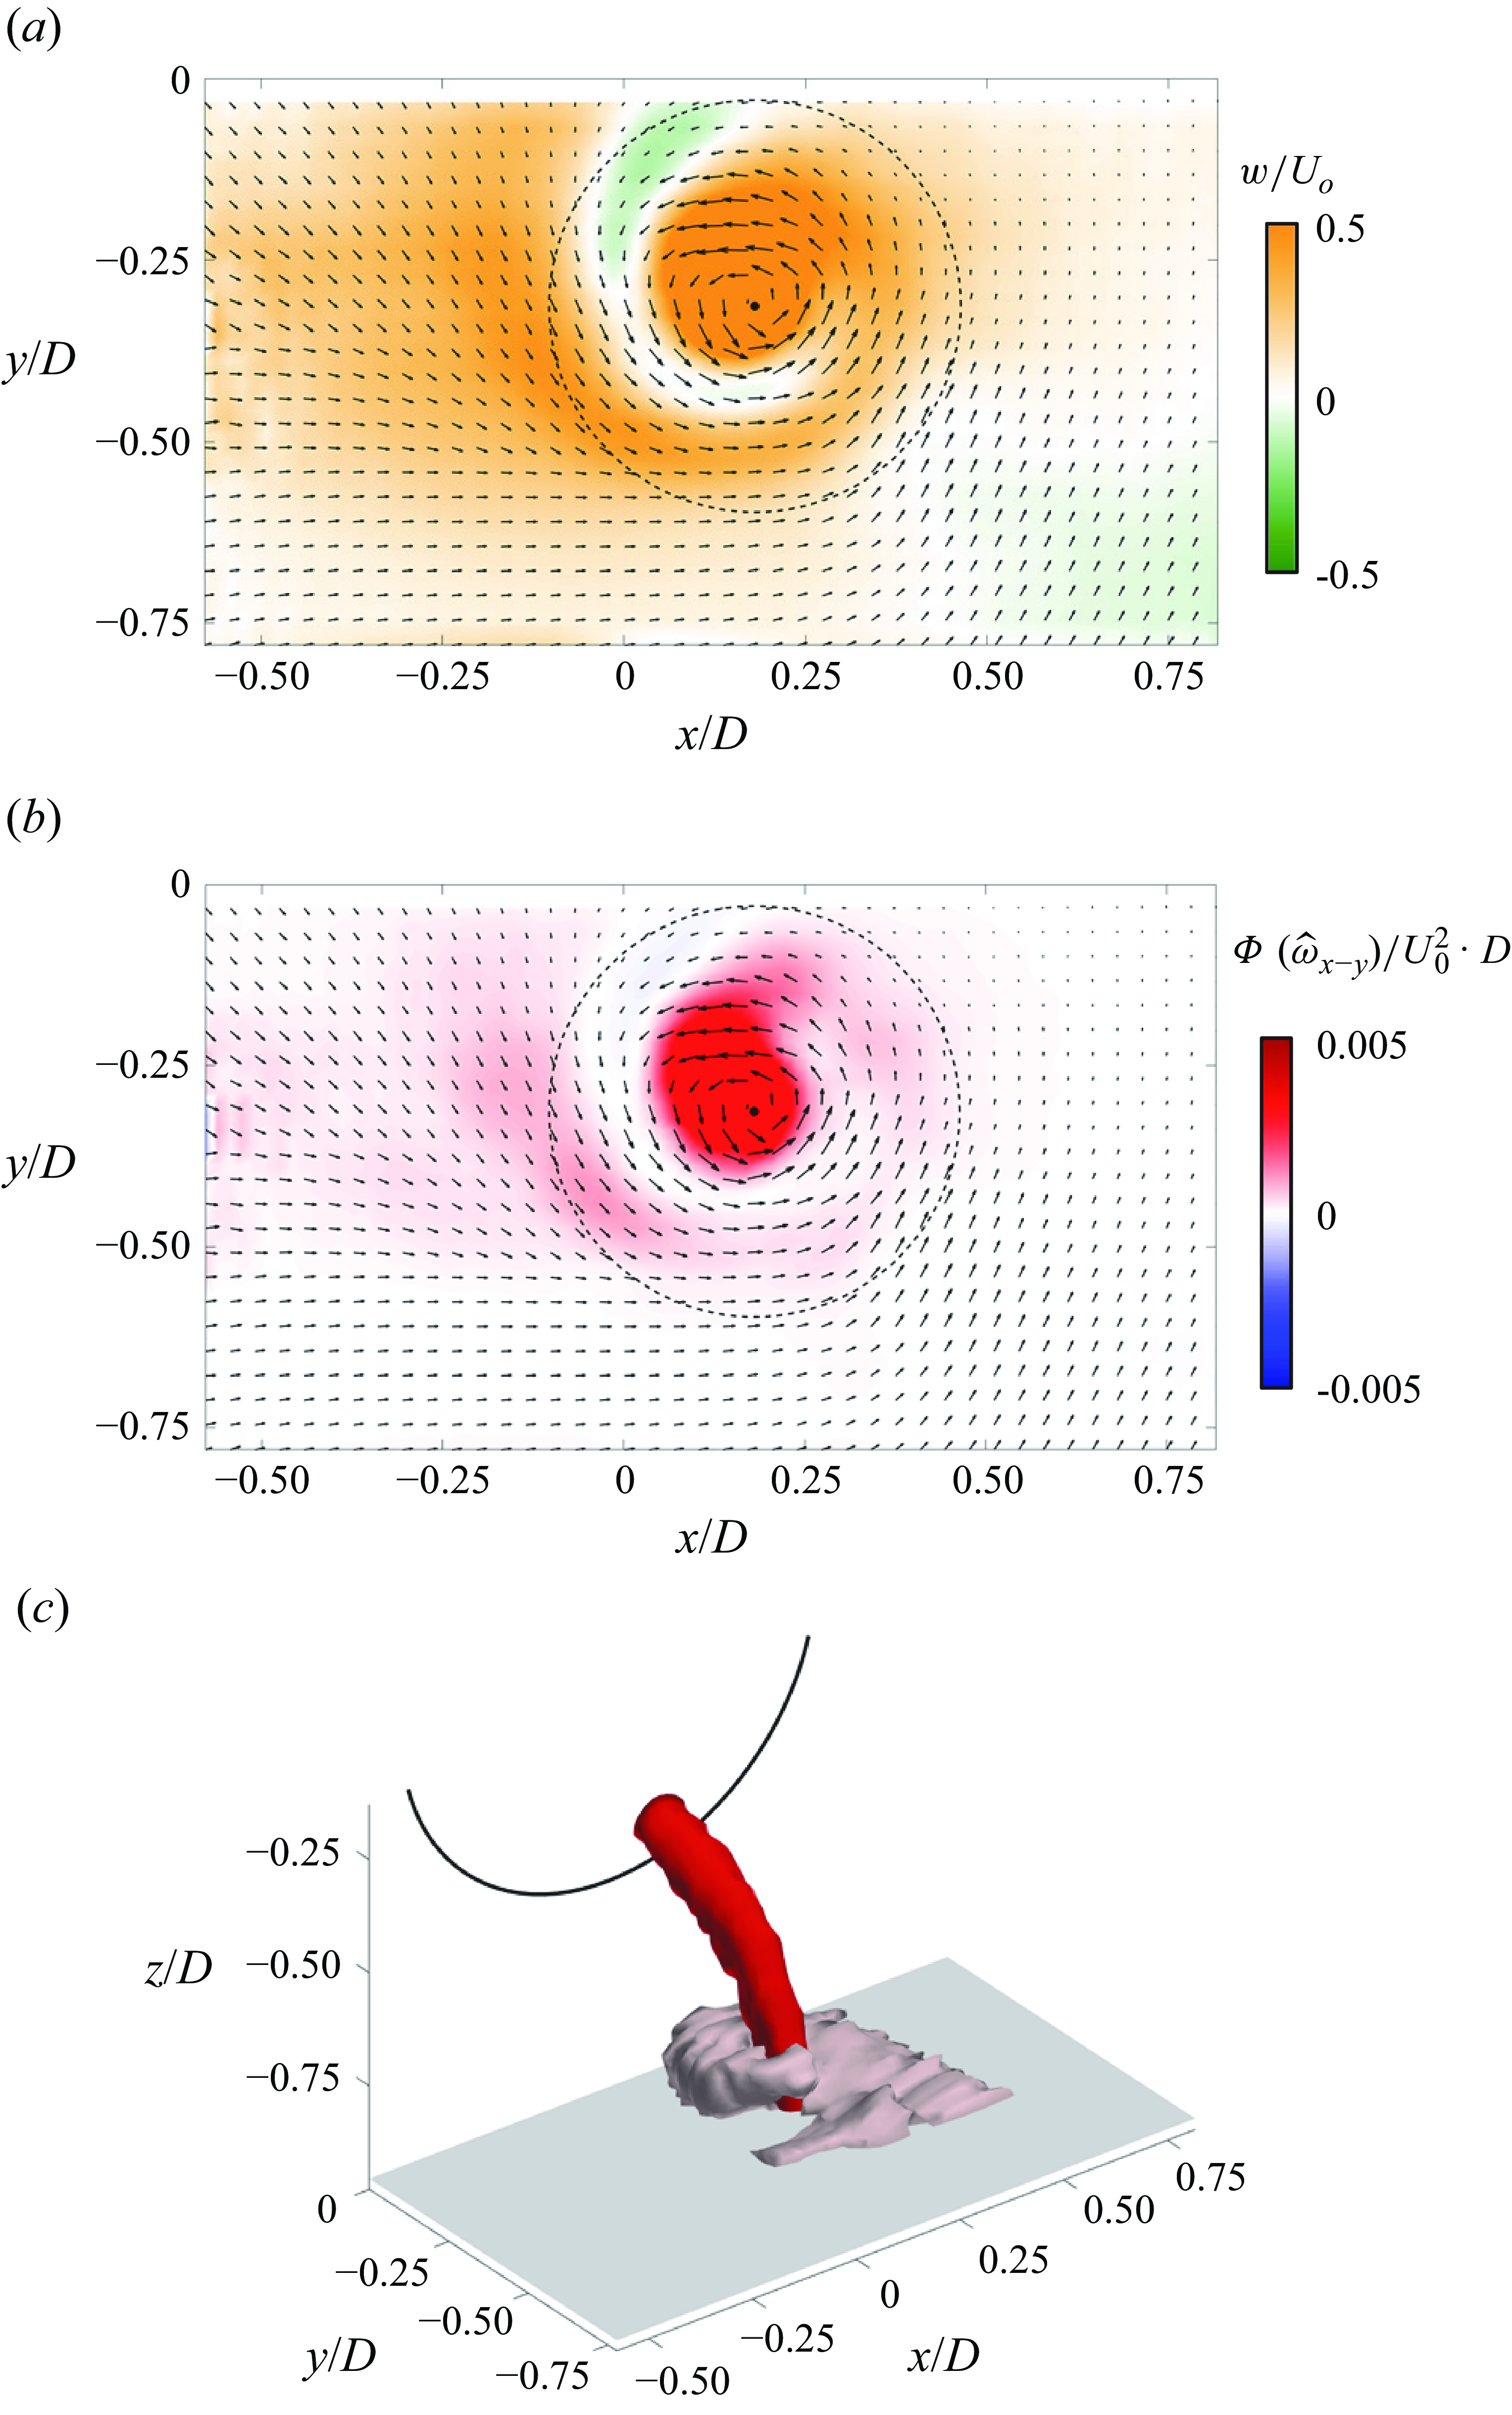
In order to assess the evolution of the axial vorticity along the centreline of a stationary ground vortex, the centre of its core was identified using the Γ
1 criterion in x–z and x–y planes that intersect the vortex using the procedure discussed in connection with figure 14(a). The centre of the vortex is assessed in each x–z and x–y plane by using an area-weighted average Γ
1 and the centreline was computed using a least-squares fit to these points between the ground plane and the inlet’s face plane. Vortex centrelines for $\dot{P}^{*}$
= 61, 82 and 197 (H*
= 0.94) in perspective views in figure 16(a) show how the ground vortex migrates upstream towards the windward side of the inlet and closer to the bottom edge of the inlet with increasing
$\dot{P}^{*}$
= 61, 82 and 197 (H*
= 0.94) in perspective views in figure 16(a) show how the ground vortex migrates upstream towards the windward side of the inlet and closer to the bottom edge of the inlet with increasing $\dot{P}^{*}$
. While these vortices are referred to as ‘stationary’ or ‘anchored’, their cores undergo temporal meandering. Analysis of the vortex core dispersion at the inlet face (not shown) indicated that they meander within small, high aspect ratio azimuthal arcs (≈ ± 5° about their centres and only approximately ± 0.004D wide radially). Furthermore, spectra of this azimuthal unsteadiness are relatively featureless with low-frequency spectral components within 0.038 < St
D
< 0.076. These Strouhal numbers are below and above the characteristic shedding Strouhal numbers of bluff bodies in cross-flow (St ≈ 0.2) and the modulating time scales in close proximity to a surface (St ≈ 0.001–0.025, Burton et al. Reference Burton, Wang, Tudball Smith, Scott, H., Crouch and Thompson.2021), respectively, suggesting that the observed frequencies may not be related to the dominant wake frequencies of the intake shell. Distributions of the three velocity components (axial and planar) and axial vorticity
$\dot{P}^{*}$
. While these vortices are referred to as ‘stationary’ or ‘anchored’, their cores undergo temporal meandering. Analysis of the vortex core dispersion at the inlet face (not shown) indicated that they meander within small, high aspect ratio azimuthal arcs (≈ ± 5° about their centres and only approximately ± 0.004D wide radially). Furthermore, spectra of this azimuthal unsteadiness are relatively featureless with low-frequency spectral components within 0.038 < St
D
< 0.076. These Strouhal numbers are below and above the characteristic shedding Strouhal numbers of bluff bodies in cross-flow (St ≈ 0.2) and the modulating time scales in close proximity to a surface (St ≈ 0.001–0.025, Burton et al. Reference Burton, Wang, Tudball Smith, Scott, H., Crouch and Thompson.2021), respectively, suggesting that the observed frequencies may not be related to the dominant wake frequencies of the intake shell. Distributions of the three velocity components (axial and planar) and axial vorticity $ \omega $
a
are extracted through the projection of the 3-D velocity distributions onto planes normal to the vortex centreline. Colour raster plots of distributions of
$ \omega $
a
are extracted through the projection of the 3-D velocity distributions onto planes normal to the vortex centreline. Colour raster plots of distributions of $ \omega $
a
in several normal planes along the vortex centreline at
$ \omega $
a
in several normal planes along the vortex centreline at $\dot{P}^{*}$
= 82 are shown in figure 16(b). These data show that the axial vorticity in the vortex core intensifies towards the inlet along the vortex axis and reaches a peak level of
$\dot{P}^{*}$
= 82 are shown in figure 16(b). These data show that the axial vorticity in the vortex core intensifies towards the inlet along the vortex axis and reaches a peak level of $ \omega $
a
D/U
o
≈ 250 compared with the peak of the wall-normal vorticity
$ \omega $
a
D/U
o
≈ 250 compared with the peak of the wall-normal vorticity $ \omega $
z
D/U
o
≈ 150 as a result of the stretching of the core and the reduction in its cross-section. The transport of streamwise and spanwise vorticity concentrations
$ \omega $
z
D/U
o
≈ 150 as a result of the stretching of the core and the reduction in its cross-section. The transport of streamwise and spanwise vorticity concentrations $ \omega $
x
and
$ \omega $
x
and $ \omega $
y
from the surface vorticity layer that sustain the ground vortex (cf. figures 15
c and 16
b) is depicted by considering the flux of the in-plane vorticity vector
$ \omega $
y
from the surface vorticity layer that sustain the ground vortex (cf. figures 15
c and 16
b) is depicted by considering the flux of the in-plane vorticity vector $\boldsymbol{\omega }_{x-y}$
through some plane z
′ = const above the surface. A colour raster plot of the time-averaged wall-normal velocity component w(x,y) through the plane z′/D = 0.11 (figure 17
a) shows the effect of the suction and, in particular, the counterclockwise swirl associated with the ground vortex when viewed from this orientation. These data show that w(x,y) is predominantly positive with the exception of weak domain of w(x,y) < 0 within the vortex braid (the centre of the ground vortex core in figure 16 and the outer edge of the vortex core extracted from figure 18 are also shown for reference). Vertical transport of in-plane vorticity is depicted using the flux of the magnitude of
$\boldsymbol{\omega }_{x-y}$
through some plane z
′ = const above the surface. A colour raster plot of the time-averaged wall-normal velocity component w(x,y) through the plane z′/D = 0.11 (figure 17
a) shows the effect of the suction and, in particular, the counterclockwise swirl associated with the ground vortex when viewed from this orientation. These data show that w(x,y) is predominantly positive with the exception of weak domain of w(x,y) < 0 within the vortex braid (the centre of the ground vortex core in figure 16 and the outer edge of the vortex core extracted from figure 18 are also shown for reference). Vertical transport of in-plane vorticity is depicted using the flux of the magnitude of $\boldsymbol{\omega }_{x-y}$
,
$\boldsymbol{\omega }_{x-y}$
, $\hat{\omega }$
x–y
= (
$\hat{\omega }$
x–y
= ( $ \omega $
x
2 +
$ \omega $
x
2 + $ \omega $
y
2)0.5 through a plane z′
= const given by
$ \omega $
y
2)0.5 through a plane z′
= const given by ${\unicode[Arial]{x03A6}} (\hat{\omega }_{{x}-{y}})=\iint W\cdot \hat{\omega }_{x-y}$
dx·dy. Figure 17(b) is a colour raster plot of
${\unicode[Arial]{x03A6}} (\hat{\omega }_{{x}-{y}})=\iint W\cdot \hat{\omega }_{x-y}$
dx·dy. Figure 17(b) is a colour raster plot of ${\unicode[Arial]{x03A6}} (\hat{\omega }_{{x}-{y}})$
through z′/D = 0.11 superposed with in-plane velocity vectors along with the centre and outer edge of the ground vortex core for reference. These data show that the induced radial flow towards the centre of the vortex advects and accumulates
${\unicode[Arial]{x03A6}} (\hat{\omega }_{{x}-{y}})$
through z′/D = 0.11 superposed with in-plane velocity vectors along with the centre and outer edge of the ground vortex core for reference. These data show that the induced radial flow towards the centre of the vortex advects and accumulates $ \omega $
x
and
$ \omega $
x
and $ \omega $
y
about the core that, as discussed in connection with figure 13, are tilted by the rotation and cross-stream shear to form wall-normal vorticity that is transported along the vortex core by the axial velocity associated with the suction. Outside of the footprint of the ground vortex, the magnitudes of
$ \omega $
y
about the core that, as discussed in connection with figure 13, are tilted by the rotation and cross-stream shear to form wall-normal vorticity that is transported along the vortex core by the axial velocity associated with the suction. Outside of the footprint of the ground vortex, the magnitudes of $ \omega $
x
and
$ \omega $
x
and $ \omega $
y
are significantly smaller. The 3-D structure of the ensuing vorticity distributions is elucidated in figure 17(c) with an isosurface of
$ \omega $
y
are significantly smaller. The 3-D structure of the ensuing vorticity distributions is elucidated in figure 17(c) with an isosurface of $\hat{\omega }$
x–y
D/U
o
= 20 in the vicinity of the vortex root above the wall and a corresponding isosurface of the axial vorticity
$\hat{\omega }$
x–y
D/U
o
= 20 in the vicinity of the vortex root above the wall and a corresponding isosurface of the axial vorticity $ \omega $
a
D/U
o
= 100 within the vortex core. Based on this discussion, it is argued that the ground vortex is sustained by tilting, stretching and entrainment of the surface layer vorticity.
$ \omega $
a
D/U
o
= 100 within the vortex core. Based on this discussion, it is argued that the ground vortex is sustained by tilting, stretching and entrainment of the surface layer vorticity.
Variation along the vortex core (with elevation above the surface) of the vortex circulation (a), radius (b) and axial flow rate (c) for H
* = 0.94 and $\dot{{P}}^{{*}}$
= 61 (
$\dot{{P}}^{{*}}$
= 61 (![]() ), 82 (
), 82 (![]() ) and 197 (
) and 197 (![]() ).
).
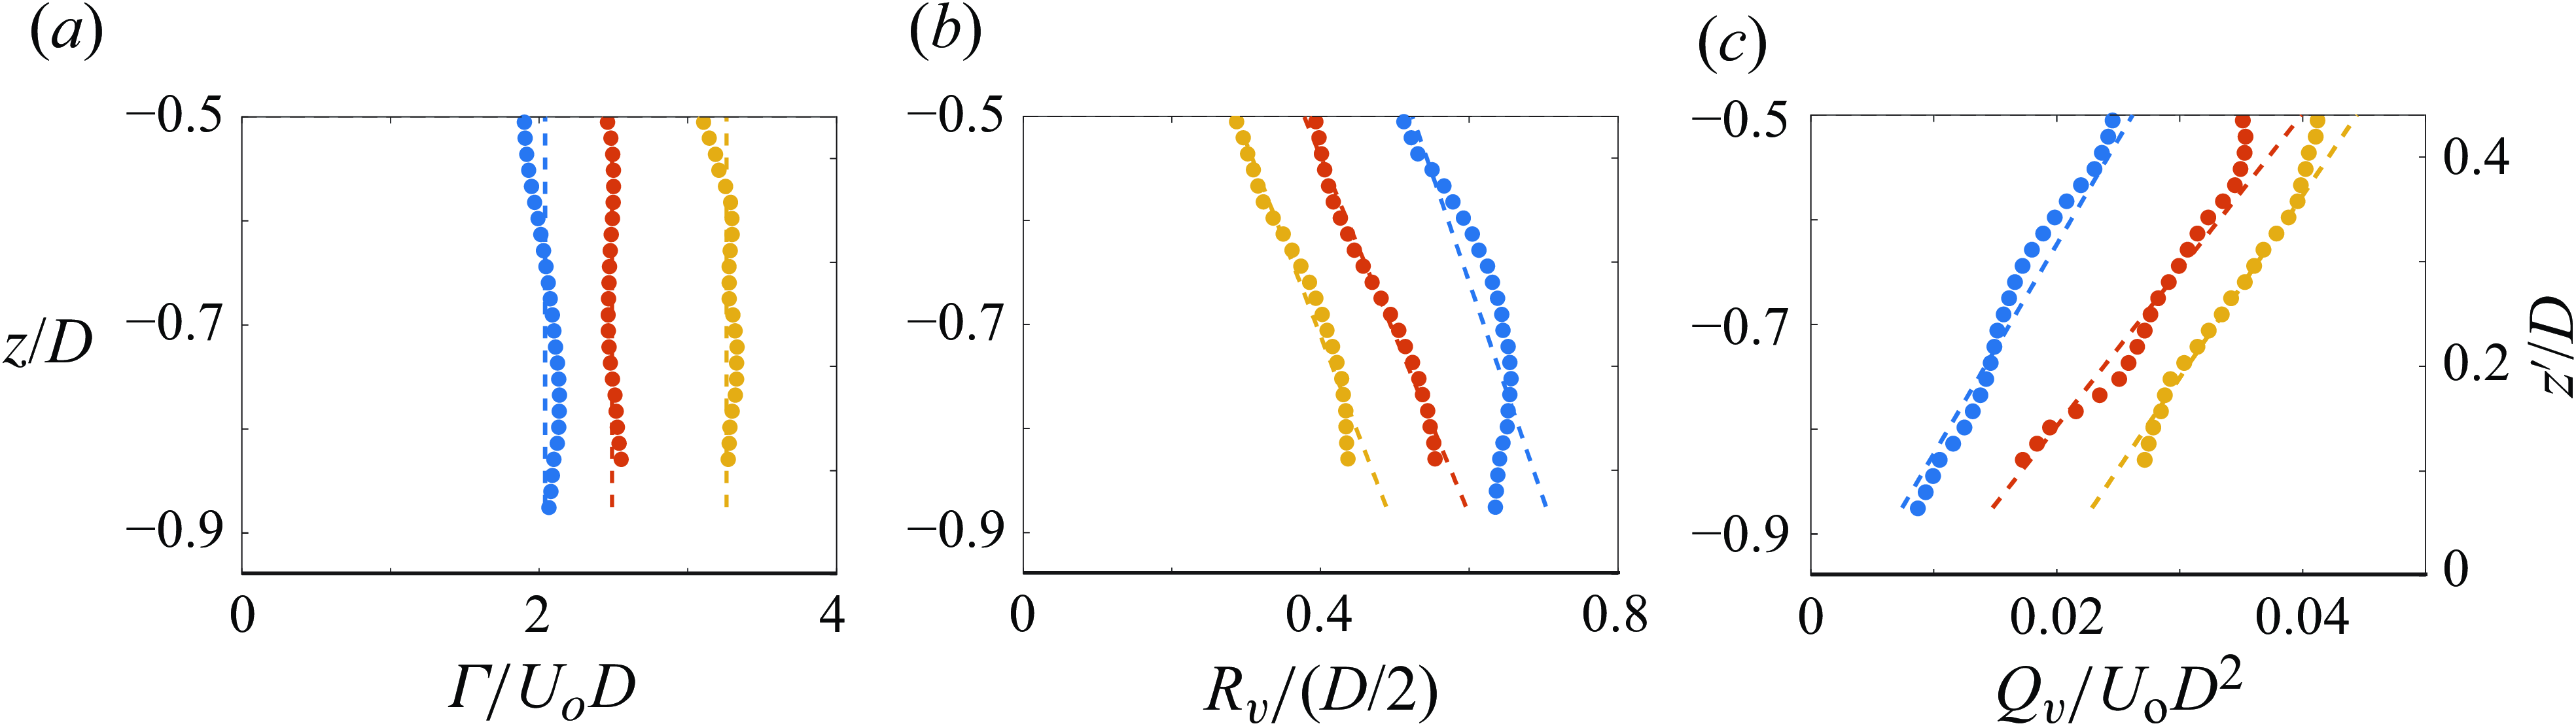
The stationary vortex is lastly characterised in terms of axial variations of its circulation, diameter and axial flow rate as shown in figures 18(a)–18(c), respectively, for $\dot{P}^{*}$
= 61, 82 and 197 (H*
= 0.94). The strength of the vortex can be characterised by the circulation about its axis which is computed in each successive normal plane (cf. figure 16) using the out-of-plane, axial vorticity within circles of increasing radii around the vortex centre until each reached saturation. The resulting axial evolution of circulation in figure 18(a) shows that, while it increases with
$\dot{P}^{*}$
= 61, 82 and 197 (H*
= 0.94). The strength of the vortex can be characterised by the circulation about its axis which is computed in each successive normal plane (cf. figure 16) using the out-of-plane, axial vorticity within circles of increasing radii around the vortex centre until each reached saturation. The resulting axial evolution of circulation in figure 18(a) shows that, while it increases with $\dot{P}^{*}$
, it is nearly invariant along the vortex. That the vortex circulation is nearly invariant with elevation above the surface indicates that its source of vorticity is indeed the ground plane vorticity layer, as discussed in connection with figure 17, and that there are no other contributions from the surroundings or surface of the inlet. The present work appears to present the first clear experimental evidence of earlier observations in numerical simulations (Trapp & Girardi Reference Trapp and Girardi2010, Reference Trapp and Girardi2020) that, absent from vorticity in the cross-flow, the ground vortex can be formed and sustained only by the advection of vorticity from the ground layer. The vortex characteristic radius is defined based on the radius at which the circulation level reaches 95 % of the corresponding saturation level at each plane in figure 18(a) and its evolution along the vortex core is shown in figure 18(b). These data show that the vortex radius diminishes with increasing
$\dot{P}^{*}$
, it is nearly invariant along the vortex. That the vortex circulation is nearly invariant with elevation above the surface indicates that its source of vorticity is indeed the ground plane vorticity layer, as discussed in connection with figure 17, and that there are no other contributions from the surroundings or surface of the inlet. The present work appears to present the first clear experimental evidence of earlier observations in numerical simulations (Trapp & Girardi Reference Trapp and Girardi2010, Reference Trapp and Girardi2020) that, absent from vorticity in the cross-flow, the ground vortex can be formed and sustained only by the advection of vorticity from the ground layer. The vortex characteristic radius is defined based on the radius at which the circulation level reaches 95 % of the corresponding saturation level at each plane in figure 18(a) and its evolution along the vortex core is shown in figure 18(b). These data show that the vortex radius diminishes with increasing $\dot{P}^{*}$
, and for a given
$\dot{P}^{*}$
, and for a given $\dot{P}^{*}$
the radius decreases with elevation above the ground plane (34 %, 29 % and 20 % for
$\dot{P}^{*}$
the radius decreases with elevation above the ground plane (34 %, 29 % and 20 % for $\dot{P}^{*}$
= 61, 82 and 197, respectively) indicating stretching of the vortex core by the suction. Finally, the volume flow rate through the core of each vortex is calculated based on its radius as an indicator of the effect of the suction using the axial velocity distribution in each plane. The resulting evolution of the vortex axial flow rate (figure 18
c) indicates a nearly monotonic increase in volume flow rate with elevation above the ground plane in excess of 80 % for each momentum flux. This increase relative to the flow rate just above the ground plane indicates that the vortex core entrains ambient irrotational fluid from the cross-flow at a nearly constant rate with elevation while the circulation remains unchanged, and that since the cross-section of the core decreases, the sectional-average axial velocity increases with elevation. Finally, it is noteworthy that the range of volume flow rates Q
v
through the ground vortices in figure 18(c) remains between 3.2 % and 3.6 % of the inlet flow rate while
$\dot{P}^{*}$
= 61, 82 and 197, respectively) indicating stretching of the vortex core by the suction. Finally, the volume flow rate through the core of each vortex is calculated based on its radius as an indicator of the effect of the suction using the axial velocity distribution in each plane. The resulting evolution of the vortex axial flow rate (figure 18
c) indicates a nearly monotonic increase in volume flow rate with elevation above the ground plane in excess of 80 % for each momentum flux. This increase relative to the flow rate just above the ground plane indicates that the vortex core entrains ambient irrotational fluid from the cross-flow at a nearly constant rate with elevation while the circulation remains unchanged, and that since the cross-section of the core decreases, the sectional-average axial velocity increases with elevation. Finally, it is noteworthy that the range of volume flow rates Q
v
through the ground vortices in figure 18(c) remains between 3.2 % and 3.6 % of the inlet flow rate while $\dot{P}^{*}$
varies between 61 and 197. Thus, for a given cross-wind speed, the axial flow rate carried into the inlet by the ground vortex appears to be dependent only on the inlet volume flow rate.
$\dot{P}^{*}$
varies between 61 and 197. Thus, for a given cross-wind speed, the axial flow rate carried into the inlet by the ground vortex appears to be dependent only on the inlet volume flow rate.
6. Effects of inlet plane suction flow on ground vortex formation
The present analysis of the formation and evolution of an anchored ground vortex by interaction between the irrotational cross-flow and the inlet suction over a ground plane indicates that its onset can be prevented or delayed by altering the flow field about the inlet to suppress the appearance of the countercurrent shear layer over the ground surface. It is hypothesised that, for a given H*
and $\dot{P}^{*}$
, the intensity of the suction flow and its interaction with the ground plane can be mitigated simply by increasing the inlet area using circumferential air flow through azimuthal perforations in the cylindrical shell of the suction cylinder past its inlet plane. Therefore, to test the mechanisms of the ground vortex formation discussed in § 4, the solid, axisymmetric inlet duct (figure 19
a) was altered to accommodate azimuthal arrays of circular holes to enable the flow of air driven by the pressure difference over the outer and inner surfaces of the shell. Figure 19(b) shows a cross-sectional view of such flow paths in 8 axially successive azimuthal rows with a uniform centre-to-centre spacing of 0.041D between the cylinder’s outer and inner surfaces whose internal diameter is 0.021D such that bleed flow is drawn radially through the outer surface into the shell conduit (owing to design constraints of the current model, the drawn flow enters normal to the inner surface of the duct). While the effects of several flow paths and bleed port distributions are discussed by Nichols (Reference Nichols2024), attention here is restricted to two flow path configurations. In the configuration shown in figure 19(c), each row is equally spaced azimuthally around the perimeter of the inlet cylinder such that the entire open area is 32.0 % of the inlet area. In the second configuration (figure 19
d), the openings in each row are active within the azimuthal sector 0° < θ< 120° and 240° < θ < 0° (cf. figure 2) and the resulting global porosity is
$\dot{P}^{*}$
, the intensity of the suction flow and its interaction with the ground plane can be mitigated simply by increasing the inlet area using circumferential air flow through azimuthal perforations in the cylindrical shell of the suction cylinder past its inlet plane. Therefore, to test the mechanisms of the ground vortex formation discussed in § 4, the solid, axisymmetric inlet duct (figure 19
a) was altered to accommodate azimuthal arrays of circular holes to enable the flow of air driven by the pressure difference over the outer and inner surfaces of the shell. Figure 19(b) shows a cross-sectional view of such flow paths in 8 axially successive azimuthal rows with a uniform centre-to-centre spacing of 0.041D between the cylinder’s outer and inner surfaces whose internal diameter is 0.021D such that bleed flow is drawn radially through the outer surface into the shell conduit (owing to design constraints of the current model, the drawn flow enters normal to the inner surface of the duct). While the effects of several flow paths and bleed port distributions are discussed by Nichols (Reference Nichols2024), attention here is restricted to two flow path configurations. In the configuration shown in figure 19(c), each row is equally spaced azimuthally around the perimeter of the inlet cylinder such that the entire open area is 32.0 % of the inlet area. In the second configuration (figure 19
d), the openings in each row are active within the azimuthal sector 0° < θ< 120° and 240° < θ < 0° (cf. figure 2) and the resulting global porosity is $ \phi $
= 21.4 %. For the same mass flow rate through the cylinder with a given
$ \phi $
= 21.4 %. For the same mass flow rate through the cylinder with a given $\dot{P}^{*}$
, the presence of the peripheral flow leads to a reduction in the suction speed into the inlet plane and thereby diminishes the interaction with the ground plane. The changes in the formation of the ground vortex for the two configurations are shown in figure 19(e) using the formation boundary in terms of
$\dot{P}^{*}$
, the presence of the peripheral flow leads to a reduction in the suction speed into the inlet plane and thereby diminishes the interaction with the ground plane. The changes in the formation of the ground vortex for the two configurations are shown in figure 19(e) using the formation boundary in terms of $\dot{P}_{c}^{*}$
and H*
as discussed in connection with figure 7(b) (the formation boundary for the solid surface is also shown for reference). These data show that the full circumferential flow leads to a significant increase in the threshold inlet momentum flux at which a ground vortex is first detected. For example, at H*
= 1.00,
$\dot{P}_{c}^{*}$
and H*
as discussed in connection with figure 7(b) (the formation boundary for the solid surface is also shown for reference). These data show that the full circumferential flow leads to a significant increase in the threshold inlet momentum flux at which a ground vortex is first detected. For example, at H*
= 1.00, $\dot{P}_{c}^{*}$
increases from 55 to 102, an increase of 85 %. In the segmented configuration (figure 19
d) in which the flow above the ground plane is disabled to limit the near-ground suction,
$\dot{P}_{c}^{*}$
increases from 55 to 102, an increase of 85 %. In the segmented configuration (figure 19
d) in which the flow above the ground plane is disabled to limit the near-ground suction, $\dot{P}_{c}^{*}$
increases from 55 to 161, an increase of 193 % at the same H*
= 1.00, and the increment in the threshold momentum for appearance of a ground vortex increases further with H*
(up to 250 % at H*
= 1.07).
$\dot{P}_{c}^{*}$
increases from 55 to 161, an increase of 193 % at the same H*
= 1.00, and the increment in the threshold momentum for appearance of a ground vortex increases further with H*
(up to 250 % at H*
= 1.07).
(a) The solid axisymmetric inlet; (b) cross-section of the inlet showing eight axially successive arrays of equally spaced azimuthal rows of flow conduits (diameter 0.021D); (c) full azimuthal arrays (around the perimeter) with total porosity $ \phi $
= 32.0 %; (d) the same arrays excluding the azimuthal segment 120° < θ < 240° with total porosity
$ \phi $
= 32.0 %; (d) the same arrays excluding the azimuthal segment 120° < θ < 240° with total porosity $ \phi $
= 21.4 %; and (e) the vortex formation (threshold) boundaries in the absence (a, •) and presence (c,
$ \phi $
= 21.4 %; and (e) the vortex formation (threshold) boundaries in the absence (a, •) and presence (c,![]() and d,
and d,![]() ) of the flow across the inlet shell.
) of the flow across the inlet shell.
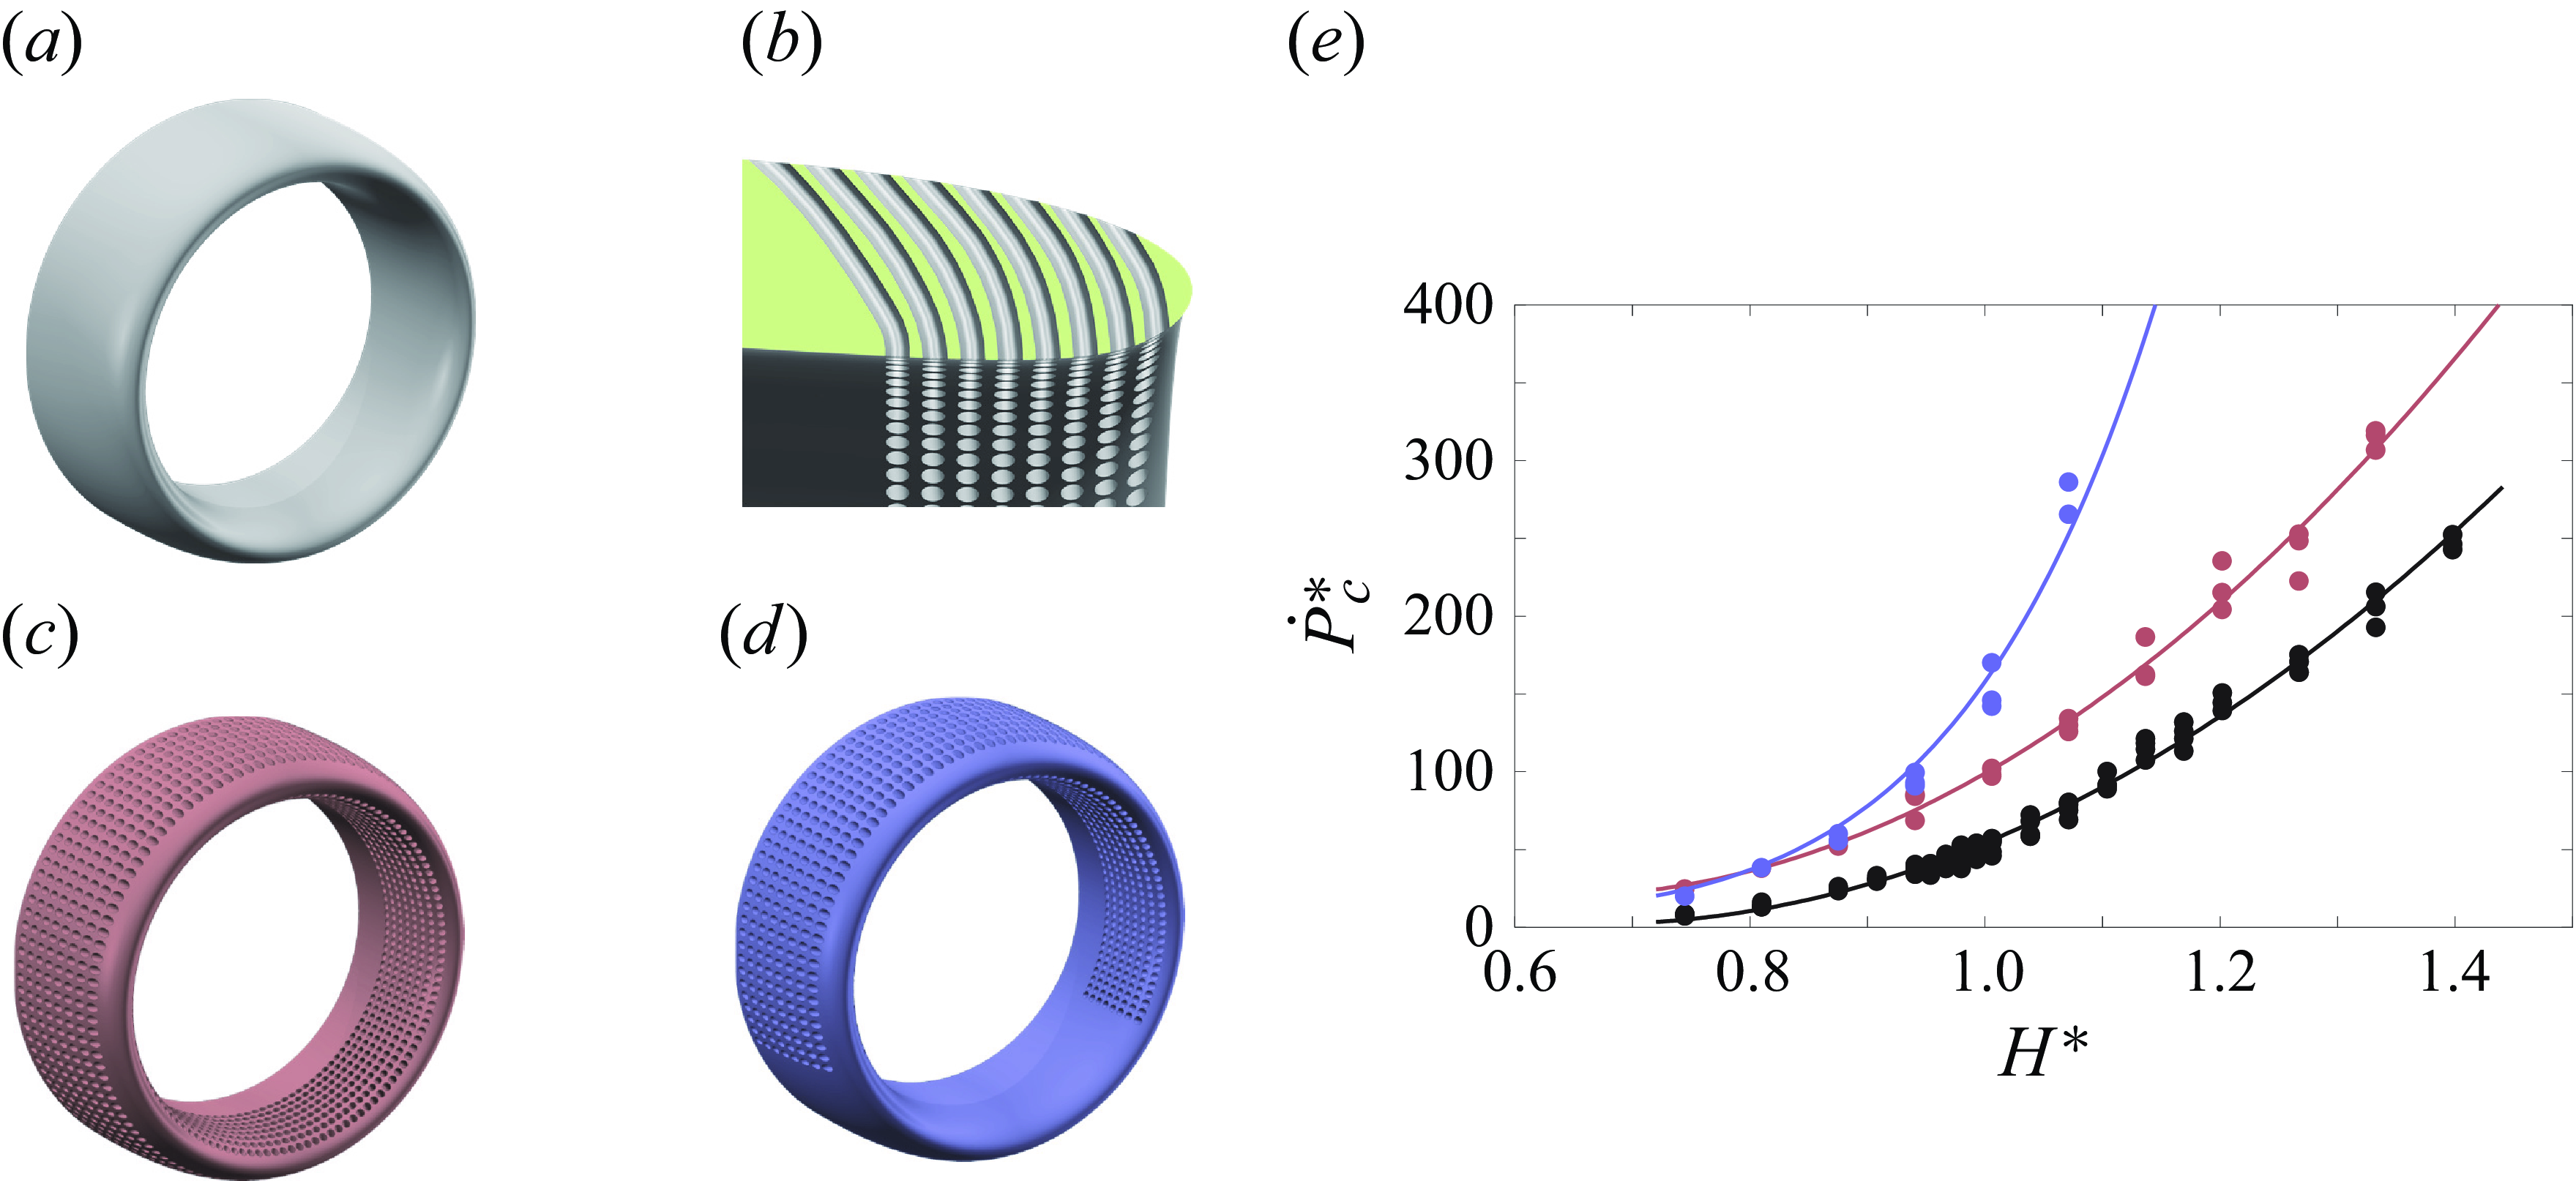
The induced changes in the flow field near the inlet are depicted using velocity measurements in the inlet plane. Figure 20 shows colour raster plots of the time-averaged streamwise velocity component superposed with fixed-length velocity vectors in the presence of the auxiliary flow using the segmented configuration in figure 19(d) for H*
= 0.94 and $\dot{P}^{*}$
= 20 (a), 82 (b) and 197 (c), where the equivalent cases in the absence of control are plotted in figure 4(b), (d) and (e), respectively. These conditions are selected such that a ground vortex forms for neither inlet at
$\dot{P}^{*}$
= 20 (a), 82 (b) and 197 (c), where the equivalent cases in the absence of control are plotted in figure 4(b), (d) and (e), respectively. These conditions are selected such that a ground vortex forms for neither inlet at $\dot{P}^{*}$
= 20, only for the solid inlet at
$\dot{P}^{*}$
= 20, only for the solid inlet at $\dot{P}^{*}$
= 82 and for both the solid and modified inlets at
$\dot{P}^{*}$
= 82 and for both the solid and modified inlets at $\dot{P}^{*}$
= 197.
$\dot{P}^{*}$
= 197.
Colour raster plots of the time-averaged streamwise velocity component $\overline{{u}}$
superposed with equal-length velocity vectors at the inlet plane y = 0 for H
* = 0.94 and
$\overline{{u}}$
superposed with equal-length velocity vectors at the inlet plane y = 0 for H
* = 0.94 and $\dot{{P}}^{{*}}$
= 20 (a), 82 (b) and 197 (c) in the presence of flow across the inlet shell using the configuration of figure 19(d). The critical saddle (solid symbols) and node (open symbols) points in the
$\dot{{P}}^{{*}}$
= 20 (a), 82 (b) and 197 (c) in the presence of flow across the inlet shell using the configuration of figure 19(d). The critical saddle (solid symbols) and node (open symbols) points in the ![]() of a ground vortex are marked for reference, along with the inlet contour and surface plane.
of a ground vortex are marked for reference, along with the inlet contour and surface plane.

In the presence of the flow through the shell and $\dot{P}^{*}$
= 20 (figure 20
a), the magnitude of the streamwise velocity along the upstream and downstream sectors of the inlet is lower than in figure 4(b) in the areas of the segmented flow and similar in areas of its absence. The saddle point located on the cylinder’s downstream sector separates between nearly symmetric downward flow from above and upward flow from below while the node within the inlet flow within the cylinder’s inlet exhibits slight asymmetry and is below x = 0, and the lower segment of the inlet resembles the corresponding velocity field of the flow with the solid shell since there is no flow through the bottom segment of the inlet. When the inlet momentum flux is increased to the level at which a ground vortex forms for the solid shell (
$\dot{P}^{*}$
= 20 (figure 20
a), the magnitude of the streamwise velocity along the upstream and downstream sectors of the inlet is lower than in figure 4(b) in the areas of the segmented flow and similar in areas of its absence. The saddle point located on the cylinder’s downstream sector separates between nearly symmetric downward flow from above and upward flow from below while the node within the inlet flow within the cylinder’s inlet exhibits slight asymmetry and is below x = 0, and the lower segment of the inlet resembles the corresponding velocity field of the flow with the solid shell since there is no flow through the bottom segment of the inlet. When the inlet momentum flux is increased to the level at which a ground vortex forms for the solid shell ( $\dot{P}^{*}$
= 82, figure 4
d), the saddle moves slightly downstream with the cross-flow and towards the ground plane and the colour levels indicate nearly symmetric increase in streamwise velocity over the upstream sector of the inlet but mostly along the lower segment of the downstream sector (figure 20
b). Most importantly, the absence of the ground vortex is clearly connected with the absence of the countercurrent flow domain over the ground plane in contrast to the flow topology in figure 4(d). The delayed appearance of the ground vortex in the inlet plane owing to the change in the interaction of the suction flow with the surface vorticity layer demonstrates the role of the boundary layer in the initiation and sustainment of wall-normal vortices and ultimately of the ground vortex. Finally, when the suction is raised above the new threshold (e.g.
$\dot{P}^{*}$
= 82, figure 4
d), the saddle moves slightly downstream with the cross-flow and towards the ground plane and the colour levels indicate nearly symmetric increase in streamwise velocity over the upstream sector of the inlet but mostly along the lower segment of the downstream sector (figure 20
b). Most importantly, the absence of the ground vortex is clearly connected with the absence of the countercurrent flow domain over the ground plane in contrast to the flow topology in figure 4(d). The delayed appearance of the ground vortex in the inlet plane owing to the change in the interaction of the suction flow with the surface vorticity layer demonstrates the role of the boundary layer in the initiation and sustainment of wall-normal vortices and ultimately of the ground vortex. Finally, when the suction is raised above the new threshold (e.g. $\dot{P}^{*}$
= 197 in figure 20
c), a ground vortex appears at the inlet even in the presence of the flow through the shell, as evidenced by flow swirling within the inlet, and its appearance is marked by the return of a relatively short domain of reversed flow over the ground plane between two saddles. However, even though the ground vortex is eventually formed in the presence of the auxiliary flow, it is significantly weaker (e.g. 40 % lower circulation) than the corresponding vortex that forms in its absence (cf. figure 4
e).
$\dot{P}^{*}$
= 197 in figure 20
c), a ground vortex appears at the inlet even in the presence of the flow through the shell, as evidenced by flow swirling within the inlet, and its appearance is marked by the return of a relatively short domain of reversed flow over the ground plane between two saddles. However, even though the ground vortex is eventually formed in the presence of the auxiliary flow, it is significantly weaker (e.g. 40 % lower circulation) than the corresponding vortex that forms in its absence (cf. figure 4
e).
7. Concluding remarks
The formation and evolution of ground vortices by interactions of an irrotational cross-flow over a plane surface with suction into a cylindrical conduit whose axis is normal to the cross-flow and parallel to the ground plane were investigated in wind tunnel experiments over a broad range of formation parameters that included the momentum flux of the conduit’s inlet, speed of the cross-flow and the cylinder’s elevation above the ground plane. Specific emphasis was placed on the flow mechanisms that lead to the ingestion of a ground vortex into the inlet and the role of the surface vorticity layer in its transitory initiation and eventual sustainment.
The present investigations clearly delineate, apparently for the first time, the formation sequence of the ground vortex commencing with its initiation through its advection and transitory formation, and finally its anchoring to and sustainment at the nacelle’s inlet. The interaction between suction-induced reversed flow over the ground plane and the cross-flow leads to a countercurrent shear layer downstream of the duct’s inlet (cf. figure 11) that spawns wall-normal vortices having nominally streamwise celerity. The celerity of these wall-normal vortices is reversed with increasing suction flow and they are advected upstream while their circulation increases by transport of vorticity from the ground layer, and close to the inlet they can become stretched toward and momentarily ingested into the inlet before they intermittently detach and are advected downstream by the cross-flow. At higher suction levels the intermittent detachment becomes infrequent and ultimately subsides forming a nominally stationary ingested ground vortex that is ‘anchored’ to the inlet. This formation mechanism is different from a sudden attachment of the lower trailing vortex, as proposed by De Siervi et al. (Reference De Siervi, Viguier, Greitzer and Tan1982) and Shin et al. (Reference Shin, Greitzer, Cheng, Tan and Shippee1986).
Detailed flow measurements further reveal that an anchored ground vortex, once established in an irrotational cross-flow, can only be sustained by the advection of vorticity from the ground layer. The entrained spanwise vorticity concentrations from the surface layer are tilted and stretched into and become aligned with the vortex core. It was shown that, at a given inlet momentum flux, the circulation about the axis of the anchored vortex is invariant along its core as the vortex is stretched into the inlet, and it increases with inlet momentum flux.
The flow conditions in terms of the primary parameters that lead to the formation (or appearance) of an ingested ground vortex within an inlet of diameter D namely the inlet momentum flux $\dot{P}$
, cross-flow speed U
o
and inlet elevation above the ground plane H were determined by detecting the presence of vortex using distributions of the total pressure within the inlet. These conditions were codified in formation maps over a range of these parameters which show that the appearance of the vortex within the inlet occurs above a threshold momentum coefficient
$\dot{P}$
, cross-flow speed U
o
and inlet elevation above the ground plane H were determined by detecting the presence of vortex using distributions of the total pressure within the inlet. These conditions were codified in formation maps over a range of these parameters which show that the appearance of the vortex within the inlet occurs above a threshold momentum coefficient $\dot{P}_{c}^{*}$
that varies quadratically with the scaled elevation of the inlet H
* = H/D. Alternatively, for a given
$\dot{P}_{c}^{*}$
that varies quadratically with the scaled elevation of the inlet H
* = H/D. Alternatively, for a given $\dot{P}^{*}$
, in the absence of a ground vortex in the inlet, H
* can be decreased until
$\dot{P}^{*}$
, in the absence of a ground vortex in the inlet, H
* can be decreased until $H_{c}^{*}$
is reached at which point the vortex appears within the inlet. It is noted that this quadratic dependence exhibits better agreement with the ‘end states’ of either diminishing or increasing H
* than the linear velocity dependence that was predicted by earlier researchers. Furthermore, the present investigations also indicate that scaled flow fields (by U
o
) leading to the inlet, both in the absence and presence of the ground vortex, are similar for combinations of different
$H_{c}^{*}$
is reached at which point the vortex appears within the inlet. It is noted that this quadratic dependence exhibits better agreement with the ‘end states’ of either diminishing or increasing H
* than the linear velocity dependence that was predicted by earlier researchers. Furthermore, the present investigations also indicate that scaled flow fields (by U
o
) leading to the inlet, both in the absence and presence of the ground vortex, are similar for combinations of different $\dot{P}$
, U
o
and H that yield the same
$\dot{P}$
, U
o
and H that yield the same $\dot{P}^{*}$
and H*
. Correspondingly, the signatures of ground vortices that formed at different
$\dot{P}^{*}$
and H*
. Correspondingly, the signatures of ground vortices that formed at different $\dot{P}$
, U
o
and H and are measured by distributions of the total pressure within the inlet that scaled by the cross-flow dynamic pressure are also similar at the same
$\dot{P}$
, U
o
and H and are measured by distributions of the total pressure within the inlet that scaled by the cross-flow dynamic pressure are also similar at the same $\dot{P}^{*}$
and H*
(although this similarity may break somewhat in the presence of internal separation within the inlet). Based on these observations, it is conjectured that that ground vortices formed at different primary parameters that yield the same
$\dot{P}^{*}$
and H*
(although this similarity may break somewhat in the presence of internal separation within the inlet). Based on these observations, it is conjectured that that ground vortices formed at different primary parameters that yield the same $\dot{P}^{*}$
and H*
would be similar in terms of their scaled characteristics.
$\dot{P}^{*}$
and H*
would be similar in terms of their scaled characteristics.
Finally, the formation mechanism uncovered in the present investigations was tested by assessing the effects of the suction flow about the duct shell on the initiation of wall-normal vortices that are ultimately drawn into the inlet. The magnitude of the suction flow through the inlet plane was varied while keeping the overall flow rate into the axisymmetric duct (and therefore the momentum flux $\dot{P}$
) invariant by adding peripheral radial flow through the outer surface of the conduit that is driven by the pressure difference across the outer and inner surfaces. It was shown that reduction in the flow through the inlet plane delays the suction-induced reversed flow near the ground surface and consequently delays the formation of the countercurrent shear layer over the surface and of wall-normal vortices that are advected upstream until a significantly higher level of inlet momentum coefficient is reached. Furthermore, the flow field in the presence of the delayed ground vortex is markedly different from the corresponding flow in the absence of peripheral flow and its circulation is significantly lower. It is noted that while, similar to earlier studies (cf. § 1), the present investigation was clearly motivated by the near-ground flow field about nacelles of propulsion systems, attention was restricted to suction flow into a generic axisymmetric conduit in an irrotational uniform cross-flow over a ground plane and applications to specific aircraft operation should consider effects of inlet geometry, free stream turbulence, shed vorticity from the aircraft, ground surface texture, etc.
$\dot{P}$
) invariant by adding peripheral radial flow through the outer surface of the conduit that is driven by the pressure difference across the outer and inner surfaces. It was shown that reduction in the flow through the inlet plane delays the suction-induced reversed flow near the ground surface and consequently delays the formation of the countercurrent shear layer over the surface and of wall-normal vortices that are advected upstream until a significantly higher level of inlet momentum coefficient is reached. Furthermore, the flow field in the presence of the delayed ground vortex is markedly different from the corresponding flow in the absence of peripheral flow and its circulation is significantly lower. It is noted that while, similar to earlier studies (cf. § 1), the present investigation was clearly motivated by the near-ground flow field about nacelles of propulsion systems, attention was restricted to suction flow into a generic axisymmetric conduit in an irrotational uniform cross-flow over a ground plane and applications to specific aircraft operation should consider effects of inlet geometry, free stream turbulence, shed vorticity from the aircraft, ground surface texture, etc.
Acknowledgements
The authors gratefully acknowledge the support of this research work by the Georgia Institute of Technology, and support from the Boeing Company in the development of the cross-wind facility.
Declaration of interests
The authors report no conflict of interest.


 Open access