


1. Introduction
The phonemic inventory of Italian consonants includes voiced labiodental fricatives /v, vː/, which are contrastively short (singleton) or long (geminate) in this language, e.g., /ˈbeve/ beve (‘s/he drinks’) vs. /ˈbevːe/ bevve (‘s/he drank’), or /avaˈlːare/ avallare (‘to endorse’) vs. /avːaˈlːare/ avvallare (‘to sink’) (Bertinetto & Loporcaro Reference Bertinetto and Loporcaro2005; Rogers & D’Arcangeli Reference Rogers and D’Arcangeli2004). Notably, /vː/ is the only geminate voiced fricative phoneme in standard Italian. Compared to other obstruents, voiced labiodental fricatives, especially geminate /vː/, have been under-researched experimentally in this language as well as cross-linguistically. Below we provide a phonetic description of these sounds followed by an overview of the few relevant previous studies.
1.1. The phonetic characteristics of /v, vː/ cross-linguistically and in Italian
In principle, voiced fricatives require the simultaneous presence of voicing (vocal fold vibration) and frication (turbulent noise) (Catford Reference Catford1977; Stevens et al. Reference Stevens, Blumstein, Glicksman, Burton and Kurowski1992; Bárkányi & Kiss Reference Bárkányi, Kiss, Fuchs, Toda and Zygis2010). This articulatory requirement makes them more complex to produce than their voiceless counterparts, as frication is generated most efficiently in the absence of voicing – a point discussed in more detail below. This increased production complexity may contribute to the lower cross-linguistic frequency of voiced fricatives.
Focusing on labiodentals, the most recent version of the UCLA Phonological Segment Inventory Database,Footnote 1 first published by Maddieson (Reference Maddieson1984), reports that /v/ occurs in 95 languages, compared to 180 for its voiceless counterpart /f/, based on a sample of 415 languages. Notably, this survey includes no data on geminate /vː/, suggesting that this sound is typologically rare. According to the PHOIBLE database of phonological inventories (Moran & McCloy Reference Moran and McCloy2019), long [vː] is attested – either as a derived or underlying form – in only ten of the 2,186 languages surveyed, including Italian. Closer inspection of the relevant language descriptions indicates that [vː] in these cases typically results from phonological processes that apply at morphosyntactic boundaries – such as assimilation across morpheme junctures or external sandhi – rather than functioning as a contrastive segment. In Italian, however, geminate /vː/ is clearly phonemic, exhibiting lexical contrast with singleton /v/.Footnote 2 Beyond PHOIBLE, phonemic /vː/ has, to our knowledge, been documented in Miyako Ryukyuan, spoken in Japan (Fujimoto et al. Reference Fujimoto, Shinohara and Mochihashi2023) and in Persian (Hansen & Myers Reference Hansen and Myers2017).
Voicing and frication involve conflicting aerodynamic requirements. Voicing requires appropriate adduction of the vocal folds, which reduces the volume velocity of airflow through the glottis (Stevens Reference Stevens2000). This reduction limits the buildup of oral air pressure, thereby diminishing frication noise, as effective frication depends on a significant pressure drop across the constriction (cf. Shadle Reference Shadle, Hardcastle, Laver and Gibbon2010). The resulting decrease in intraoral pressure may even cause the articulators to come together, producing a brief occlusion. In contrast, the production of audible frication requires a high-volume velocity of airflow through a narrow articulatory constriction – best achieved with a spread glottis. This glottal configuration, however, inhibits vocal fold vibration and thus precludes voicing (Ohala Reference Ohala and MacNeilage1983; Stevens Reference Stevens2000).
To illustrate these aerodynamic differences, Figures 1 and 2 present dynamic airflow (top) and intraoral pressure (bottom) measurements over time for the sequences [afa] and [ava], respectively, produced by the first author, a native speaker of Italian. The average airflow measured between the green and red vertical lines is 117 mL/s for [f] and 36 mL/s for [v]. The corresponding intraoral pressure measured at the midpoint of the pressure pulses is 10.10 cmH2O for [f] and 5.41 cmH2O for [v]. In this example, [v] exhibits approximately one-third the airflow and half the intraoral pressure of [f].
Airflow (top) and intraoral pressure (bottom) of [afa] measured in Aeroview using a Rothenberg mask, a MS-110 transducer electronic unit, and PT-2E and PT-25 pressure transducers, all by Glottal Enterprises, Inc. The displayed time window is 640 ms.

Airflow (top) and intraoral pressure (bottom) of [ava] measured in Aeroview using a Rothenberg mask, a MS-110 transducer electronic unit, and PT-2E and PT-25 pressure transducers, all by Glottal Enterprises, Inc. The displayed time window is 640 ms.

Given this complex interplay between voicing and frication, non-canonical realizations of short and long voiced labiodental fricatives are likely to occur alongside canonical [v, vː] forms. Acoustically, canonical realizations should exhibit low-frequency periodicity and visible glottal pulses (indicative of voicing) combined with a diffuse, relatively faint high-frequency noise across the spectrum (cf. Ladefoged & Johnson Reference Ladefoged and Johnson2014: 212). However, based on the aerodynamic scenarios presented above, non-canonical realizations may include low-frequency periodicity with little or no accompanying mid- or high-frequency energy, suggestive of a more constricted labiodental articulation [v̝] or a fully occluded realization [b̪] (a voiced labiodental plosive).Footnote 3 Alternatively, as also reported by Stevens et al. (Reference Stevens, Blumstein, Glicksman, Burton and Kurowski1992) for American English and Jesus & Shadle (Reference Jesus and Shadle2002) for European Portuguese, the acoustic signal may show reduced low-frequency periodicity (voicing) alongside strong high-frequency energy (frication), particularly in the middle portion of the consonant, indicating a partially devoiced allophone [v̥]. As explained in more detail below, these non-canonical realizations are more likely to surface for /vː/ due to its longer duration.
In the case of singleton /v/, speakers across languages may resort to a reduction in the degree of labiodental constriction, producing approximant variants [ʋ], particularly in intervocalic positions. This trend aligns with cross-linguistic tendencies of intervocalic consonant lenition, defined as a reduction in constriction degree (cf. Kirchner Reference Kirchner2004). Intervocalic lenition is an active phonetic process in different regional varieties of Italian, as in a number of other languages. In Italian obstruents, it typically affects singleton but not geminate consonants (but see Giannelli & Savoia Reference Giannelli and Savoia1979 on geminate lenition in fast speech in Florentine) with patterns of application varying across regions. In northern Italy and Sardinia, lenition predominantly targets voiced obstruents (Canepari Reference Canepari1992), whereas in the centre-south, it may affect all singletons, and is associated with partial or complete voicing of voiceless stops, e.g., Roman /i ˈpini/ > [i ˈp̌iːni] (‘the pine trees’) (Dian et al. Reference Dian, Hajek and Fletcher2024; Hualde & Nadeu Reference Hualde and Nadeu2012; Nocchi & Schmid Reference Nocchi, Schmid, Pettorino, Giannini, Vallone and Savy2008). In certain varieties spoken in and around Tuscany, central Italy, most notably Florentine and surrounding lects, lenition of intervocalic voiceless singleton stops through spirantization, typically without voicing especially for /p t/ > [ɸ θ], has even become phonologized – a phenomenon known as gorgia toscana, e.g., /i ˈpini/ > [i ˈɸiːni] (Giannelli & Savoia Reference Giannelli and Savoia1979; Marotta Reference Marotta, de Carvalho, Scheer and Ségéral2008; Russo Reference Russo2022). As for /v/, for which variants other than fricative [v] have not been reported in the Standard variety of Italian (e.g., Bertinetto & Loporcaro Reference Bertinetto and Loporcaro2005), an approximant allophone, [ʋ], has been reported to occur intervocalically in some regional varieties (see § 1.2 below), as well as in various European languages including, e.g., Serbian (Bjorndahl Reference Bjorndahl2022), Slovak (Hanulíková & Hamann Reference Hanulíková and Hamann2010), Danish (Allan Reference Allan2014), Faroese (Árnason Reference Árnason2011), and Valencian (Saborit Vilar Reference Saborit Vilar2009). In the specific case of Italian, this approximant realization also has the advantage of avoiding perceptual confusion with other phonemes, a risk posed by [v̥] and [b̪], which may potentially be perceived as /f/ and /b/, respectively, leading to possible perceptual phonemic mergers.
Regarding geminate /vː/, the aerodynamic challenges already discussed are further intensified by the need to maintain the voicing-frication balance across a longer constriction period. Based on the aerodynamic processes referred to above, possible allophones of /vː/ may exhibit devoicing [v̥ː] or alternatively decreased or no visible frication noise, indicative of a narrower constriction [v̝ː] or complete occlusion [b̪ː], which could also be followed by a release burst, characteristic of plosives. In contrast to /v/ lenition, these more constricted /vː/ forms can be considered as instances of articulatory strengthening, assuming that strengthening goes in the opposite direction of weakening, showing an increase in constriction degree (cf. the extensive discussion on this point by Bybee & Easterday Reference Bybee and Easterday2019, who aptly argue that the labial environment is particularly conducive to strengthening in terms of articulatory overshooting). This aspect as well as the issue of devoicing are discussed more in detail in § 3.4. Additionally, approximant realizations of long /vː/ are also possible in principle but disfavoured in practice as evidenced by the cross-linguistic rarity of approximant geminates (Maddieson Reference Maddieson2008; but see Celata et al. Reference Celata, Vietti, Spreafico, Gibson and Gil2019, on a long approximant variant of /rː/ in Italian).
1.2. Previous experimental phonetic studies on /v, vː/
In an early investigation of Italian, Ferrero et al. (Reference Ferrero, Genre, Boë and Contini1979) noted a significant reduction of frication noise for singleton /v/, which was often not visible in spectrographic analysis, compared to other voiced fricative phonemes. This is in contrast with the findings for English and European Portuguese discussed in § 1.1 above, whereby frication noise was stronger in non-canonical forms. However, as Ladefoged & Maddieson (Reference Ladefoged and Maddieson1996: 176) explain, frication noise reduction is also to be expected in cases where voicing is maintained during constriction due to the strong low-frequency energy stemming from voicing, which tends to mask the weaker high-frequency frication noise of /v/. This is partly consistent with [v̞] (less constricted) realizations, on a continuum of intervocalic lenition between fricative [v] and approximant [ʋ] (or even deleted [∅]; see below).
Only a few studies have examined the allophonic variation of intervocalic /v/ in specific regional Italian varieties, particularly in the context of intervocalic lenition. For instance, Marotta (Reference Marotta, Albano Leoni and Giordano2005) focused on Roman Italian, reporting a high incidence (68%) of the approximant allophone [ʋ] compared to canonical [v] (24%), along with some occurrences of segment deletion [∅] (8%). Marotta’s corpus, consisting of a spontaneous conversation between two speakers, showed a short average duration of /v/ (55 ms), with [v] and [ʋ] forms pooled. An identical average value is reported in Dian et al. (Reference Dian, Hajek and Fletcher2024) for /ˈCVCV/ words in a controlled corpus of target words embedded in carrier phrases for the same Roman variety. For Veneto Italian, spoken in the Veneto, in north-east Italy, Trumper & Maddalon (Reference Trumper and Maddalon1982), as cited by Vietti (Reference Vietti2019), identify the same [v ʋ ∅] allophones, although no distributional data are available for this study. However, durational data (but not allophonic distributions) for Veneto Italian /v/ can be found in Dian et al. (Reference Dian, Hajek and Fletcher2024), with average values ranging around 65 ms.
Pape & Jesus (Reference Pape and Jesus2015) compared durational and devoicing patterns in voiced stops and fricatives, including /v/, in nonce /ˈCVCV/ words across European Portuguese, German, and Italian (again spoken by Veneto speakers) using six speakers per language. Their findings indicate that while intervocalic /v/ does not differ significantly in duration across the three languages, it tends to remain fully voiced only in Veneto Italian. Dian et al. (Reference Dian, Hajek and Fletcher2024) report similar results using real words, examining Veneto and Roman Italian, where /v/ exhibited comparable durations and a lack of devoicing across both regional varieties. Both studies report average durations that are roughly aligned across languages and varieties within each study, although the values differ between studies, likely due to methodological differences.
Surprisingly, none of the studies we reviewed examine patterns of allophonic variation for geminate /vː/ in Italian or other languages. For instance, while Marotta (Reference Marotta, Albano Leoni and Giordano2005) provides durational data for both /v/ and /vː/, she reports allophonic distributions for the former (see above) but not the latter. Beyond Italian, we have to date found only one study that has investigated the spectral characteristics of /vː/: Shinohara & Fujimoto (Reference Shinohara, Fujimoto and Babatsouli2018: 259) report that for /vː/ in the Ikema dialect of Miyako Ryukyuan, ‘pre-voicing without frication noise in the high-frequency area occurred with seven tokens out of eleven among five speakers’, thus pointing to frequent occurrences of either [v̝ː] or [b̪ː]. This scarcity of phonetic studies on /vː/ is consistent with its presumed typological rarity across the world’s languages, highlighting the need for further experimental investigation.
2. Aims and research questions
This study explores potential allophonic variation in the articulation of the contrastive pair /v/ and /vː/ in word-medial position in Italian, as observable in the acoustic signal. For the first time regarding these segments, a qualitative assessment of phonetic variation is complemented with a quantitative analysis using established acoustic measures of consonantal strength and phonetic voicing.
While previous research has documented considerable variability in the surface realization of /v/ within and across languages, much less is known about its long counterpart /vː/. This study also considers the potential influence of prosodic factors, such as position within the intonational phrase and relative to lexical stress. To assess the generalizability of the findings for Italian, speakers were selected from three geographically and dialectologically distinct areas of Italy (cf. Pellegrini Reference Pellegrini1977), chosen to reflect regional variation reported in previous studies (e.g., Crocco Reference Crocco, Cerruti, Crocco and Marzo2017; Vietti Reference Vietti2019): (i) central Veneto in the northeast, (ii) the city of Rome in the centre-south, and (iii) centro-southern Calabria in the far south.
Our research questions (RQs) are as follows:
-
1) What are the possible allophonic variants of intervocalic /v/ and /vː/ across regional varieties of Italian? Is there variation in their relative frequence of occurrence triggered by (a) regional variety; (b) speaker sex; or (c) prosodic factors (i.e., post- vs. pre-stress, e.g., /ˈbeve/ vs. /doˈvere/, and phrase-final vs. phrase-medial positions)?
-
2) Can variants identified qualitatively through visual spectrographic inspection be reliably classified into consonantal strength categories? Specifically, do approximant realizations represent a weaker form than canonical fricatives, and, if present, do seemingly more constricted realizations represent a stronger form than canonical variants?
-
3) Do non-canonical variants of each length category (/v/ and /vː/) differ durationally from canonical forms?
Based on the reviewed literature, we predict:
-
a) Intervocalic singleton /v/ will surface as either canonical [v], approximant [ʋ], or deleted [∅] across varieties.
-
b) Intervocalic geminate /vː/ will surface as either canonical [vː], more constricted [v̝ː] or potentially even completely occluded [b̪ː] across varieties. Non-canonical realizations may also include some partial devoicing independent of the degree of supraglottal constriction (e.g., [v̥ː v̝̊ː b̪̥ː]), due to an expected tendency for long voiced obstruents to optionally devoice, as posited by the aerodynamic voicing constraint (AVC), e.g., Ohala (Reference Ohala and MacNeilage1983).
-
c) Lenited allophones will be shorter than canonical or more constricted forms, in line with the definition of intervocalic lenition as ‘a reduction in constriction degree or duration’ (Kirchner Reference Kirchner2004).
As for potential variation due to speaker sex or prosodic factors we do not have previous studies that allow us to make predictions specific for /v, vː/.
3. Method
3.1. Participants
Eighteen native speakers of Italian (nine female, nine male) took part in the study. Participants were equally distributed across the three target regional varieties: six speakers of Veneto Italian (VI), six of Roman Italian (RI), and six of Calabrian Italian (CI). Speakers ranged in age from 27 to 68 years (mean age: 41.7 years), and none reported any speech, language, or hearing impairments. All participants were born and raised in their respective regions, where they had spent most of their lives. Specifically, all VI speakers and one CI speaker had lived in their home regions their entire lives, whereas all RI participants and five CI participants had spent part of their lives abroad and were either residing in or travelling through Melbourne, Australia, at the time of recording. This distribution of residential circumstances was due to constraints imposed by the COVID-19 pandemic, which limited travel and access to suitable recording environments in Italy during data collection. All participants reported daily use of Italian.
3.2. Materials and procedure
The target items were real disyllabic and trisyllabic Italian words featuring either a /ˈCVC(ː)V/ structure, with post-stress /C(ː)/ (namely beve /ˈbeve/ ‘s/he drinks’ and bevve /ˈbevːe/ ‘s/he drank’), or a /CVˈC(ː)VCV/ structure, with pre-stress /C(ː)/ (dovere /doˈvere/ ‘duty’ and davvero /daˈvːero/ ‘really’). Thus, all items contained the consonants /v/ or /vː/ in word-medial, intervocalic position. These words were embedded in carrier sentences designed to manipulate their position within the intonational phrase. Two frame sentences were used: Ho detto WORD (‘I said WORD’) for the phrase-final condition, and Ho detto WORD prima (‘I said WORD before’) for the phrase-medial condition. To minimize a potential confounding effect of nuclear placement, target words were produced with nuclear focus. This was elicited by instructing speakers to respond as if answering the questions Che hai detto? (‘What did you say?’) and Che hai detto prima? (‘What did you say before?’), respectively. Each speaker produced four repetitions of each target word in both phrase conditions. Items were presented visually on a laptop screen using Microsoft PowerPoint, with presentation order randomized across participants. Participants were instructed to read each sentence aloud at a natural pace and speaking style. Filler words were inserted among target tokens at the start of each recording session to familiarize participants with the task. In total, each of the eighteen participants produced 32 target tokens (two phonemes × four repetitions × two stress conditions × two phrase conditions), yielding 575 tokens overall after excluding one disfluent production.
3.3. Recording protocol
The studio recordings in Melbourne were conducted at the Horwood Recording Studio, part of the University of Melbourne, using a Charter Oak E700 dual-diaphragm solid-state condenser microphone and a Focusrite Scarlett 18i20 (3rd generation) audio interface. Field recordings in Italy were carried out in quiet, softly furnished rooms in the speakers’ home environments, ideal to reduce echo, using a ZOOM H1n Handy solid-state recorder. In both recording environments, the microphone was positioned at approximately 20 cm from the speakers’ mouth. All speech was digitized at a sampling rate of 44.1 kHz with 16-bit quantization and saved in WAV format. Recordings were continuously monitored to ensure clarity; any trials containing disfluencies, hesitation, or background noise were discarded and re-recorded as needed.
3.4. Acoustic analysis
Segmentation and labelling of the target consonants were carried out manually using the EMU Speech Database Management System (EMU-SDMS; Winkelmann et al. Reference Winkelmann, Harrington and Jänsch2017). Segment boundaries were defined based on visual inspection of both the waveform and spectrogram, with procedures varying according to the phonemes’ acoustic realization. For fricative variants, the onset and offset of the target segment were placed at the visible boundaries of frication noise, identified by the presence of mid-to-high frequency energy. For approximant realizations, boundaries were placed at points on either side of the segment where a dip in the amplitude envelope was observed in the waveform, accompanied by a slight change in formant structure in the spectrogram. For plosive allophones, the onset was marked at the beginning of the closure – typically indicated by a drop in waveform amplitude and a loss of formant structure – while the offset was placed at the onset of modal voicing in the subsequent vowel, following any post-release interval, as seen in both waveform and spectrogram. Examples of these realizations are shown in § 4.1 below.
For each token, the duration of the target consonant was measured in milliseconds. All tokens were classified visually into nine allophonic categories, four for /v/ ([v], [v̥], [ʋ], and [b̪]) and five for /vː/ ([vː], [v̥ː], [v̝ː], [b̪ː], and [b̪̥ː]). As these allophones were unevenly distributed, they were subsequently grouped into three broader ‘strength’ classes – canonical, weakened, and strengthened based on their surface manner of articulation and voicing status – to ensure analytical robustness. For manner, this classification follows the assumption of a consonantal strength hierarchy, in which stops are considered ‘stronger’ than fricatives, and fricatives ‘stronger’ than approximants (Honeybone Reference Honeybone, de Carvalho, Scheer and Ségéral2008; Ewen & van der Hulst Reference Ewen and van der Hulst2001; Lass Reference Lass1984; Escure Reference Escure1977; Foley Reference Foley1977). As for voicing, categorizing devoiced realizations as either weakened or strengthened is less straightforward, as this remains a matter of debate. From a phonological perspective, turning a voiced obstruent into a voiceless one in intervocalic position – a context typically associated with lenition – has traditionally been regarded as a case of strengthening (e.g., Lass Reference Lass1984). Phonetically, this has been attributed to more favourable aerodynamic conditions for voicing in this environment (Westbury & Keating Reference Westbury and Keating1986). However, as noted in § 1.1, the aerodynamic conditions for sustaining voicing in geminates are unfavourable. On this basis, authors such as Kirchner (Reference Kirchner1998) and Bauer (Reference Bauer2008) have argued that maintaining voicing in geminates entails strengthening and therefore classify devoiced variants as weakened realizations. We remain agnostic as to whether devoiced forms are cases of weakening or strengthening from a theoretical standpoint. For the purposes of analysis here, however, we treat these variants as strengthened, based on the results of the preliminary acoustic analysis in § 4.3. In order to distinguish devoiced from voiced allophones objectively, we used REAPER (Talkin Reference Talkin2015) via MacReaper (Dallaston & West Reference Dallaston and West2018) to calculate the proportion of glottal closure instants (GCIs) – indicative of voicing – within the constriction duration. Tokens with 50% voicing or less following a visual check were classified as devoiced, and those with more than 50% as voiced, following Abramson & Whalen (Reference Abramson and Whalen2017). As a result, the canonical group consisted of [v(ː)] realizations; the weakened group included [ʋ]; the strengthened group encompassed [v̝ː], [b̪(ː)], and devoiced [v̥(ː)] and [b̪̥ː] forms.
As an additional preliminary step, we sought to verify quantitatively whether the allophones we identified fitted within each aforementioned strength category. To this end, we used well-established acoustic metrics of lenition, namely IntDiff and MaxVel (cf. Hualde & Nadeu Reference Hualde and Nadeu2012, among others, originally adapted from Kingston Reference Kingston, Colantoni and Steele2008). Following the methodology in Ennever et al. (Reference Ennever, Meakins and Round2017), after a first check using raw files, the sound files were band-pass filtered between 400 and 1200 Hz for this analysis, as this approach yielded more meaningful results than using unfiltered files. IntDiff refers to the raw difference between the minimum amplitude (or intensity) in the consonant and the maximum amplitude in the following vowel, measured in dB. The lower IntDiff, the less constricted (and therefore the more weakened) the obstruent. MaxVel relates to the maximum velocity of the amplitude contour between consonant and vowel. It is calculated as the highest first derivative – that is, the steepest rate of change – in the amplitude contour (in dB/ms) within the analysis window. Again, the lower MaxVel, the more weakened the obstruent. We used the rmsana function, part of the R package wrassp (Winkelmann et al. Reference Winkelmann, Bombien, Scheffers and Jochim2024), to obtain RMS (root mean square) amplitude contours. Consistent with Ennever et al. (Reference Ennever, Meakins and Round2017), we set the window size to 10 ms and the shift to 2.5 ms. To compute MaxVel, we divided the amplitude difference between two consecutive measurement steps by the step duration (2.5 ms) and identified the maximum positive value within points of consonant amplitude minima and vowel maxima.
3.5. Statistical analysis
We conducted three statistical analyses in R (R Core Team 2025). The first aimed to verify the grouping of allophones into three strength categories (cf. RQ2); the second modelled the likelihood of occurrence of each of these strength categories (RQ1); the third looked at the effect of length and strength on consonant duration (RQ3). For methodological consistency, all analyses used Bayesian regression via the brms package (Bürkner Reference Bürkner2017). This choice was motivated by the suitability of this method for the second analysis, as explained more in detail below.
For the first analysis, we set up two models, one with IntDiff (‘M1a’) and one with MaxVel (‘M1b’) as the dependent variable. The only fixed factor was allophone, with nine levels corresponding to the distinct segmental realizations observed in the corpus: [ʋ], [v], [vː], [b̪], [v̝ː], [v̥], [b̪ː], [v̥ː], and [b̪̥ː]. As a very small number of tokens were available for devoiced singleton [v̥] (only one token) and singleton plosive [b̪] (two tokens), these categories were collapsed with [v] for the purposes of statistical modelling. For each dependent variable, we fitted a Bayesian linear mixed-effects model with allophone as a fixed effect and speaker as a random intercept to account for repeated measures, yielding the formulae IntDiff ∼ allophone + (1 | speaker) and MaxVel ∼ allophone + (1 | speaker). Models assumed Gaussian likelihoods with weakly informative default priors on the intercept and slope coefficients; priors on standard deviations were half-Student-t distributed. Four Markov chains were run for 4,000 iterations each, with the first 2,000 iterations used as warm-up, yielding 8,000 post-warmup samples. Convergence was assessed via the potential scale reduction factor ( $\hat{R} < 1.01$
) and visual inspection of trace plots. Posterior estimates for each allophone level were obtained using the emmeans package (Lenth et al. Reference Lenth, Banfai, Bolker, Buerkner, Iago Giné-Vázquez, Jung, Love, Miguez, Piaskowski, Riebl and Singmann2025), yielding estimated marginal means (EMMs) with 95% credible intervals (CrIs) based on posterior draws. Pairwise comparisons between all levels were computed on the posterior samples, and differences were deemed credible
Footnote
4
if their 95% CrI did not cross or only marginally crossed zero. Where relevant, we also report Pr(Δ>0), or the posterior probability that the difference is greater than zero.
$\hat{R} < 1.01$
) and visual inspection of trace plots. Posterior estimates for each allophone level were obtained using the emmeans package (Lenth et al. Reference Lenth, Banfai, Bolker, Buerkner, Iago Giné-Vázquez, Jung, Love, Miguez, Piaskowski, Riebl and Singmann2025), yielding estimated marginal means (EMMs) with 95% credible intervals (CrIs) based on posterior draws. Pairwise comparisons between all levels were computed on the posterior samples, and differences were deemed credible
Footnote
4
if their 95% CrI did not cross or only marginally crossed zero. Where relevant, we also report Pr(Δ>0), or the posterior probability that the difference is greater than zero.
For the second analysis, to model the likelihood of occurrence of each ‘strength’ category, two categorical logistic regression models – one for /v/ and one for /vː/ – were fitted using Bayesian mixed-effects methods. These are referred to here as models ‘M2v’ and ‘M2vv’, respectively. Bayesian methods have been increasingly adopted in phonetic studies for modelling categorical outcomes with more than two levels (e.g., Dilley et al. Reference Dilley, Gamache, Wang, Houston and Bergeson2019; Kim Reference Kim2022), as traditional frequentist approaches often face limitations in estimating multinomial logistic regression models, particularly with complex random effects structures. Following recommendations by Vasishth et al. (Reference Vasishth, Nicenboim, Beckman, Li and Jong Kong2018) and Nalborczyk et al. (Reference Nalborczyk, Batailler, Loevenbruck, Vilain and Bürkner2019), as well as the methodology in Flego & Forrest (Reference Flego and Forrest2021), the brms package was chosen over alternatives such as MCMCglmm (Hadfield Reference Hadfield2010) due to its greater flexibility in model specification and its intuitive formula syntax, which mirrors that of the more widely used lmerTest and lme4 packages (Kuznetsova et al. Reference Kuznetsova, Brockhoff and Christensen2017). Separate models were fitted for /v/ and /vː/ to account for potential structural and distributional differences in the realization of these phonemes, including the fact that they exhibit distinct sets of allophones and may be differentially affected by the tested factors. The /v/ model was specified as a multinomial logistic regression with three outcome categories (canonical, strengthened, weakened), with ‘canonical’ set as the reference category. The /vː/ model was specified as a Bernoulli logistic regression with two outcome categories (canonical, strengthened), with ‘strengthened’ coded as the success level. Each model included fixed effects of regional variety (CI, RI, VI), stress condition (post-stress, pre-stress), phrase position (phrase-medial, phrase-final), and speaker sex (female, male), with random intercepts for speaker and lexical item. The formula was strength ∼ variety + stress condition + position + sex + (1 | speaker) + (1 | word) for each model. Four Markov chains were run for 4000 iterations each, with adapt_delta set to 0.995 and max_treedepth to 15 to ensure model convergence. Posterior estimates were visualized using conditional effects plots, and fitted probabilities were extracted to compute the average likelihood of each allophonic category across conditions. For both M2v and M2vv, we specified weakly informative priors to ensure convergence: intercepts were given Student-t(3, 0, 2.5) distributions, population-level effects Normal(0, 1), and group-level standard deviations Exponential(1). For the multinomial model, priors were applied separately to the strengthened vs. canonical and weakened vs. canonical contrasts. Four Markov chains were run for 4,000 iterations each, with the first 2,000 iterations used as warm-up, yielding 8,000 post-warmup samples. Convergence was assessed via the potential scale reduction factor ( $\hat{R} < 1.01$
) and visual inspection of trace plots.
$\hat{R} < 1.01$
) and visual inspection of trace plots.
For the third analysis, consonant duration (Cdur, in milliseconds) was analyzed using a Bayesian linear mixed-effects model (‘M3’). The fixed effects were length (singleton, geminate), strength (canonical, weakened, strengthened), phrase position (phrase-medial, phrase-final), stress condition (post-stress, pre-stress), sex (female, male), and regional variety (CI, RI, VI). Two- and three-way interactions between length, strength, and phrase position were also included to account for the combined effects of these factors on allophonic distribution found in the second analysis above (see § 4.4). Random intercepts were specified for speaker and word, with by-speaker random slopes for length to account for inter-speaker variability in the length contrast (see formula in Table 4). The model was fitted with a Gaussian likelihood. To set a weakly informative prior on the intercept centred on the observed scale of the data, the empirical mean (μ) and standard deviation (σ) of Cdur were computed from the dataset and inlined directly into the prior specification for reproducibility (Normal(μ, σ)). Priors on fixed effects were Normal(0, 50), while priors on random-effect standard deviations and the residual standard deviation were Student-t(3, 0, 40). Correlation parameters were given an LKJ(2) prior. These priors regularize estimates on the original millisecond scale without imposing strong constraints, ensuring that posterior distributions were primarily data-driven. Four Markov chains were run for 4,000 iterations each (1,000 warm-up, 3,000 post-warmup), yielding 12,000 posterior samples. Sampling control parameters were set to adapt_delta = 0.98 and max_treedepth = 12 to avoid divergent transitions and ensure efficient exploration of the posterior. Convergence was assessed via the potential scale reduction factor ( $\hat{R} < 1.01$
), effective sample size, and visual inspection of trace plots. Posterior predictive checks (pp_check) confirmed that the fitted model adequately captured the observed distribution of Cdur. To evaluate group-level effects of categorical predictors, we obtained posterior predictions for representative conditions directly from the fitted model (using posterior_epred). From these, we computed posterior means, 95% credible intervals, and pairwise contrasts (expressed as differences of posterior predictions).
$\hat{R} < 1.01$
), effective sample size, and visual inspection of trace plots. Posterior predictive checks (pp_check) confirmed that the fitted model adequately captured the observed distribution of Cdur. To evaluate group-level effects of categorical predictors, we obtained posterior predictions for representative conditions directly from the fitted model (using posterior_epred). From these, we computed posterior means, 95% credible intervals, and pairwise contrasts (expressed as differences of posterior predictions).
4. Results
This section begins with illustrative examples of the allophonic variants of /v/ and /vː/ (§ 4.1), followed by a descriptive overview of their distribution across the three strength categories (§ 4.2). The results are then presented in three parts: (i) a preliminary statistical analysis validating the categorization of variants into strength classes (§ 4.3), (ii) a statistical analysis of categorical strength distributions (§ 4.4), and (iii) a separate analysis of the duration patterns associated with each strength class (§ 4.5).
4.1. Illustrations of variants
RQ1 asked what allophones of /v/ and /vː/ occurred in the data and how they were distributed across target conditions. Before turning to a quantitative analysis, Figures 3 and 4 illustrate representative examples of allophonic variants observed across the corpus. As described above, canonical [v(ː)] realizations exhibit low-frequency periodicity in the waveform and a visible voice bar across the constriction, but no formant structure, with frication noise present across the frequency spectrum. Approximant [ʋ] variants show a lower-amplitude, vowel-like waveform, with visible lower formants (F1 and F2) during the constriction phase. Plosive [b̪(ː)] realizations are characterized by low-frequency periodicity, a clear voice bar, absence of frication noise during constriction, a burst at release, and a short post-release phase. Finally, more constricted [v̝(ː)] variants typically display a voice bar and weaker frication noise than canonical forms, with noise energy concentrated near the offset of constriction, reflecting a release of narrowing rather than a complete articulatory closure. In addition, a few devoiced fricative [v̥(ː)] and plosive [b̪̥ː] realizations were also noted.
Annotated examples of allophonic variants of /v/ embedded in /ˈbeve/ (‘s/he drinks’) from a VI (left and middle panel) and a CI (right panel) speaker.

Annotated examples of allophonic variants of /vː/ embedded in /daˈvːero/ (‘really’), each from a different RI speaker.

4.2. Descriptive summary of allophonic distributions
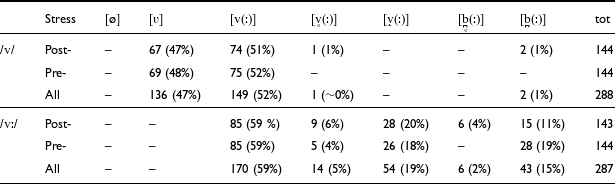
Table 1 details the allophonic distributions of /v/ and /vː/ across pre- and post-stress tokens, with regional varieties pooled. For singleton /v/, canonical short voiced fricative [v] represents only 52% (149/288) of the tokens, distributed similarly across stress conditions, while a notable 47% (136/288) of cases were realized as approximant [ʋ], a very small fraction (2/288, or 1%) as plosive [b̪], and in only one case as a devoiced [v̥]. We found no instances of full deletion [∅]. For geminate /vː/, 59% (170/287) of total tokens surfaced as canonical [vː], while 36% (103/287) of occurrences showed increased constriction, with 19% (54/287) realized as more constricted fricative [v̝ː] and 17% (49/287) as plosive [b̪ː]. 20 out of 287 (7%) /vː/ tokens showed substantial devoicing: 14 surfaced as long devoiced fricatives [v̥ː] and 6 as plosive-like [b̪̥ː].
Overall counts and rates of occurrence (%) of allophonic variants for /v/ and /vː/ in the corpus.

Variants are indicated with decreasing degree of articulatory lenition from left to right.
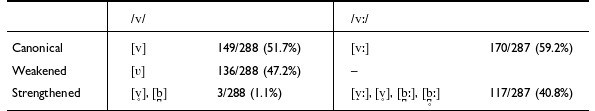
As outlined in Section 3.4, the allophones listed in Table 1 were tentatively grouped into three ‘strength’ categories for analysis. Table 2 presents the distribution of individual allophones within each category for /v/ and /vː/.
Distribution of allophones by strength category for /v/ and /vː/.

4.3. Statistical results 1 – Diagnostic analysis of variant categorization
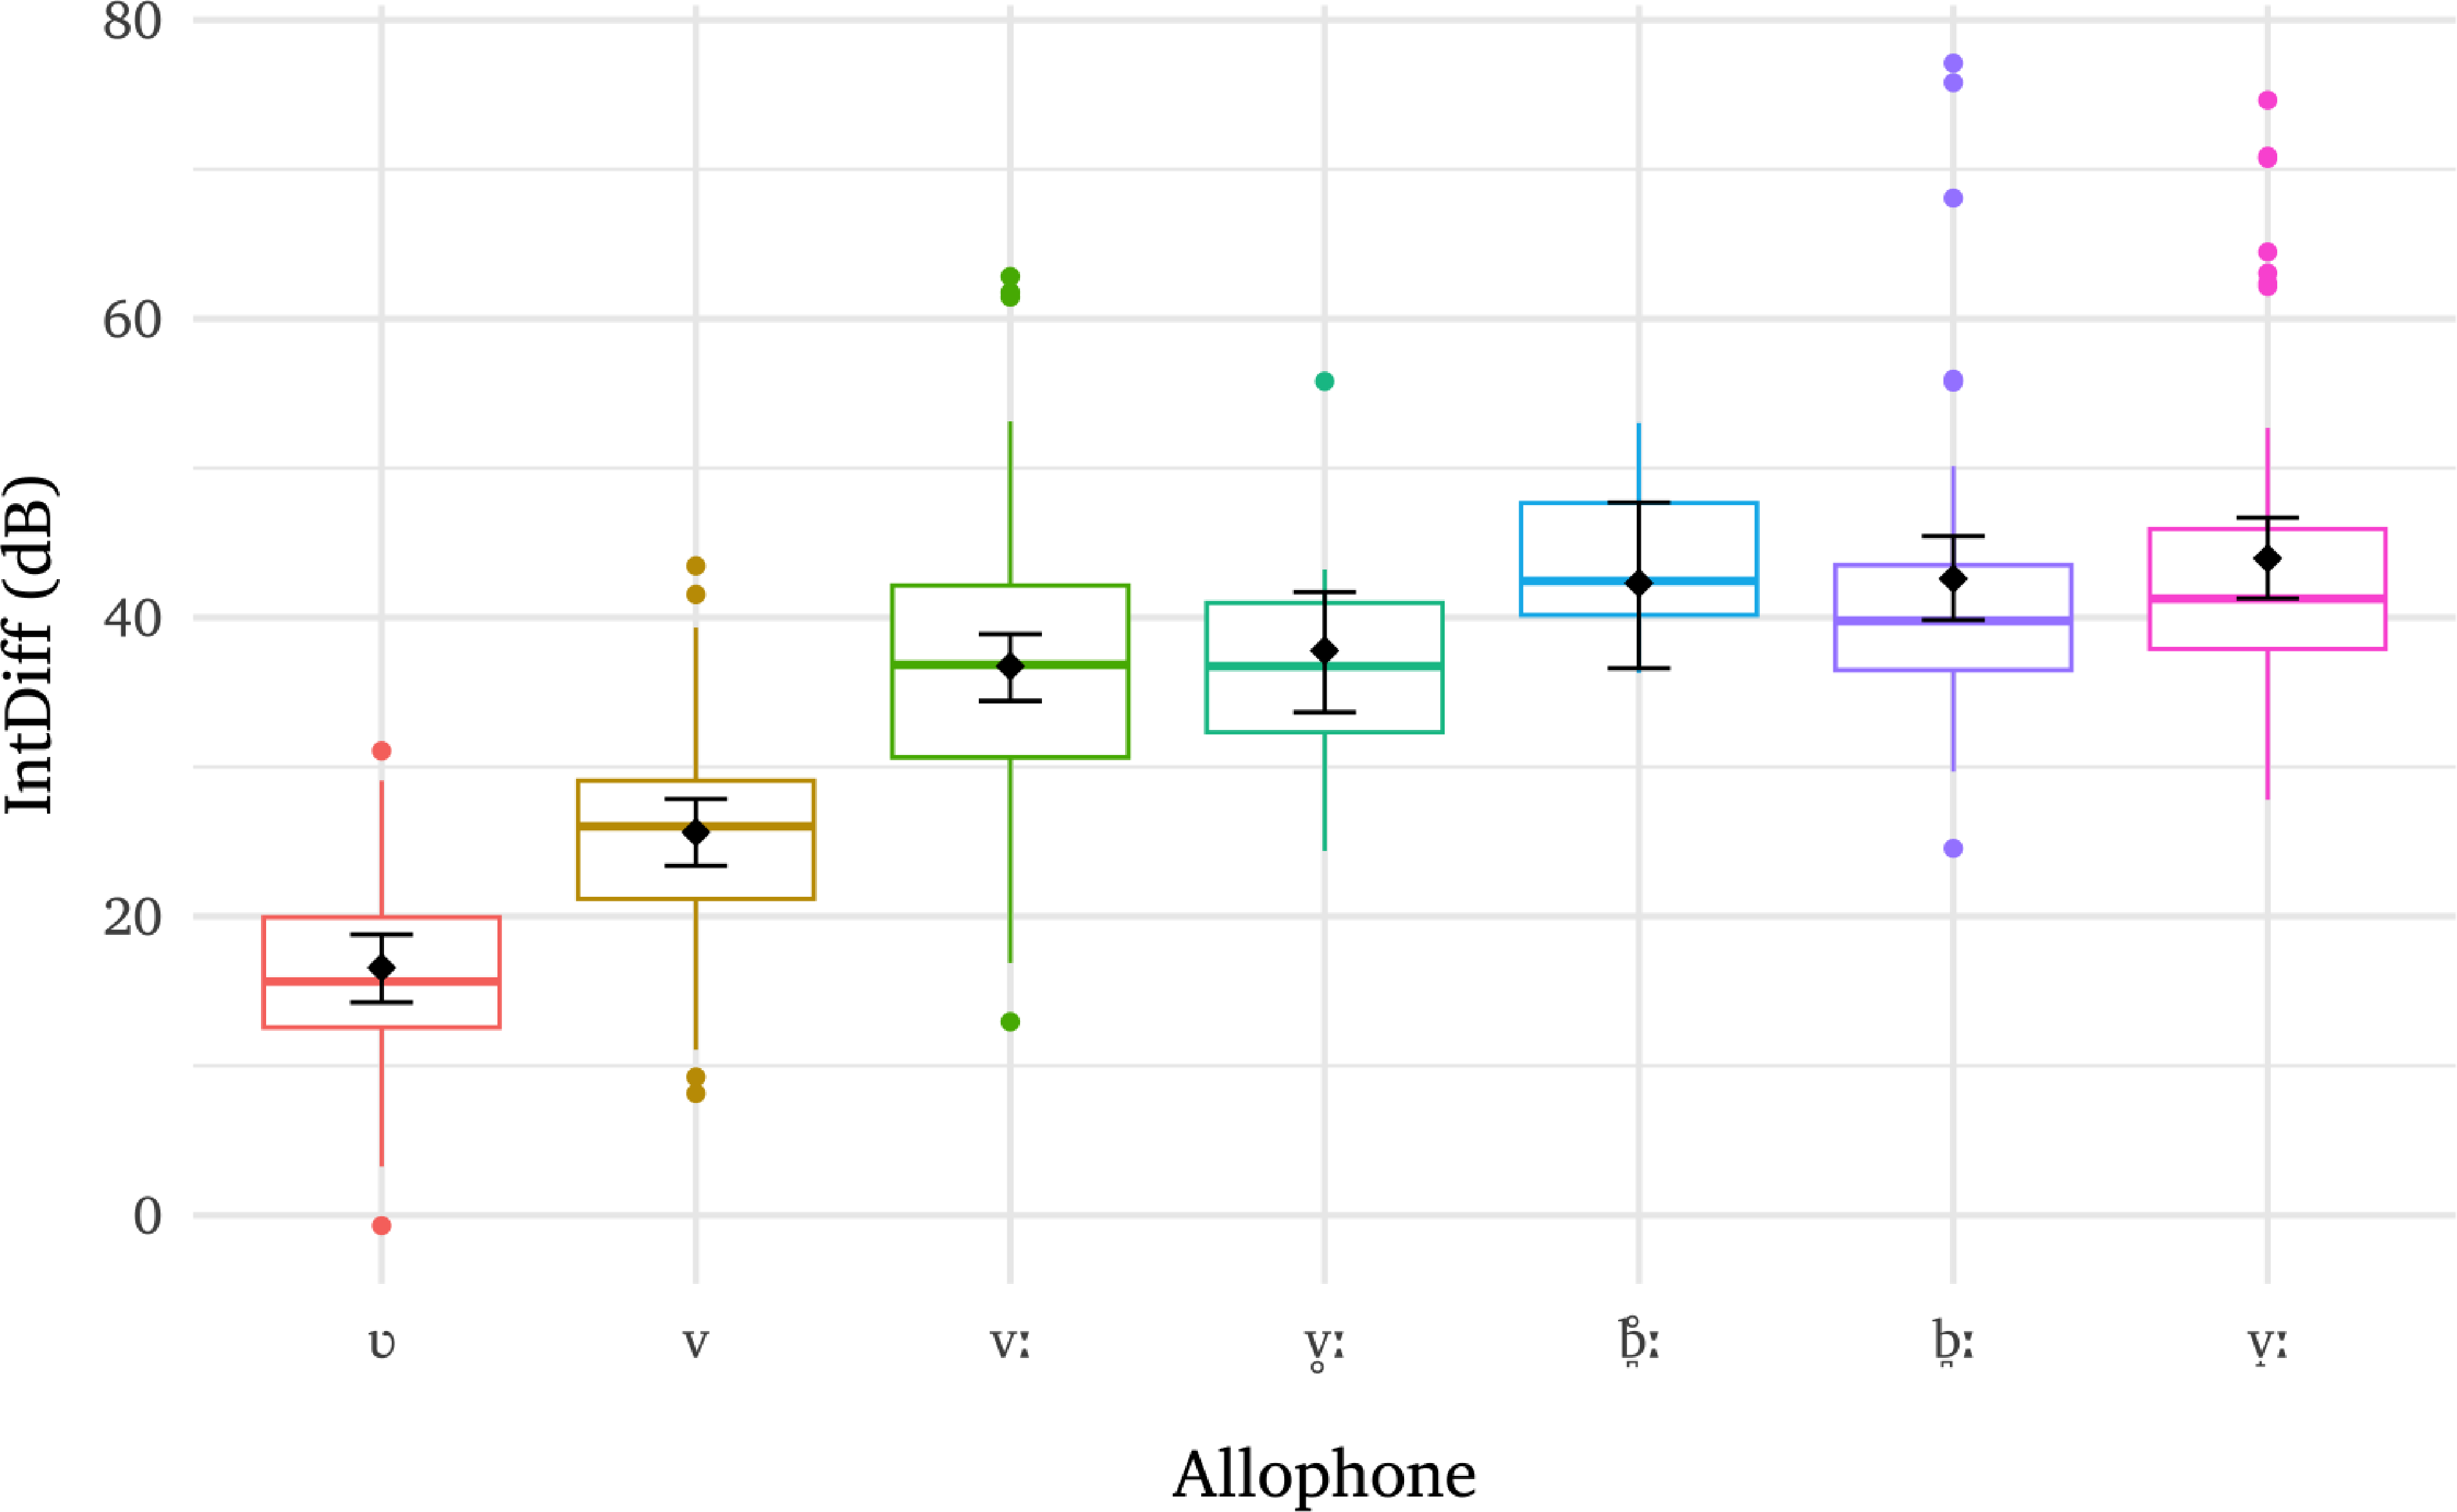
Moving on to RQ2, after an initial qualitative grouping of variants, we now assess whether these differ in their IntDiff and MaxVel values (cf. § 3.4) according to their qualitatively assessed strength category. We provide descriptive plots showing raw data distributions overlaid with estimated marginal means (EMMs) with 95% credible intervals (CrIs), ordered by increasing EMM.
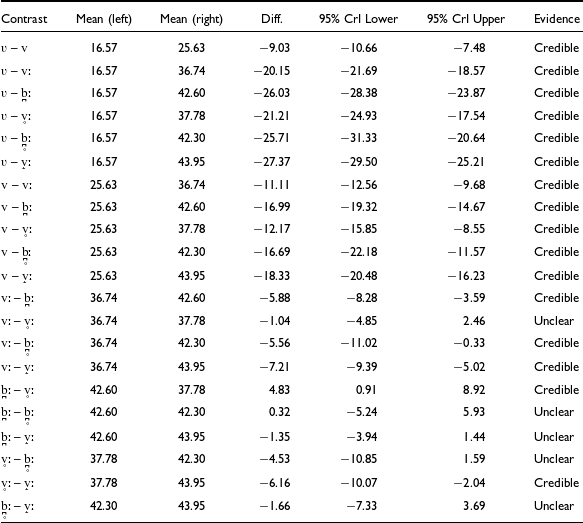
For IntDiff, model M1a revealed systematic differences between allophones on this parameter, as evidenced by posterior estimates of marginal means reported in the Appendix (Table A1). Figure 5 illustrates a visual summary of the results. The approximant singleton [ʋ] has the lowest mean (16.57 dB), followed by the canonical singleton [v] (25.63 dB), with a statistically credible difference of 9.03 dB (cf. Table A1). The canonical geminate [vː] ranks next (36.74 dB), differing credibly from [v] by +11.11 dB. The devoiced geminate [v̥ː] shows a marginally higher EMM than [vː] (37.78 dB), with a non-credible difference of +1.04 dB, suggesting these two variants may be grouped together in terms of IntDiff patterns. The devoiced geminate plosive [b̪̥ː] follows (42.30 dB), exceeding [v̥ː] by +4.53 dB, although not credibly, likely due to its wider CrI range resulting from lower token frequency. Its more frequent voiced counterpart [b̪ː] (42.50 dB) is, however, credibly higher than [v̥ː] (+4.83 dB). The highest EMM is observed for [v̝ː] (43.95 dB), which does not differ credibly from either [b̪ː] or [b̪̥ː].
Raw IntDiff distributions for each allophone, overlaid with model-predicted means (black diamonds) and corresponding 95% CrIs (error bars).

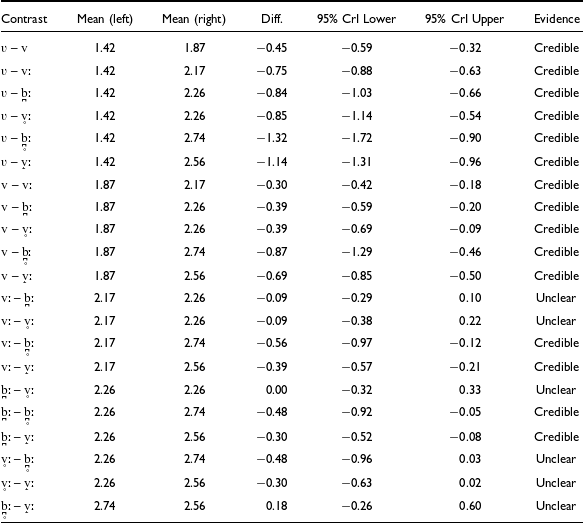
For MaxVel, model M1b also indicated systematic differences between allophones (cf. Table A2 in the Appendix), which are summarized in Figure 6. The EMMs increase from the approximant singleton [ʋ] (1.42 dB/ms; lowest) to the canonical singleton [v] (1.87 dB/ms; +0.45, a credible difference), then to the canonical geminate [vː] (2.17 dB/ms; +0.30 compared to [v], again a credible difference). A mid-range cluster follows – [b̪ː] and [v̥ː] – whose EMMs are equivalent (both at 2.26 dB/ms) and both credibly different (+0.39) from [v] but not from [vː]. Above these is the more constricted geminate [v̝ː], showing a higher EMM (2.56 dB/ms; +0.30), which is, however, not statistically different from [v̥ː] but is different from [b̪ː]. Finally, the devoiced geminate plosive [b̪̥ː] is highest overall (2.74 dB/ms). Albeit not credibly different from [v̝ː] or [v̥ː], it is statistically different from [b̪ː] (+0.48) and preceding variants.
Raw MaxVel distributions for each allophone, overlaid with model-predicted means (black diamonds) and corresponding 95% CrIs (error bars).

Overall, the results for both IntDiff and MaxVel support the view that approximants in this study are weaker than canonical fricatives in singleton form, and that canonical geminates tend to be weaker than more constricted variants. For singletons, [ʋ] consistently shows lower values than [v], with credible differences for both measures. Among geminates, [vː] yields lower values than more constricted categories, with [v̝ː] and the plosive variants ([b̪ː], [b̪̥ː]) generally occupying the upper end of the scale. These results corroborate the categorization of [ʋ] as weakened, [v, vː] as canonical, and [v̝ː, b̪ː, b̪̥ː] as strengthened forms, at least from an acoustic viewpoint. The classification of devoiced geminate [v̥ː] is less straightforward, as it patterns with the canonical variant in terms of IntDiff and also with more constricted ones in terms of MaxVel. Since there is some indication of increased strength for this allophone, and for consistency with [b̪̥ː], we include it as part of the strengthened category. Finally, we could not test whether the very few singleton tokens showing increased constriction can be classified as strengthened, but we will assume this to be the case as raw means for [b̪] (32.16 dB for IntDiff and 3.07 dB/ms for MaxVel) are considerably higher than those reported above for [v] (25.73 dB and 1.87 dB/ms). As for devoiced [v̥], we believe that a single token does not allow any type of categorization.
4.4. Statistical results 2 – Allophonic strength distributions
We now return to RQ1, having verified the classification of allophonic variants into their respective strength categories. Table 3 shows the results of model M2v for /v/ and model M2vv for /vː/ combined (cf. § 3.5). Since the distributions presented in Table 2 show a strong tendency for /v/ to exhibit either canonical or weakened forms, and no weakened forms for /vː/, we focus our interpretation on the canonical vs. weakened contrast for /v/, and on the canonical vs. strengthened contrast for /vː/. Estimates for the less frequent categories, which yielded unstable or non-credible effects, are not discussed here.
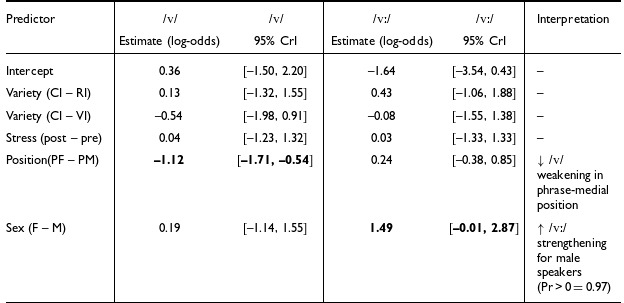
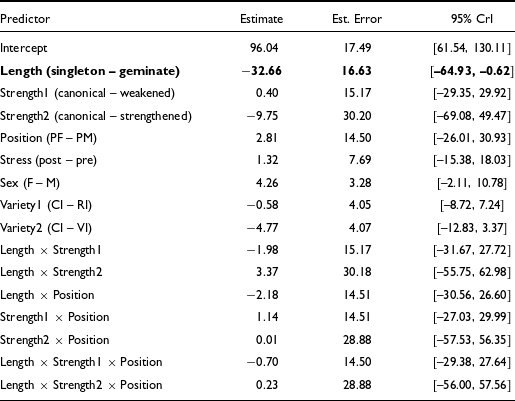
Bayesian multinomial and Bernoulli logistic regression (models M2v and M2vv) results. Effects whose 95% CrI exclude zero are shown in bold.

CrI = credible interval. Fixed effects estimates from Bayesian multinomial logistic regression models for /v/ (weakened vs. canonical) and /vː/ (strengthened vs. canonical). The reference level for both models is ‘canonical’. Credible effects (95% CrI excludes or only marginally touches 0) are shown in bold. Only the contrasts relevant to each phoneme are reported.
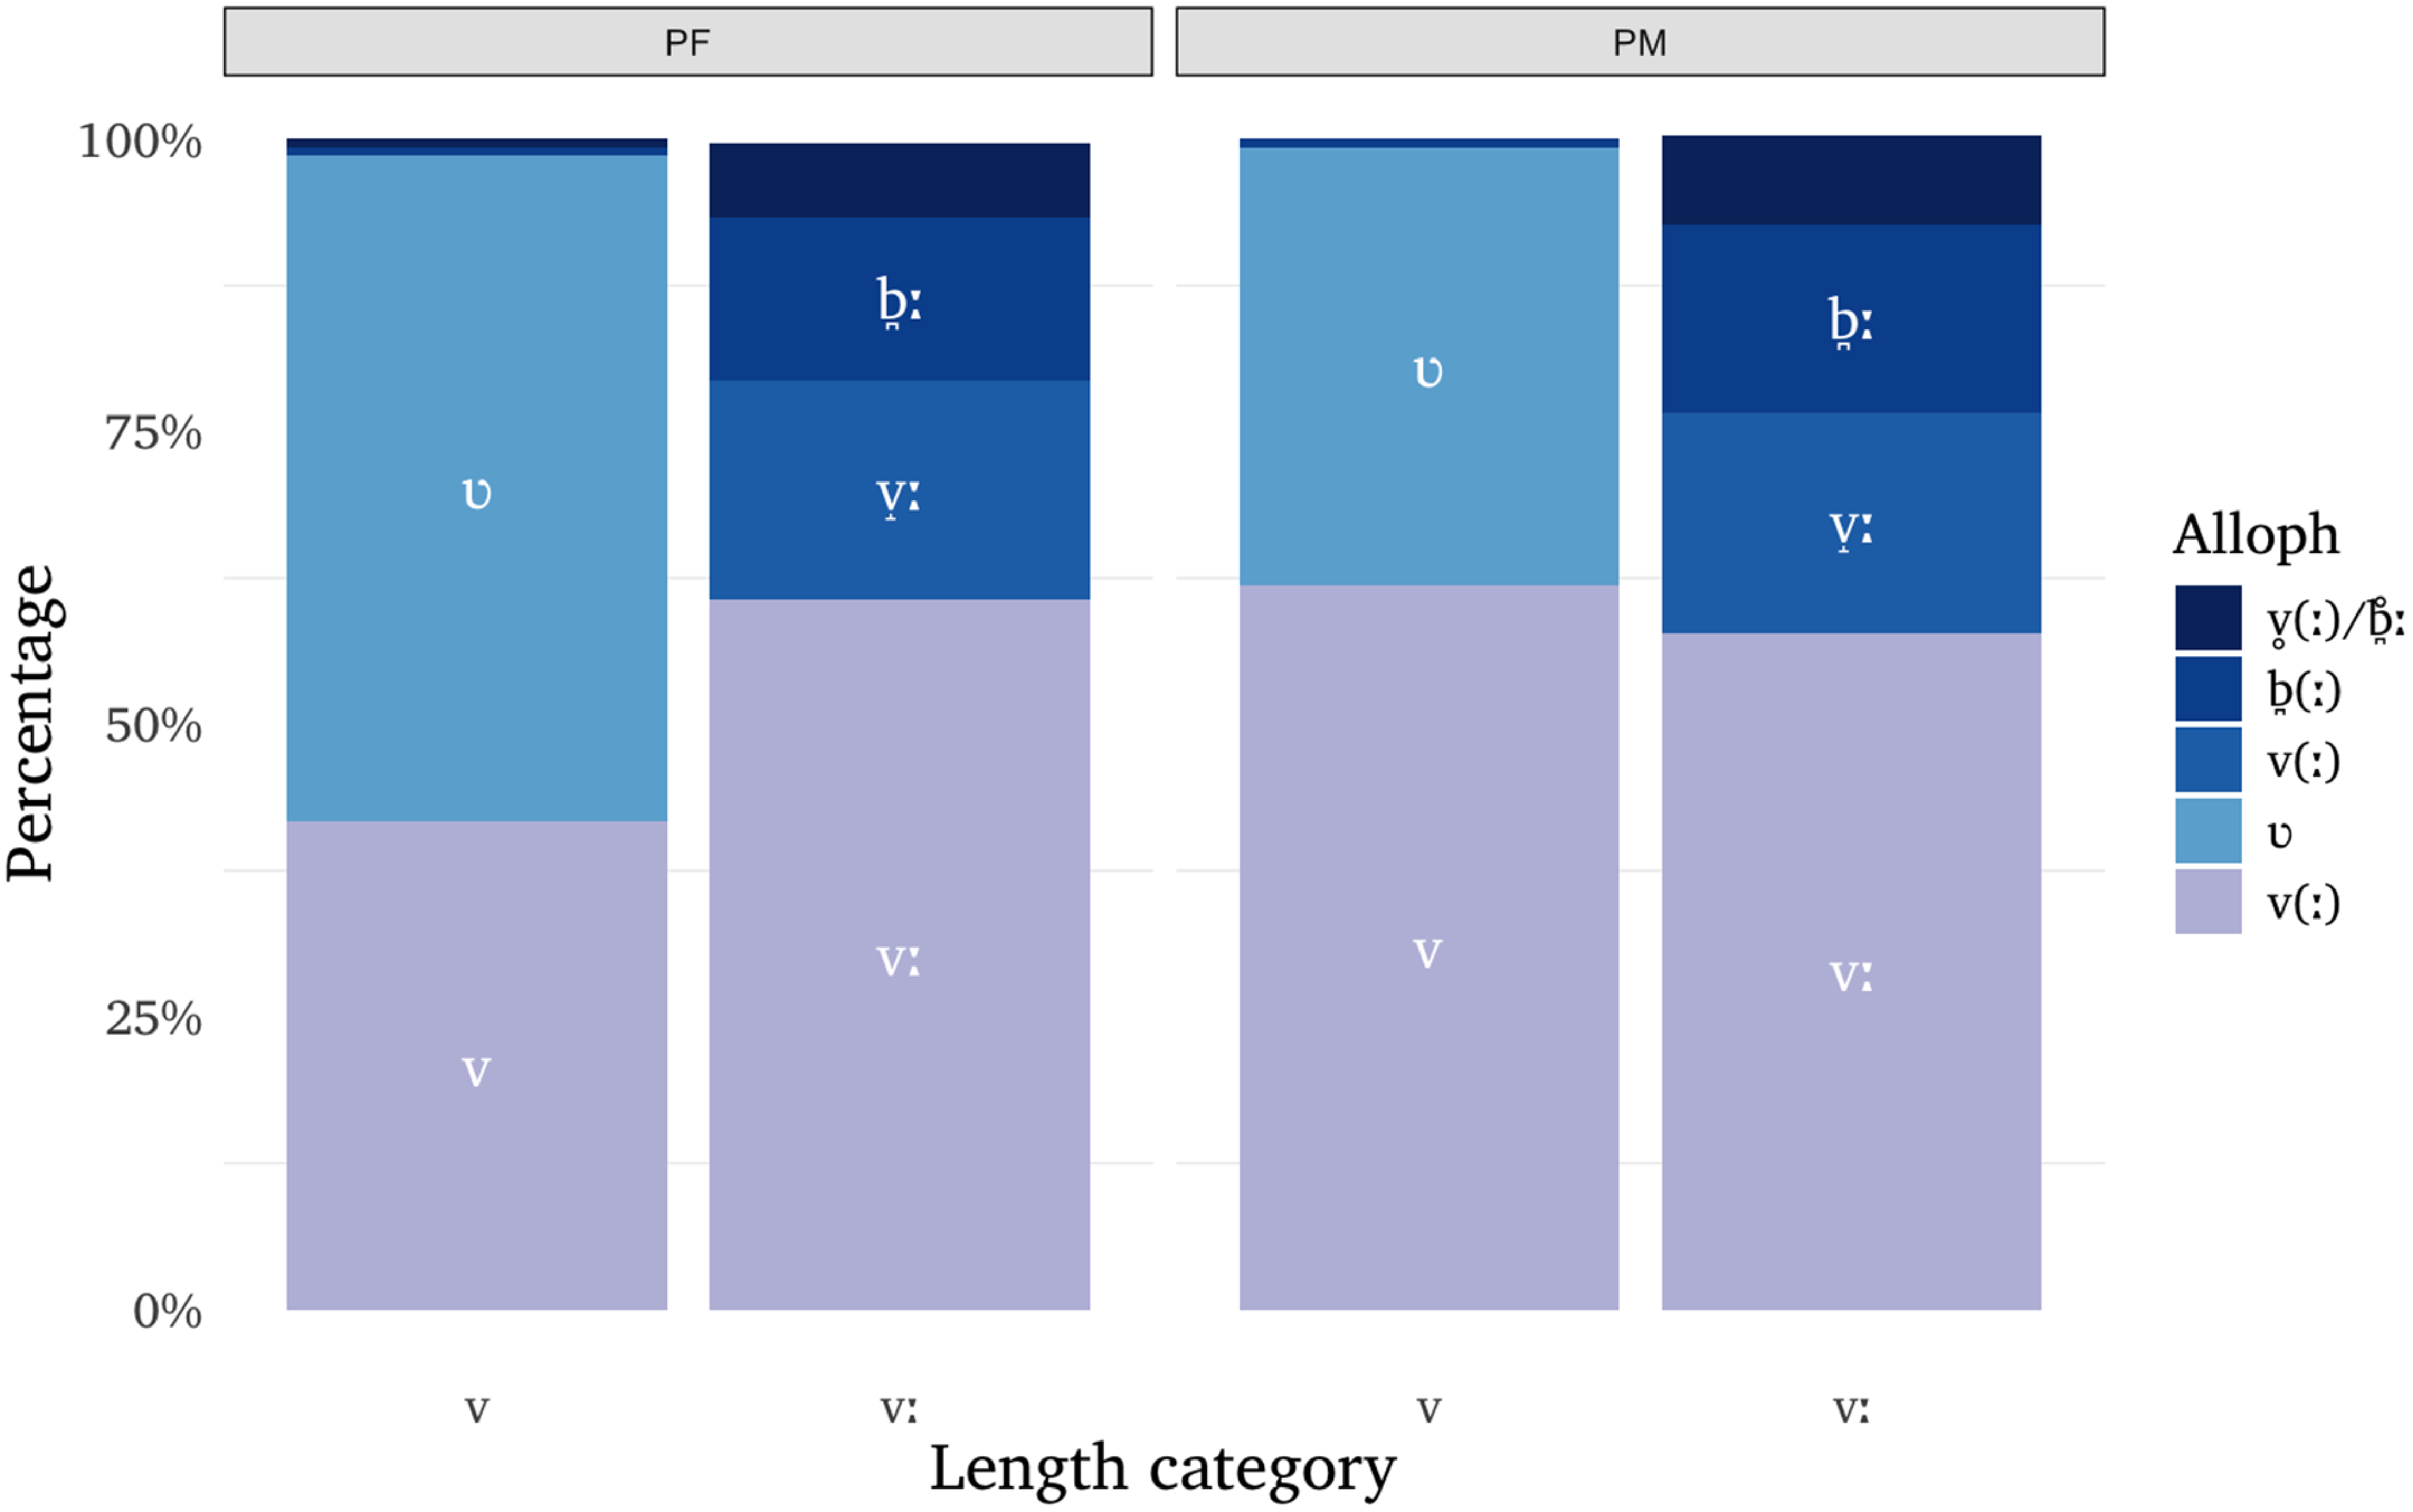
Distribution of allophonic variants of intervocalic /v/ and /vː/ across phrase-final (PF) and phrase-medial (PM) positions, expressed as percentages. All other conditions are pooled.

As can be seen, there is no statistically credible effect of regional variety or stress condition on either model, suggesting that these factors do not influence the allophonic distributions in the data. Conversely, position in the phrase has an effect on /v/ and speaker sex exerts a strong influence on /vː/. Specifically, phrase-medial tokens of /v/ are less likely to be weakened, while male speakers are considerably more likely than females to produce strengthened variants of /vː/. The posterior probability that the effect of sex on /vː/ is positive is 0.97, corresponding to a ∼40 percentage-point increase in the probability of strengthened realizations for males relative to females. Each of these phonemes is addressed below.
For /v/, Table 3 shows that position in the phrase is the only significant predictor. Specifically, /v/ in phrase-final words tended to be realized as a weaker [ʋ] more often than in phrase-medial positions, with model-estimated probabilities of weaker realizations equalling 56.2% for the former and 38.4% for the latter. This effect of position in the phrase on the allophonic variation of /v/ can be observed in Figure 7 showing raw data, while the same figure shows that distributions are similar for /vː/ across phrase-final and phrase-medial categories.
For /vː/, Table 3 demonstrates that the only significant effect among the tested factors is that of speaker sex, with a much higher predicted probability for male speakers to produce strengthened forms of /vː/ (61.3%) as compared to female speakers (20.5%). This pattern for /vː/ is clearly shown in Figure 8, while for /v/ the distributions do not differ statistically between male and female speakers.
Distribution of allophonic variants of intervocalic /v/ and /vː/ across female and male speakers, expressed as percentages. All other conditions are pooled.

Bayesian linear mixed-effects regression (model M3) results. Effects whose 95% credible intervals exclude zero are shown in bold.

Formula: C duration ∼ length * strength * position + stress condition + speaker sex + regional variety + (1 + length | speaker) + (1 | word). CrI = credible interval; PM = phrase medial; PF = phrase final. Predictors are coded with treatment contrasts. Reference levels are: singleton (gemination), canonical (strength), phrase-final (position), post-stress (stress condition), female (sex), and CI (regional variety).
4.5. Statistical results 3 – durational patterns
RQ3 addressed whether non-canonical ‘strength’ variants differ durationally from canonical forms. As shown in Table 4, Model M3 (cf. § 3.5) found length to be the only credible predictor: posterior predictions indicated that /vː/ was longer than /v/, with an estimated average difference of 75 ms across speakers and conditions (/vː/: 138.5 ms, 95% CrI [105.8, 166.9]; /v/: 63.9 ms, 95% CrI [36.1, 95.9]; Δ = 74.6 ms, 95% CrI [38.3, 102.5], Pr(Δ > 0) = 0.995). None of the other predictors yielded credible effects on duration, either as main factors or in interactions.
This robust effect of length is shown in Figure 9, plotting raw data: /vː/ is consistently longer than /v/ on average across all strength categories. By contrast, no clear effect of consonantal strength emerges. Even the comparison between canonical [v] and weakened [ʋ] reveals only a marginal difference, with average durations of 64 ms (standard deviation = 14 ms) and 53 ms (standard deviation = 12 ms), respectively. In other words, whether /v/ or /vː/ undergo strengthening or lenition does not appear to influence their duration. This pattern holds both within and across gemination categories.
C duration distributions by consonantal length and strength. All other conditions are pooled.

5. Discussion
This study investigated the allophonic distribution and durational patterns of intervocalic /v/ and /vː/ – two segments that are known to pose articulatory challenges – in three regional varieties of Italian. While considerable allophonic variation linked to articulatory weakening has previously been reported for singleton /v/ in intervocalic position, little is known about its geminate counterpart /vː/, which remains phonetically underexplored cross-linguistically, likely due to its typological rarity.
In relation to Research Question 1 (RQ1), concerning the allophonic variation of these phonemes, the results show that intervocalic /v/ is frequently realized as an approximant [ʋ], accounting for nearly half of all tokens across the speaker sample with no significant cross-regional differences in this proportion, while it surfaced as a plosive in only two cases and as a devoiced fricative in only one instance. These findings are largely in line with our predictions in § 2, although no deletions occurred. Moreover, the plosive and devoiced variants, despite being infrequent, were unexpected for short /v/. We interpret these few occurrences are possible cases of overshooting (cf. § 1.1) due to hyperarticulation given the controlled nature of the experimental task.
The frequent occurrence of [ʋ] is consistent with earlier studies of specific regional varieties of Italian (e.g., Marotta Reference Marotta, Albano Leoni and Giordano2005; Trumper & Maddalon Reference Trumper and Maddalon1982) but the present study expands on these by showing that frequent approximant realizations are not confined to a particular dialectal area. Rather, they appear to be a more general feature of Italian speech, potentially reflecting a widespread lenition process affecting most voiced singleton obstruent phonemes in intervocalic contexts (cf. for instance Hualde & Nadeu Reference Hualde and Nadeu2012 on Roman Italian). This finding is also consistent with the observation by Ferrero et al. (Reference Ferrero, Genre, Boë and Contini1979) of reduced frication noise in the production of /v/ in Italian.
Among the tested predictors, only position within the intonational phrase had a significant effect on /v/: approximant forms were more frequent when target words were uttered in phrase-final than in phrase-medial position. Although this finding might seem surprising under the assumption of phrase-final lengthening (cf. Cho Reference Cho2016; Fletcher Reference Fletcher, Hardcastle, Laver and Gibbon2010), which in turn should lead to less frequent segment lenition (e.g., Katz & Pitzanti Reference Katz and Pitzanti2019), our data show that phrase-final tokens are not significantly longer than phrase-medial ones. This can be accounted for by the observation that phrase-final lengthening predominantly affects the rhyme portion (i.e., the nucleus and any coda) of syllables directly adjacent to the phrase boundary and of stressed syllables (Turk & Shattuck-Hufnagel Reference Turk and Shattuck-Hufnagel2007; also cf. Petrone et al. Reference Petrone, D’Imperio, Lancia, Fuchs, Campbell, Gibbon and Hirst2014 for Italian specifically), whereas the target /v/ segments in the present study always occurred in onset position (i.e., /ˈbe.ve/, /do.ˈve.re/).
The behaviour of geminate /vː/ showed a degree of articulatory variability that, while not entirely unexpected (cf. § 2), was nonetheless substantial. Although the majority of tokens were produced as canonical [vː], over one-third displayed increased constriction, with a notable 17% across all tokens realized as labiodental plosives, with visible occlusion, release, and post-release phases. Furthermore, twenty tokens, accounting for around 7% of total realizations, exhibited substantial devoicing. This is in contrast with singleton /v/, for which this devoicing was almost never observed, as also previously noted by Pape & Jesus (Reference Pape and Jesus2015) for Italian. Again, variation in /vː/ did not pattern with region, suggesting that the observed differences are not variety-specific. Lexical factors, such as word frequency or phonological structure, are also unlikely to account for the variation, as the two target words differ on both dimensions. Davvero is substantially more frequent than bevve, whose frequency is also regionally conditioned;Footnote 5 the words also differ in onset composition, with /d/ and /b/ respectively, ruling out any potential segmental harmony effects. Instead, the observed variation likely reflects aerodynamic and articulatory challenges associated with sustaining voicing and frication over a longer segmental duration (Ohala Reference Ohala and MacNeilage1983; Shadle Reference Shadle, Hardcastle, Laver and Gibbon2010). Speaker sex was the only tested factor to influence /vː/ realization, with male speakers more likely to produce constricted or plosive-like variants than female speakers, possibly pointing to sociophonetic differences which need however to be tested further.
Importantly, these results call into question the principle of geminate inalterability (e.g., Hayes Reference Hayes1986; Kirchner Reference Kirchner2000). In its theoretical sense, the term refers to the resistance of geminate consonants to lenition processes – a pattern that is indeed borne out in the present data. At the same time, however, inalterability also carries the implication that geminates remain invariant in their realization, which is not supported here. While /vː/ does not lenite, its realizations are far from uniform: non-canonical tokens frequently display acoustic evidence of increased constriction, pointing to strengthening rather than weakening. All in all, the variability observed for /vː/ may be interpreted as a by-product of maintaining contrastively long durations, as also discussed for Research Question 3 (RQ3) below, especially under articulatory conditions that make long voiced fricatives difficult to produce. Crucially, this variability cannot be observed when focusing on voiceless obstruents, for which sustaining longer durations presents fewer articulatory challenges, and which have formed the primary basis for theoretical accounts of geminate inalterability such as Kirchner (Reference Kirchner2000).Footnote 6
With respect to strengthening and weakening, Research Question 2 (RQ2) asked whether the allophones observed in this study could be grouped into strength categories, with approximant variants being classified as weakened and more constricted forms – including plosive realizations – as stronger compared to canonical forms. The acoustic analysis of strength measures (IntDiff and MaxVel) broadly confirmed this classification, while also revealing patterns specific to individual allophones. Whereas approximant realizations, only observed for singleton /v/, were clearly separate from canonical ones, more constricted variants often patterned together, suggesting that they may be different manifestations of the same phenomenon. In particular, [v̝ː], [b̪ː], and [b̪̥ː] displayed similar mean IntDiff values, while for MaxVel, [v̝ː] was slightly higher than [b̪ː], yet statistically equivalent to devoiced [b̪̥ː]. Acoustically, this similarity is unsurprising, as the analysis targeted a frequency band (400–1200 Hz) that excluded frication noise but also most of voicing-related energy (cf. Ennever et al. Reference Ennever, Meakins and Round2017). Qualitatively, however, the presence of high-frequency noise clearly distinguishes [v̝ː] from [b̪ː], which we believe are best understood as part of a strength-conditioned continuum spanning canonical fricative to fully plosive realizations. The articulatory-based reason we give for this is that we expect /vː/ to be inherently characterized by a high degree of constriction, as also shown through real-time magnetic resonance imaging (rt-MRI) data by Fujimoto et al. (Reference Fujimoto, Shinohara and Mochihashi2023) for the Ikema dialect of Miyako Ryukyuan (see also Payne Reference Payne2006 and Burroni et al. Reference Burroni, Maspong, Benker, Hoole, Kirby, Fougeron and Perrier2024 for articulatory evidence of greater constriction in Italian coronal and bilabial geminates). This increased constriction, paired with a reduced intraoral pressure buildup due to voicing (cf. § 1.1), forms a challenging barrier for airflow to pass through, which may result in the observed acoustic realizations.
As for RQ3, focusing on consonant duration, the analysis showed that consonantal strength had no significant effect on this parameter. Despite clear differences in manner of articulation – for example, between fricative and approximant /v/ variants – segmental duration tended to remain stable within each length category. Although this finding runs contrary to our expectation of shorter lenited realizations (cf. § 2), it provides evidence that Italian speakers maintain duration as the primary cue to the singleton-geminate contrast, even when the degree of supraglottal constriction or voicing properties fluctuate. The lack of durational impact from allophonic variation supports the view that segment length in Italian is phonologically robust cross-regionally and actively maintained across a range of phonetic conditions, which nevertheless can help enhance the length contrast.
6. Conclusion
Taken together, the above findings suggest that intervocalic lenition in Italian operates independently of regional boundaries in the case of singleton /v/, although a larger speaker pool for each regional variety is necessary to substantiate this conclusion. At the same time, the data reveal that geminate /vː/ is not uniformly stable in surface form, and that more constricted forms, e.g., [b̪ː], rather than lenited ones, may emerge as a result of the inherent strength, coupled with the aerodynamic demands, of long voiced fricatives. Nevertheless, articulatory investigations of the type conducted by Fujimoto et al. (Reference Fujimoto, Shinohara and Mochihashi2023) for Miyako Ryukyuan are required to confirm these hypotheses for Italian.
These findings suggest a need to refine our understanding of geminate inalterability, particularly in the context of marked segments such as /vː/, and call for further research on the interplay between segmental duration, constriction degree, and voicing in the phonetic realization of length contrasts. At the same time, our results have also uncovered a new allophone, i.e. [b̪ː], not previously reported for any variety of Italian (nor indeed for any other language we are currently aware of). We think this omission is most likely due to the typological rarity of /vː/, and a lack of acoustic investigation more generally of voiced labiodental fricatives.
Regarding possible limitations, the use of read speech may have reduced the degree of naturalistic variation observable in spontaneous discourse. Furthermore, although the sample size (18 speakers in total, with six per regional variety) is consistent with experimental standards, a larger and more demographically diverse pool would allow for more robust generalizations, particularly in relation to sociophonetic factors such as regional variety, speaker sex or age.
Future research should address these limitations by investigating the same phenomena in spontaneous or semi-spontaneous speech, testing a broader range of regional varieties, and exploring the contribution of additional factors such as speech rate and style, or vowel context. Moreover, the observed sex differences in /vː/ production merit further sociophonetic inquiry to determine whether they can be generalized to a broader population.
Acknowledgements
We are grateful to the participants in this study and to the two anonymous reviewers for their insightful feedback.
Appendix A
Pairwise comparisons of mean IntDiff values between levels for Model M1a. Statistically credible differences are indicated by 95% credible intervals that do not include zero.

Pairwise comparisons of mean MaxVel values between levels for Model M1b. Statistically credible differences are indicated by 95% credible intervals that do not include zero.


 Open access