

Too high salt (Na) intakes are associated with the risk of elevated blood pressure and, as a consequence, increased risk of CVD. Even a modest reduction of salt intake at the population level will result in a decrease in blood pressure and thus a prevention of CVD(Reference He and Macgregor1, Reference He and MacGregor2). A maximum salt intake level of 5–6 g/d is recommended for adults(3–6). This recommendation should not be seen as an optimum or tolerable upper intake level, but rather as a feasible target. For the long term a maximum salt intake level of 3 g/d is proposed(Reference He and MacGregor7). In The Netherlands, similar to other countries, the current salt intake is too high. For adults the mean salt intake is estimated at about 8–10 g/d(Reference Van den Hooven, Fransen and Jansen8–Reference C, A and J11) and for children (aged 5–10 years) the mean salt intake is estimated at about 6 g/d(Reference Schreuder, Bokenkamp and van Wijk12). Authorities and food industries in several European countries, and also in The Netherlands, have started initiatives to reduce the population salt intake(13, 14).
In many countries, including The Netherlands, iodine levels naturally present in the diet are not adequate(Reference M, B and I15, Reference van Rees-Wortelboer, Schroder-van der Elst and Lycklama16). To prevent iodine-deficiency disorders, iodised salt is used. Reduction of salt will therefore not only result in the desired reduced salt intakes but also in unwanted reduced iodine intakes. Currently, the iodine status of the Dutch population is adequate(Reference M, B and I15, 17, Reference Wilson-Van den Hooven, Fransen and Ris-Stalpers18), but this may become inadequate with reductions of salt intake. Regular monitoring of the iodine status in the population is a good measure to identify an existing potential problem. In contrast, modelling the iodine intake for a population presuming changes in salt intake can give quantitative insight into the potential problems beforehand and may help policy makers at an early stage to adapt their iodine policy. To our knowledge no studies have been published quantifying the effect of salt reduction strategies on the population iodine intake. We recently developed a simulation model which accurately estimates the total iodine intake of the Dutch population using data from the Dutch National Food Consumption Survey(Reference Verkaik-Kloosterman, van 't Veer and Ocké19). In the present study we applied this model to estimate the habitual total iodine and salt intake of the Dutch population for several scenarios of salt reduction strategies and we compared the salt intake distributions with the recommended maximum level to get quantitative insight into the changes in population salt intake. The iodine intake distributions were compared with the estimated average requirement (EAR) and tolerable upper intake level of iodine to predict whether iodine intake will remain adequate for different age groups within the population.
Methods
Data of the Dutch National Food Consumption Survey-3 (DNFCS-3) were used to estimate habitual total iodine and salt intake. This survey is the most-recent population-wide food consumption survey in The Netherlands and has been described in detail elsewhere(Reference Hulshof, Brussaard and Kruizinga20). Briefly, data were collected in 1997–8 and respondents (n 6250; aged 1–97 years and selected from a representative consumer panel of households) recorded their food intake with a food record on 2 consecutive days.
From 2007 onwards, iodine levels were added to the Dutch food composition database (NEVO)(21). For the present study, missing iodine levels were completed and available iodine levels were, if required, updated using manufacturers' information, scientific literature(Reference Rasmussen, Larsen and Ovesen22, Reference Haldimann, Alt and Blanc23), foreign food composition tables (Danish (2005), Finnish (2006), German (1994, 2006), UK (1991, 1993, 1995, 1996, 2002)), or iodine levels from similar food products. All recipes were recalculated using the updated iodine levels. Na levels available in NEVO(21) were updated as well, using a similar procedure as for iodine. As iodine is added to industrially processed foods as iodised sodium chloride, the proportion of total Na industrially added as sodium chloride was roughly estimated based on recipe information. When the proportion of natural Na was estimated to be 10 % or less of total Na content, industrially added salt was set at 100 %. For most industrially processed foods the proportion of added sodium chloride was set at 100 %, except for salted fries (70 %), canned vegetables (80 %), sesame paste (90 %), all cheese excluding cheese spread (75 %), cheese spread (85 %), chips (crisps) (85 %), liquorices (50 %), smoked fish (85 %), canned fish (80 %), dried and salted shrimps (30 %) and meat products (90 %).
Simulation model
Due to the lack of data about the discretionary use of (iodised) kitchen salt and market shares of industrially processed foods containing iodised salt, a simulation model combining deterministic approaches with probabilistic approaches was used to estimate both habitual iodine and salt intake. We have described this model in detail elsewhere(Reference Verkaik-Kloosterman, van 't Veer and Ocké19). Briefly, we defined different potential dietary sources for both salt intake ((a) Na present in industrially processed foods, and (b) discretionary Na added during cooking or consumption) and iodine intake ((a) naturally present in foods, (b) added to industrially processed foods, (c) discretionary iodine added via kitchen salt, and (d) iodine-containing dietary supplements). For all these sources, iodine and salt intakes were estimated separately for each subject on each observation day. The intakes of iodine from natural sources and salt (calculated from total Na × 2·5) present in industrially processed foods were calculated using a deterministic approach. The consumed amount of a food was multiplied with the concentration of iodine or salt in that food. For all other potential sources of iodine or salt intake (i.e. industrially added, discretionary use of kitchen salt, dietary supplements (iodine only)) we applied a probabilistic approach to be able to take into account uncertainty and variability. For each potential source we estimated the proportion of foods that will contain iodised salt or the proportion of consumers that will use (iodised) salt or iodine-containing dietary supplements. A sample of the study population (discretionary salt and dietary supplements) or of the consumers (industrially added iodised salt) as large as these proportions was drawn and selected to consume the iodised or iodine-containing variants. To take into account the uncertainty of who will actually use these products, each sample was drawn for 100 iterations. To be able to take into account that subjects will not be aware of purchasing foods containing iodised salt we subdivided the group of industrially processed foods into thirty-five food groups that may contain iodised salt(Reference Verkaik-Kloosterman, van 't Veer and Ocké19). For each food group the probabilistic approach was applied separately and independently for each observation day. It was assumed that subjects assigned to discretionary use of (iodised) salt would do that for all selected eleven food groups and on both observed days. For each of these eleven food groups a point estimate of discretionary use of (iodised) salt was estimated(Reference Verkaik-Kloosterman, van 't Veer and Ocké19).
From the subjects selected to use iodine-containing dietary supplements, a second sample was drawn to select subjects using iodine-containing dietary supplements on both observed days. The amount of iodine consumed from dietary supplements was drawn from an age group-specific (children, adolescents, adults) uniform distribution(Reference Verkaik-Kloosterman, van 't Veer and Ocké19). The consumed dose was assumed to be equal on both days. In The Netherlands, Na-containing dietary supplements are not used frequently(Reference Van den Hooven, Fransen and Jansen8); therefore Na intake from this source was not taken into account.
Total iodine and salt intake was calculated by summation of the intake of iodine or salt from all potential sources per subject, per observation day per iteration, resulting in 100 possible total intakes. Habitual total iodine and salt intake was calculated by correcting the data for within-individual variation using the Iowa State University (ISU) method (SIDE/IML version 1.11, 2001; Iowa State University, Ames, IA, USA)(Reference Nusser, Carriquiry and Dodd24). Unless stated otherwise, SAS software (SAS 9.1.3; SAS Institute Inc., Cary, NC, USA) was used for modelling.
Population habitual total iodine intake distributions were compared with the EAR set by the Institute of Medicine(25) and tolerable upper intake levels set by the European Union Scientific Committee on Food(26) to estimate the proportion of the population at risk of too low or too high iodine intakes using the cut-point method (taking EAR or upper intake level as the cut-point)(27). The habitual total salt intake distribution (calculated as total Na × 2·5) was compared with the recommended maximum salt intake level set by the Health Council of The Netherlands (adults)(3) and the Scientific Advisory Committee on Nutrition (children)(5).
Salt reduction scenarios
Habitual iodine and salt intake was estimated for different scenarios of salt reduction strategies and for a reference situation without salt reduction (Table 1). In The Netherlands, salt with a maximum of 65 mg iodine/kg salt (high iodised salt) may be used in bread, bread-replacing products and other bakery products, and salt with a maximum level of 25 mg iodine/kg salt (low iodised salt) may be used in all other industrially processed foods (excluding drinks containing>1·2 % alcohol by volume). This policy does not only account for Dutch food producers but also for food imported from other countries. From the Dutch salt industry we know that their salt contains on average 58 mg iodine/kg salt (high iodised salt) or 20 mg iodine/kg salt (low iodised salt) (based on information of the Dutch salt industry; L Rupert, Akzo Nobel Salt, The Netherlands, personal communication). These levels were applied as point estimates in the salt reduction scenarios under current iodine policy. In the current market situation, at maximum 5 % of all industrially processed foods (excluding bread) contain iodised salt. As it is unclear in which industrially processed foods iodised salt is added, this percentage was used as the market share. In bread, the use of iodised salt is more common due to a covenant between the authorities and bakeries; therefore for bread a market share of 90 % was applied(Reference Verkaik-Kloosterman, van 't Veer and Ocké19).
Different scenarios of use of iodised salt and salt reduction strategies

* To achieve a median habitual salt intake of adults equal to the recommended maximum salt intake of 6 g/d.
† Not only iodised kitchen salt, but total kitchen salt.
The scenarios of salt reduction strategies were based on international experiences, mainly from UK and Ireland(13, 28) and initiatives of the Federation of the Dutch Food and Grocery Industry (FNLI) in the Taskforce Salt. In the first scenario, industrially added sodium chloride was reduced by 12 % in all foods; this percentage was based on the current commitment of Dutch bakeries (Table 1). In the second scenario, a salt reduction of 25 % was chosen and in the third scenario an even higher salt reduction of 50 % was presumed. For the fourth scenario the median salt intake (from all sources) of adults was reduced to the level of the recommended maximum intake of salt (i.e. 6 g/d)(3).
Results
Habitual salt intake
In general, habitual salt intake increased with age, and was higher for men than for women. For the current situation (i.e. reference) the median habitual salt intake ranged from 4·2 g/d for young children (aged 1–3 years) to 10·8 g/d for adult men (Table 2). The percentages of the population with intakes above the recommended maximum level for salt intake are high and ranged in this scenario from 88 % to almost 100 % (Fig. 1). About 25 % of total salt intake originated from discretionary added kitchen salt; this percentage showed a small increase with age (data not shown).
Habitual salt* intake (g/d) in the Dutch population for different salt reduction strategies (Medians and 95th percentiles†)
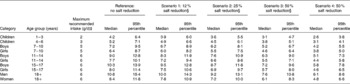
* Based on total Na intake.
† Median and 95th percentile based on the results of 100 iterations; variation between the 100 iterations was on average ± 2 % for median and ± 3 % for 95th percentile.
‡ For adults from the Health Council of The Netherlands(3), for children and adolescents from the Scientific Advisory Committee on Nutrition(5).
§ Only salt reduction in industrially processed foods.
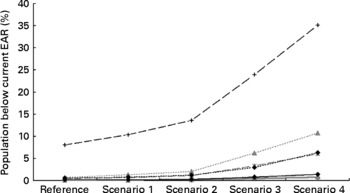
Percentage of the Dutch population with habitual total salt intakes (based on total Na intake) above the recommended maximum level, for different scenarios of salt reduction strategies: reference, no salt reduction; scenario 1, 12 % salt reduction in industrially added salt; scenario 2, 25 % salt reduction in industrially added salt; scenario 3, 50 % salt reduction in industrially added salt; scenario 4, 50 % salt reduction in industrially and discretionary added salt. The percentages are based on 100 iterations for estimating the intake profile; values are presented as the median of 100 iterations. The recommended maximum levels for the different age groups are: 1–3 years, 2 g/d; 4–6 years, 3 g/d; 7–10 years, 4 g/d; 11–14 years, 5 g/d; ≥ 15 years, 6 g/d(3). (–+–), Children 1–3 years; ( × ), children 4–6 years; (![]() ), boys 7–14 years; (
), boys 7–14 years; (![]() ), girls 7–14 years; (
), girls 7–14 years; (![]() ), boys 15–17 years; (
), boys 15–17 years; (![]() ), girls 15–17 years; (
), girls 15–17 years; (![]() ), adult men; (
), adult men; (![]() ), adult women.
), adult women.

As a logical consequence of salt reduction, salt intake decreased in the four scenarios compared with the current situation (i.e. reference). Salt reductions of 12, 25 or 50 % in industrially processed foods decreased the habitual total salt intake on average by 7, 15 and 30 % compared with the current intake (Table 2). With these salt reductions in all age–sex groups the percentages with salt intakes above the recommended maximum level remained high; 80–99, 68–97 and 28–93 %, respectively (Fig. 1). In general, the highest percentages were observed among young children (aged 1–8 years) and men. To reach a median habitual salt intake for adult men of about 6 g/d a 50 % salt reduction in both industrially processed foods and discretionary used kitchen salt was needed (scenario 4). In this scenario, salt intake reduced on average by 40 % (Table 2) and the percentages with intakes above the maximum recommended intake level in the different age–sex groups decreased to 3–83 % (Fig. 1). Young children (aged 1–3 years) still had a median salt intake above the maximum recommended level (2·6 g/d); for children aged 4–6 years the median salt intake was close to the maximum intake level (3·1 g/d). To get the median habitual total salt intake for young children (aged 1–3 years) close to the recommended maximum intake level (i.e. 2·1 g/d), a salt reduction of 50 % in industrially added salt in combination with no discretionary use of kitchen salt was required.
Habitual iodine intake
In general, iodine intake was higher for men than for women and increased with age. In the reference situation (no salt reduction), the median habitual iodine intake ranged from 105 μg/d for young children aged 1–3 years to 268 μg/d for boys aged 15–17 years (Table 3). A total of 8 % of young children had a habitual iodine intake below the current EAR (Fig. 2); however, for the other age–sex groups, habitual iodine intakes below the EAR were small ( < 5 %). The percentage of the population with habitual iodine intakes above the upper intake level was small in all cases ( < 5 %).
Habitual iodine intake (μg/d) in the Dutch population for different salt reduction strategies (Medians and 5th percentiles*)

EAR, estimated average requirement.
* Median and 5th percentile based on the results of 100 iterations; variation between the 100 iterations was on average ± 5 % for median and ± 10 % for 5th percentile.
† Set by the Institute of Medicine (USA)(25).
‡ Only salt reduction in industrially processed foods.
Percentage of the Dutch population with habitual iodine intakes below the current estimated average requirement (EAR), for different scenarios of salt reduction strategies: reference, no salt reduction, scenario 1, 12 % salt reduction in industrially added salt; scenario 2, 25 % salt reduction in industrially added salt; scenario 3, 50 % salt reduction in industrially added salt; scenario 4, 50 % salt reduction in industrially and discretionary added salt. The percentages are based on 100 iterations for estimating the intake profile; values are presented as the median of 100 iterations. The current EAR for the different age groups are: 1–6 years, 65 μg/d; 7–10 years, 73 μg/d; 11 years and older, 95 μg/d(25). (–+–), Children 1–3 years; (– × –), children 4–8 years; (![]() ), boys 9–13 years; (
), boys 9–13 years; (![]() ), girls 9–13 years; (
), girls 9–13 years; (![]() ), boys 14–17 years; (
), boys 14–17 years; (![]() ), girls 14–17 years; (
), girls 14–17 years; (![]() ), adult men; (
), adult men; (![]() ), adult women.
), adult women.
As iodised salt (industrial and discretionary) is an important source of iodine intake, reduction of salt also reduced habitual iodine intake. Salt reduction of 12, 25 or 50 % in industrially processed foods resulted on average in a 6, 12 or 25 % reduction in habitual iodine intake, but the 5th percentile of iodine intake remained near or above the corresponding EAR values for most age groups (Table 3; Fig. 2). The percentage of the population with habitual iodine intakes below the EAR slightly increased (1–11 %) for age groups older than 3 years in the fourth scenario, which included reduction of both industrially and discretionary added salt (Fig. 2). Percentages below the EAR of iodine among young children (aged 1–3 years) were 10 % to 35 % for scenarios 1 to 4 of salt intake, respectively (Fig. 2).
Discussion
In discussions about salt reduction concerns about the parallel decrease in iodine intake are often mentioned, since salt is the main vehicle for iodine fortification in many countries. In the present study, we quantified the effects of potential scenarios of salt reduction on habitual total iodine intake in the Dutch population. In the current situation, without salt reduction, the habitual iodine intake seems adequate for a large part of the Dutch population. With salt reductions of 12, 25 and 50 % in industrially processed foods this remained the case. For the extreme scenario of 50 % reduction in both industrially and discretionary added salt, iodine intake might become inadequate for part of the Dutch population.
Only for infants did we observe high percentages with intakes below the EAR, i.e. about one-third of this age group in the case of 50 % salt reduction. However, the EAR for these children (aged 1–3 years) was based on one single balance study in which malnourished children were nutritionally rehabilitated(25). It can be questioned whether the level of iodine that is needed for well-nourished children to maintain their iodine balance is as high as the iodine level that is needed to achieve nutritional rehabilitation. When the EAR of adults was extrapolated down based on metabolic weight (i.e. weight0·75) the EAR of young children would be 36 μg/d, which is considerably lower than 65 μg/d (the current EAR)(25). Taking the lower cut-off value of 36 μg/d, less than 5 % of these children had intakes below this value (data not shown). We recommend doing more research to assess the iodine requirements of well-nourished young children before conclusive statements on a potential public health risk for young children are drawn.
Dutch iodine policy changed in 2008(17). In this new policy, more foods are allowed to include iodised salt. The salt iodine levels in this new policy are based on the assumption that 50 % of industrially processed foods will use iodised salt. Currently this proportion is about 5 %, and an increment of the proportion of industrially processed foods using iodised salt from 5 % to 50 % will result in adequate iodine intakes for virtually the whole population, including young children(Reference Verkaik-Kloosterman, van 't Veer and Ocké19). With large salt reductions, also an increase in the proportion of industrially processed foods using iodised salt from 5 % to 50 % is enough to reduce the percentage of the population, excluding young children, with iodine intakes below the current EAR to less than 5 % (data not shown). Even mandatory iodisation will not result in adequate iodine intakes for young children (data not shown). To increase the habitual iodine intake of children aged 1–3 years to intake levels above the EAR (i.e. 65 μg/d) under major salt reduction strategies, salt iodine levels should be increased (for instance, a salt iodine level of 80 mg iodine/kg salt) in combination with a 50 % market share of industrially processed foods using iodised salt (data not shown). An alternative is to recommend and stimulate the addition of iodine to industrially manufactured complementary foods.
The present study shows that the long-term goal of the Federation of the Dutch Food and Grocery Industry (FNLI) of a mean salt reduction of 20–30 %(14), which is similar to salt reduction goals in other counties(13, 28), is not sufficient to reduce total salt intake to or below the level of the maximum recommended salt intake. A larger salt reduction of 50 % (both industrially and discretionary) is required to reach a median habitual total salt intake for adults of about 6 g/d. An even larger salt reduction of 50 % in industrially processed foods in combination with no discretionary use of salt is needed for young children (aged 1–6 years) to reach a median habitual salt intake at their age-specific recommended maximum salt intake (data not shown)(5). This underlines the additional importance of changing consumer behaviour in the use of discretionary added salt. In order to prevent compensation behaviour of industrial salt reduction, this should be a gradual process supported by the whole food industry. In Finland, salt reduction initiatives already started several decades ago. Also the discretionary use of salt reduced(Reference Laatikainen, Pietinen and Valsta29); this may indicate that compensation behaviour was minor.
A limitation of the present study is that Dutch national food consumption data from 1997–8 were used; these are the most recent monitoring data covering all ages. To get more up-to-date results, these consumption data were combined with the most up-to-date food composition data taking into account changes in food composition since 1997–8. In 2005–6 a food consumption survey was conducted among young children (aged 2–6 years). Application of our model to these data resulted in median habitual total salt intakes that were slightly lower (4·0 g/d for children aged 2–3 years; 4·7 g/d for children 4–6 years). Also the median estimated habitual iodine intakes were lower (89 μg/d for children aged 2–3 years; 113 μg/d for children aged 4–6 years). The observed differences are small and results are in same order of magnitude as the results presented in the present paper. These calculations imply that the indications of habitual salt and iodine intake in the different scenarios of salt reduction seem still valid for the current Dutch situation.
A strength of the study is that the model we used to estimate habitual iodine and salt intake was earlier shown to accurately estimate habitual iodine intakes in The Netherlands(Reference Verkaik-Kloosterman, van 't Veer and Ocké19). The habitual total salt (Na) intakes that we estimated with this model for adults were somewhat higher but in same order of magnitude as the results from other Dutch studies(Reference Van den Hooven, Fransen and Jansen8–Reference Schreuder, Bokenkamp and van Wijk12). The small differences between our model and these three studies may not only be due to the model assumptions, but might also be caused by differences in the study populations (for example, age distribution). The comparability in results indicates that our model is a useful tool to estimate both habitual salt and iodine intake accurately in the Dutch population.
The salt reduction scenarios applied in the present study were generic reductions in all industrially processed foods. Differences in technological feasibility of salt reductions between food groups were not considered; however, with our model these can be taken into account in future studies. The present study, nevertheless, does show what large salt reductions are needed in the Dutch population and gives first indications on the effect on iodine intake.
In conclusion, the present study showed that with small salt reductions, iodine intakes remain adequate in a large part of the Dutch population. These small reductions in the total habitual salt intake will not come close to the maximum recommended salt intake levels. A more pronounced salt reduction is therefore needed, for instance, 50 % reduction of both industrially and discretionary added salt. A small part of the Dutch population (up to 10 %) might then have inadequate habitual iodine intakes. An increment in the number of industrially processed foods using iodised salt or a small increase in iodine salt content will solve this.
Acknowledgements
We would like to thank H. A. M. Brants and M. Jansen-van der Vliet for updating the food composition data for most recent information on iodine and Na concentrations and C. Wilson-van der Hooven for assistance in defining the salt reduction scenarios.
The present study received no specific grant from any funding agency in the public, commercial or not-for-profit sectors.
All authors contributed to the interpretation of the data and writing of the manuscript. J. V.-K. performed the simulations of the different scenarios.
The authors declare that there are no conflicts of interest.


