


INTRODUCTION
Recent changes in Arctic sea-ice conditions are well documented. There is a new Arctic sea-ice regime, characterized over the last 35 years by a rapidly declining summer ice extent and, since 2007, a shift from predominantly thicker multiyear sea ice (MYI) to thinner, seasonally decaying, first-year sea ice (FYI) (Giles and others, Reference Giles, Laxon and Ridout2008; Kwok and others, Reference Kwok2009; Kwok and Rothrock, Reference Kwok and Rothrock2009; Laxon and others, Reference Laxon2013). When compared to paleo-environmental records, this shrinking and thinning of Arctic sea ice is unprecedented in the past several thousand years (Polyak and others, Reference Polyak2010; Kinnard and others, Reference Kinnard2011; Meier and others, Reference Meier2014). As sea ice normally acts as a barrier between the atmosphere and ocean, less ice during summer is linked to increased radiative forcing, upper ocean warming and longer melt seasons (Laxon and others, Reference Laxon, Peacock and Smith2003; Perovich and others, Reference Perovich2007; Markus and others, Reference Markus, Stroeve and Miller2009; Pistone and others, Reference Pistone, Eisenman and Ramanathan2014). How these changes affect the Arctic marine ecosystem, impact weather and climate at regional and global scales, threaten the livelihood of indigenous communities, and raise geopolitical and economic issues, remains to be determined.
In spring, the melting Arctic sea-ice cover is characterized by the formation of surface melt ponds. Melt ponds are shallow, meter-scale, pools of melt water that act to decrease the area-averaged albedo of sea ice, thereby enhancing shortwave radiation absorption, and accelerating the rate of seasonal ice decay (Maykut, Reference Maykut and Horner1985; Hanesiak and others, Reference Hanesiak, Yackel and Barber2001; Perovich and others, Reference Perovich2003). Light transmittance is an order of magnitude greater through melt pond covered sea ice (Inoue and others, Reference Inoue, Kikuchi and Perovich2008; Ehn and others, Reference Ehn2011), so that the upper ocean layer is warmed prior to the ice breaking up and primary productivity is possible (Mundy and others, Reference Mundy2009; Arrigo and others, Reference Arrigo2012). Melt ponds also provide a mechanism for gas transfer and chemical deposition rates that are otherwise impeded by the impermeable ice cover (Golden and others, Reference Golden, Ackley and Lytle1998; Pucko and others, Reference Pucko2012; Vancoppenolle and others, Reference Vancoppenolle2013). It is well understood that melt ponds cover a greater portion of seasonal or FYI than older, MYI, as FYI is less weathered and lacks topographic controls on melt water flooding (Eicken and others, Reference Eicken, Grenfell, Perovich, Richter-Menge and Frey2004). In the context of the relatively new reality of a FYI dominated pan-Arctic sea-ice regime, there is considerable need to improve our understanding of the impacts of surface melt ponds on coupled processes at regional and greater scales, and to improve the physics of spring-summer sea ice in dynamical and forecast models based on the findings at critical scales. A recent modelling study linked pan-Arctic pond fraction to ice extent, suggesting the impact of higher pond fractions on precipitous sea-ice decline (Schröder and others, Reference Schröder, Feltham, Flocco and Tsamados2014).
A key parameter describing melt pond coverage on sea ice and providing a proxy for the surface albedo is the areal pond fraction (f p). Mechanisms governing the spatio-temporal evolution of f p at the in situ scale have been documented (e.g. see Eicken and others, Reference Eicken, Krouse, Kadko and Perovich2002; Polashenski and others, Reference Polashenski, Perovich and Courville2012; Landy and others, Reference Landy, Ehn, Shields and Barber2014). To understand emergent patterns and processes related to sea-ice melt pond formation and evolution, relationships at regional and larger scales must be better understood. Spatio-temporal patterns of f p must be examined and scales of action determined, where linkages between pattern and process are strongest. Satellite earth observation (EO) techniques aid the study of pattern and processes, particularly in remote regions such as the Arctic.
EO-based observations of f p are possible using images obtained in the visible to near infrared (VIS-NIR) portions on the electromagnetic spectrum by estimating the f p from spectral mixtures (Markus and others, Reference Markus, Cavalieri, Tschudi and Ivanoff2003; Tschudi and others, Reference Tschudi, Maslanik and Perovich2008; Rösel and others, Reference Rösel, Kaleschke and Birnbaum2012; Istomina and others, Reference Istomina2015). However, the temporal resolution of these approaches is impeded by the pervasive Arctic cloud cover which, during spring-summer, is predominantly low-level stratus. A f p estimation approach from satellite synthetic aperture radar (SAR) image data acquired at C-band frequency has been outlined (Scharien and others, Reference Scharien, Hochheim, Landy and Barber2014). SAR transmits and receives microwave energy, meaning that imagery can be acquired regardless of cloud cover. SAR systems provide much higher spatial resolutions (1–1000 m) compared with satellite passive microwave radiometers and radar scatterometers (several km), so that individual ice floes are resolved. The radar backscatter coefficient (sigma-nought or σ°) measured by a SAR is sensitive to wind-wave roughness on water bodies, such that imaging melt pond covered sea ice introduces ambiguities depending on the wind speed at the time of acquisition. The VV/HH approach outlined by Scharien and others (Reference Scharien, Hochheim, Landy and Barber2014) is independent of wind-wave roughness below a roughness threshold. However, in this case, the temporal resolution is limited by the need for simultaneous linear horizontal (H) and vertical (V) transmit–receive polarizations (i.e. VV and HH together in one acquisition), in order to compute the polarization ratio (VV/HH) required by the SAR-based f p approach. Future missions like the RADARSAT Constellation Mission in 2018 will offer the wide-area coverage and parameters needed for robust SAR-based f p mapping based on the same radar scattering mechanisms as the VV/HH ratio approach.
The European Space Agency (ESA) launched the first of two Sentinel-1 SAR satellites in 2014 as part of the Copernicus initiative. The second Sentinel-1 SAR was launched in 2016, leading to the formation of a constellation of two near-polar orbiting, medium to high resolution, imaging radars capable of providing imagery regardless of cloud cover or daylight. The near-polar constellation orbit is advantageous for Arctic sea-ice monitoring, as a revisit frequency of <1 d is possible at high latitudes. Under ESA's current observation scenario, Arctic sea-ice imagery is provided at least every 6 d, depending on the latitude and region. Moreover, newly acquired scenes are open access and free to the scientific community, a delivery format which represents a fundamental shift in SAR imaging, since newly acquired SAR mission data have been traditionally constrained and/or costly. One limitation of Sentinel-1 for mapping sea ice during spring-summer is that it is limited to either a single polarization mode (HH or VV) or dual-polarization mode (HH + HV or VV + VH) during acquisition.
In this study, we consider the potential of Sentinel-1 and other dual-polarization C-band frequency SARs for providing estimates of the spring f p during late winter period preceding melt. Relationships between late winter HH and HV backscatter, the two most commonly acquired polarizations of C-band SARs operating over Arctic waters, and spring f p are examined. Relationships between grey-level co-occurrence matrix (GLCM) derived texture parameters, calculated from HH and HV channels, and f p are also examined. We chose previously acquired datasets based on the availability of late winter (pre-melt) dual-polarization (HH and HV), C-band frequency, SAR images of landfast sea ice spatially coincident to high-resolution optical satellite images capturing melt ponds on the same ice during spring. The f p prediction models are intended to provide a single indicator of the expected f p susceptibility related to ice topography, i.e. when rapid variations due to early snow melt inflows, and late drainage outflows, are absent. The study sites are detailed in the Study sites section, followed by a description of the data collected and the research methods used in this study in Data and methods section. Results are documented in Results and discussion section and discussed and concluded in Conclusions section.
STUDY SITES
Data for this study were collected from four areas of landfast sea ice in the central Canadian Arctic Archipelago (Fig. 1). There are two sites in the northern and southern margins of Victoria Strait, a shallow strait which comprises part of the southern arm of the Northwest Passage and lies ~150–250 km east and northeast of Cambridge Bay, Nunavut. These sites are referred to as Victoria North (VN) and Victoria South (VS), respectively. The area was targeted for the collection of high-resolution, cloud-free, VIS-NIR, scenes of melt ponds from GeoEye-1 sensors in 2015 and 2016 since it contains a mixture of ice types including thermodynamically grown FYI, deformed FYI (DFYI), and MYI floes that become fasted to the shore and remain in place until the ice breaks up in July. The third site is a sea-ice field data collection program on the smooth FYI in Dease Strait (DS), immediately adjacent to Cambridge Bay and 150 km west of VS, which also took place in 2016. The Sentinel-1 mission was operational during this period, enabling the collection of SAR scenes from the free and open access Sentinels Scientific Data Hub made available by ESA.
Study area in the central Canadian Arctic Archipelago. Locations where satellite data used in the study were collected which include Allen Bay (AB), adjacent to Cornwallis Island, and the northern and southern portions of Victoria Strait (VN and VS) in 2015 and 2016, respectively; also shown is a field study site in Dease Strait (DS), adjacent to Victoria Island, where in 2016 sea-ice geophysical measurements were made at the same time as satellite data were captured in VS.
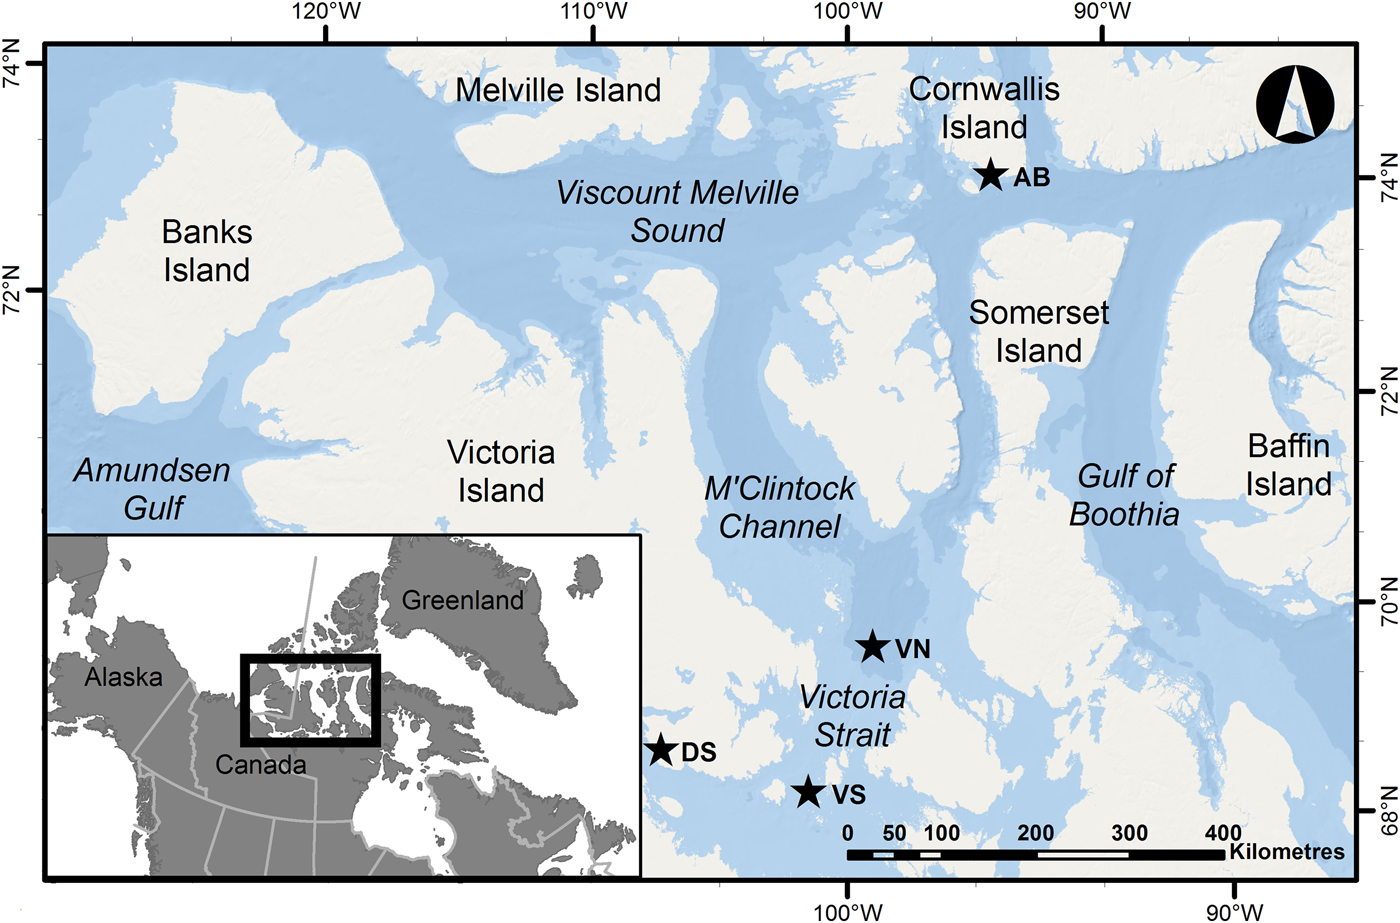
A fourth site in Allen Bay (AB), a small, sheltered, bay adjacent to the community of Resolute Bay, Nunavut was chosen due to the availability of archived satellite image and field observation data spanning the winter (pre-melt) through advanced melt periods, dating 15 April to 12 July, in 2006. Three SAR scenes from the Envisat-ASAR mission were acquired spatially coincident to a high-resolution, cloud-free, VIS-NIR, scene of melt ponds from the QuickBird satellite. Satellite imagery and ice conditions are further detailed in Data and methods section.
DATA AND METHODS
SAR data and processing
Details of the SAR scenes used in this study are provided in Table 1. It is important to note that the portions of the Sentinel-1 SAR scenes that are spatially coincident to high-resolution VIS-NIR scenes from which f p data cover a narrow range of radar incidence angles (θ). The archived ASAR data from AB were selected to enable us to further investigate the role of θ on backscatter and f p relationships.
Basic image characteristics of the SAR scenes acquired for this study

Pass refers to ascending (Asc) and descending (Des) orbits; Swath to the available swaths of Envisat-ASAR APP mode products (IS1–IS7) and Sentinel-1 products; and incidence angle (θ) ranges of the overall swath and for the portion examined.
Three Sentinel-1 Extra Wide Swath Mode (EW) scenes, S1–S3, were acquired for sites VN and VS. The EW mode was designed for maritime use, and particularly for imaging sea ice, by employing a wide swath. In EW mode, Sentinel-1 acquires data over a 400 km swath at 20 m by 40 m spatial resolution (ESA, 2013). Data are acquired in one of four independent polarization configurations using one H or V polarization transmit chain, and one or two parallel receive chains for H and V polarizations. This produces either a single polarization VV or HH, or a dual-polarization HH + HV or VH + VV, scene comprised of five sub-swaths and spanning a θ range of 19–47°. Scenes S1–S3 were processed to medium resolution level-1 ground range detected format with 40 m by 40 m pixel spacing, prior to downloading from the Data Hub (ESA, 2013). Sentinel-1 is an ongoing constellation mission with two satellites, Sentinel-1A and Sentinel-1B, sharing the same near-polar orbital plane with a 180° orbital phasing difference (ESA, 2013). Sentinel-1A was launched in early 2014 and Sentinel-1B in early 2016.
Three ASAR Alternating Polarization Mode Precision image (APP) products of site AB, named AB1–AB3, were acquired from the ESA Earth Observation Link. In APP mode, ASAR interleaved looks along-track in H and V polarizations within the synthetic aperture, resulting in the production of two ground range detected image channels (i.e. dual polarization images) out of three possible transmit–receive polarization combinations (HH + VV or HH + HV or VV + VH) at a nominal resolution of 30 m. The sensor was capable of acquiring one of seven different image swaths spanning a total θ range of 15–45°. Swath widths ranged from 56.5 to 104.8 km, depending on which of the seven swaths was chosen. The Envisat satellite was launched in early 2002 and ceased operating in early 2012.
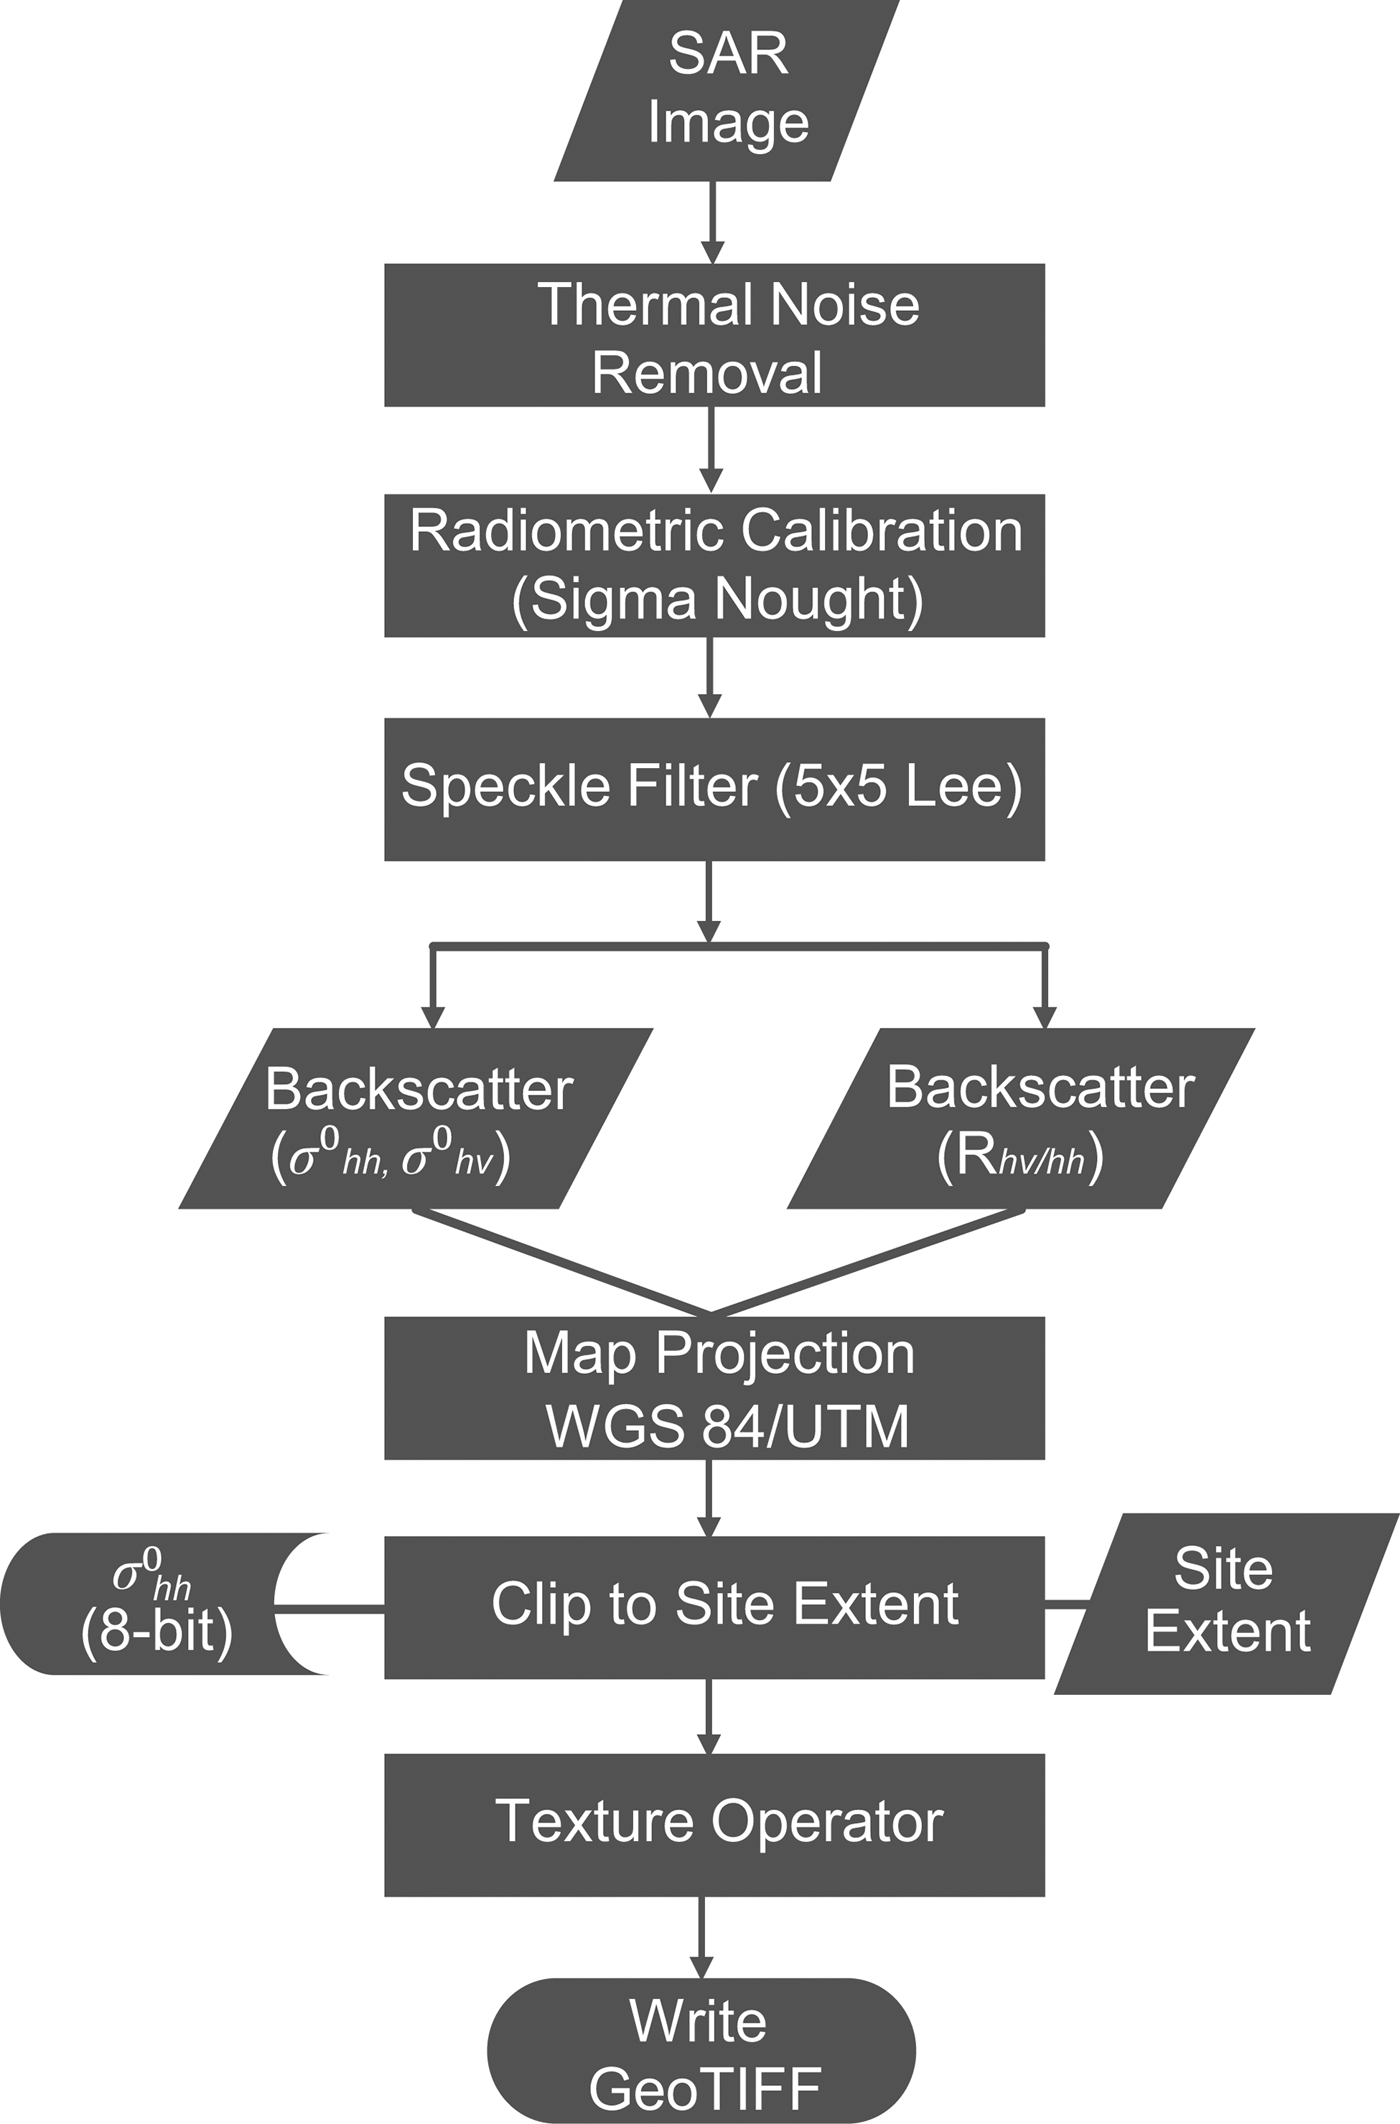
SAR scenes were processed according to the flowchart in Figure 2. The thermal noise removal was done by subtracting the noise estimate values, retrieved from the annotation dataset of each SAR image product, from the corresponding image channel. Image bands were calibrated to the common sigma-nought backscatter σ hh° or σ hv° and speckle filtered using the Lee Filter and a 5 by 5 sliding window. A cross-polarization ratio R hv/hh (σ hh°/σ hv°) band was then derived. Image bands were map projected to the WGS 1984/UTM projection using the Bilinear resampling method and clipped to the appropriate site extent, as determined by the coverage of the corresponding high-resolution VIS-NIR scenes at sites AB, VN and VS. Envisat-ASAR scenes were projected with 12.5 m pixel spacing, whereas Sentinel-1 scenes were project with 40 m pixel spacing. After clipping, an 8-bit scaled version of the σ hh° band from each SAR scene was exported for segmenting each site into discrete image objects for the object-based image analysis (described below).
Flow chart depicting the SAR image processing chain. The final GeoTIFF image product contains calibrated backscatter sigma-nought (σ°), backscatter ratio and texture bands.
Second-order texture parameters were derived from each of the three clipped image bands from the six SAR scenes, σ hh°, σ hv°, and R hv/hh, using the GLCM method developed by Haralick and others (Reference Haralick, Shanmugan and Dinstein1973). The co-occurrence parameters are based on computing the joint probabilities of all pair-wise combinations of brightness values in a spatial window (kernel) according to two parameters: a displacement (inter-pixel distance) and, an orientation (0, 45, 90 and 135°) (Clausi, Reference Clausi2002). From Clausi (Reference Clausi2002), this is defined as:
 $$\Pr (x) = \left. {\left\{ {C_{ij}} \right.\left \vert {\left( {\delta, \theta _{\rm o}} \right)} \right.} \right\},$$
where C ij is the co-occurrence probability between grey levels i and j, δ is the inter-pixel distance, and θ o the orientation. C ij is defined as:
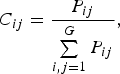 $$C_{ij} = \displaystyle{{P_{ij}} \over {\sum\limits_{i,j = 1}^G {P_{ij}}}}, $$
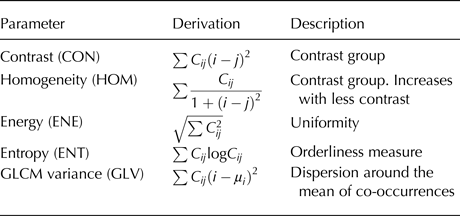
where P ij represents the number of occurrences of grey levels i and j within the kernel, given a δ and θ o pair, and G is the quantization level. The texture parameters are then derived from statistics applied to the co-occurrence probabilities. The comprehensive review of the use of co-occurrence texture parameters for the separability of sea-ice types and sea-ice classification by Clausi (Reference Clausi2002) was used to guide the selection and calculation of texture parameters. Co-occurrence probabilities were computed for a 5 by 5 sliding window, using G = 64, and values derived from all θ o (0, 45, 90 and 135°) were averaged. For δ, a value of 2 was chosen to negate the effect of correlated neighboring pixel values on texture calculations. As with SAR images in general, the scenes used here were oversampled, so that pixel spacing is approximately one-half the resolution in range and azimuth (ESA, 2013). SAR texture features contrast (CON), homogeneity (HOM), energy (ENE), entropy (ENT) and GLCM variance (GLV) were calculated (Table 2).
Co-occurrence based texture statistics
VIS-NIR data and processing
A Quickbird image product with four channels spanning 450–900 nm and 2.4 m ground sample distance (GSD) and a panchromatic channel with 0.61 m GSD covered a 64 km2 area of smooth FYI at site AB on 26 June 2006 at 18:44 UTC. Approximately 15% of the scene area that was cloud and land contaminated was manually masked out. Two GeoEye-1 image products containing four channels spanning the VIS-NIR range (450–920 nm) with a 1.7 m GSD, and a panchromatic channel with 0.41 m GSD covered 72 and 118 km2 areas of mainly FYI, and mainly MYI, respectively, at site VN on 25 June 2015 at 18:20 UTC. A GeoEye-1 image product with the same bands covered a 100 km2 area containing FYI and DFYI at site VS on 21 June 2016 at 18:45 UTC.
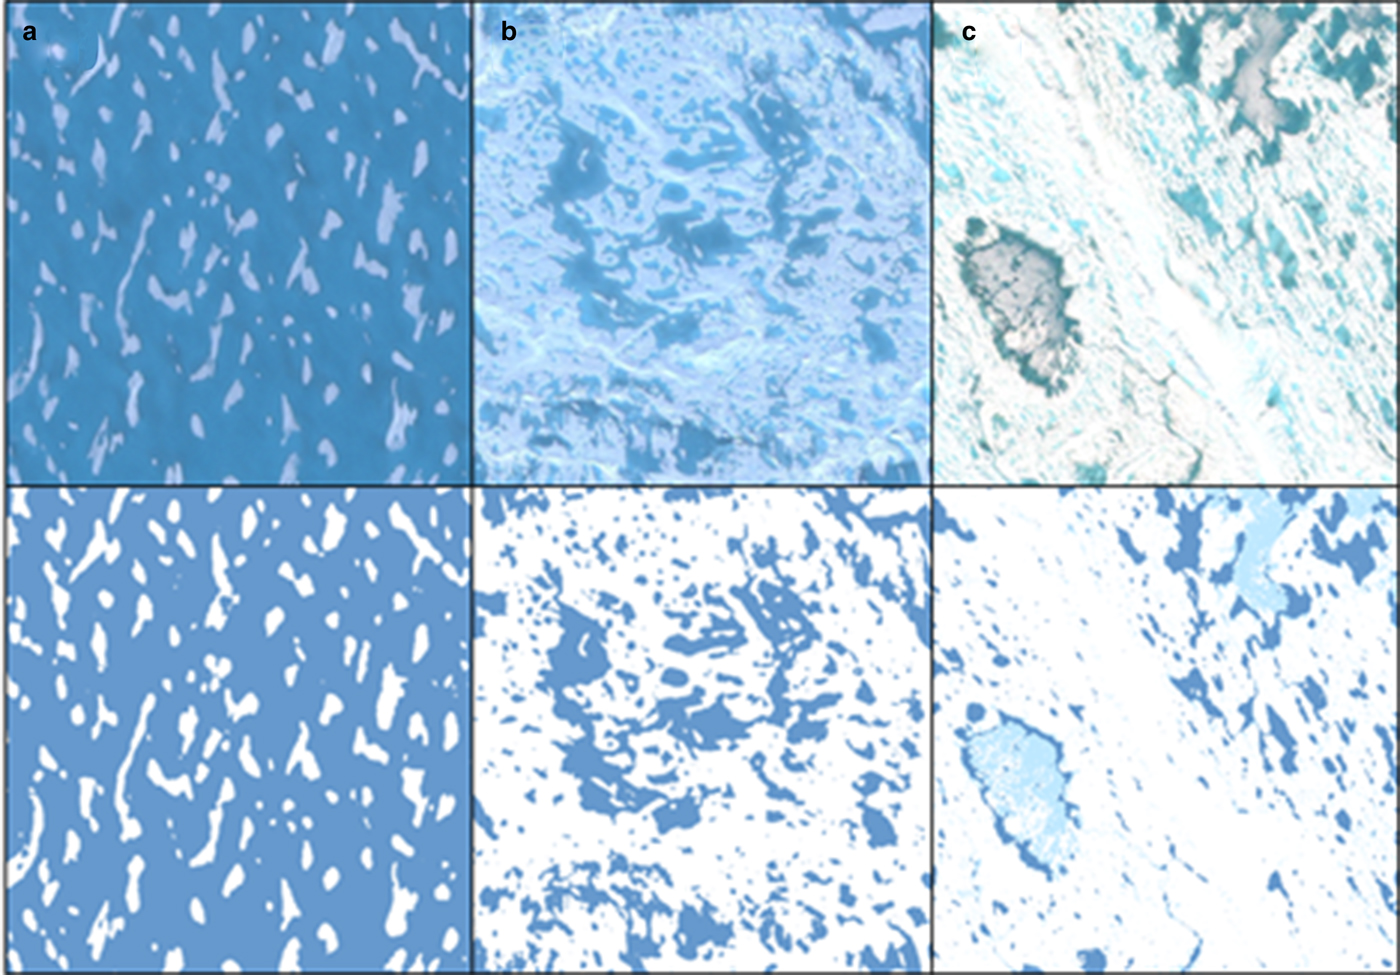
The high-resolution images were map projected to the WGS 1984/UTM projection. The Gram Schmidt pan-sharpening algorithm was used to fuse VIS-NIR bands from each product with its panchromatic pair, producing an output three-band (RGB) pan-sharpened image with a cell size of 0.5 m. The supervised maximum likelihood approach was used to partition the pan-sharpened scenes at AB and VN into binary classified images composed of snow/ice (0) and melt pond (1). A third class, drained melt pond (3) was added to the classification of the pan-sharpened scene at VS. By adding this class, we found that we could improve overall classification accuracy while still merging the two melt pond-related classes into one f p class that is more representative of conditions prior to pond drainage. We found this was necessary since the VS scene was captured almost 20 d after pond formation, so drainage from FYI was evident in the scene. Training data for the supervised classification of each image were derived from 100 randomly chosen pixel locations. An accuracy assessment was also performed on each image, using 100 randomly chosen pixel locations for comparisons between the classification output and the input image. The spectral differences between light snow/ice patches and dark melt ponds made for relatively straightforward classifications, and overall accuracies were >97%. Examples are shown in Figure 3.
Subsets of 300 by 300 m size showing true-color representations of surface conditions corresponding to the three main ice classes investigated in this study (top) and classification results with ice colored white, melt pond colored dark blue and drained melt pond colored light blue (bottom). (a) FYI in VN; (b) MYI in VN; (c) DFYI in VS.
Object-based image analysis
One drawback of using EO data is that it contains an arbitrarily defined, uniform sampling grid which is usually not appropriate for representing the entities of interest. In addition, the chosen scale for representing phenomena will affect results and interpretations derived from analyses. This is commonly referred to as the scale problem (Marceau, Reference Marceau1999). An object-based image analysis aims to mitigate the scale problem by segmenting the EO image into objects or segments that represent real-world entities in a manner consistent with patches in the landscape ecology literature (Turner and others, Reference Turner, Gardner and O'Neill2001; Benz and others, Reference Benz, Hofmann, Willhauck, Lingenfelder and Heynen2004). Here the regions of interest are constrained by the extents of the high-resolution VIS-NIR image products obtained for sites AB, VN and VS. The objects within each region of interest are individual pans or floes of sea ice which have unique dynamic and thermodynamic histories and, in a spatial context, have internally coherent and externally heterogeneous geophysical properties such as roughness which means they are: (a) likely to be unique areas in terms of thermodynamic evolution, hence winter state to spring melt pond formation; and (b) distinguishable in winter C-band SAR images.
The 8-bit scaled σ hh° image bands produced during SAR processing (see Fig. 2 and Table 1) were segmented into image objects using the bottom–up, region-merging technique detailed in Benz and others (Reference Benz, Hofmann, Willhauck, Lingenfelder and Heynen2004) and implemented in the eCognition® software. This algorithm was chosen since it allows the user to specify weightings that are used as homogeneity criteria for growing and segmenting coherent objects during the segmentation process. A color versus shape criterion, where color = 1 − shape, enables weighting toward color (i.e. backscatter intensity scaled to 8-bit) versus shape (i.e. spatial) information. The algorithm also allows the user to vary the sizes, and therefore the number of objects, created during the segmentation by specifying a scale parameter. User specified intensity and shape criteria are input into a heuristic, region growing algorithm which grows regions until the criteria are met. This results in a set of image objects of heterogeneous intensity and spatial characteristics. Additionally, a scale parameter can be used to create a multiresolution segmentation with multiple layers of image objects with successively larger (or smaller) scale.
A hierarchical segmentation approach was used to address the fact that sea-ice zones are not necessarily distinctly bounded, and no segmentation represents a perfect representation of distinct real-world entities. Three levels of segmentation were created by varying the scale parameter of the segmentation algorithm. The hierarchical approach also enabled us to assess the impact of object scale and resultant data aggregations on the strengths of correlation coefficients and coefficients of determination. The three segmentation levels created image object sets composed of progressively larger and fewer image objects for overlaying on spatially coincident SAR and optical scenes. We named the object sets fine, sharp and coarse and calculated the areas of the objects making up each of those sets (Fig. 4).
Image object sets for zone of predominantly multiyear sea ice in Victoria Strait north (VN) collected in 2015. Relatively smooth first-year sea ice is evident in the lower portion of the scene. (a) Eight-bit scaled HH polarization band of Sentinel-1 image VN1 (see Table 1) used for segmentation into three image object sets comprising progressively smaller and fewer image objects from (b)–(d). The coarse segmentation produced n = 42 objects (b). The sharp segmentation produced n = 87 objects (c). The fine segmentation produced n = 220 objects (d).
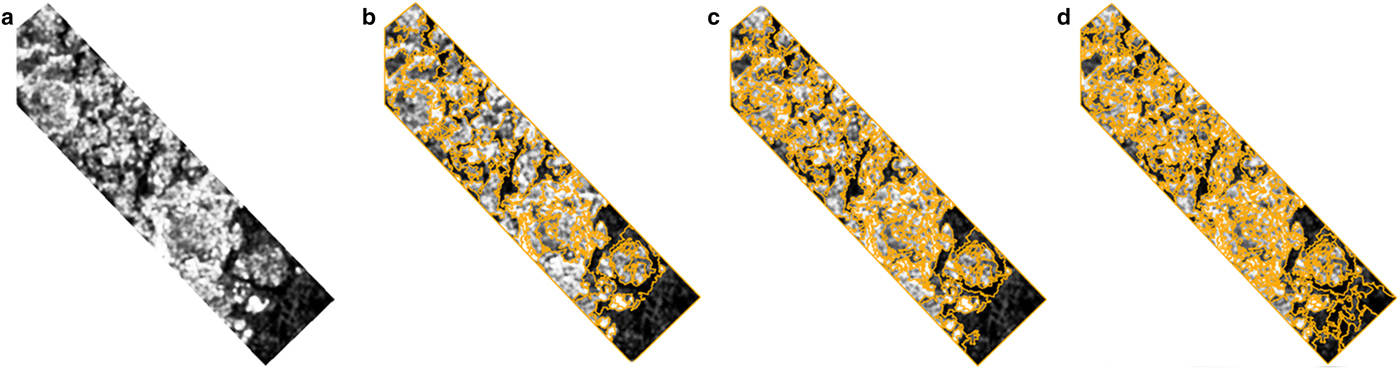
From fine to coarse scales, the object sets ranged from n obj = 237 to n obj = 37 (e.g. see Fig. 4). Average object sizes at the fine scale ranged according to the object set (AB, VN, VS) from 0.21 to 0.57 km2. At the sharp scale, the range was 0.56–1.1 km2, and at the coarse scale 1.3–2.8 km2. Each object sampled on average 210–355 Sentinel-1 pixels at the fine scale, 493–817 at the sharp scale, and 1057–1392 at the coarse scale (VN and VS). The smaller 12.5 m pixel spacing of the ASAR images meant that on average 1344–8685 pixels were sampled by objects at fine to coarse scales.
Data analysis
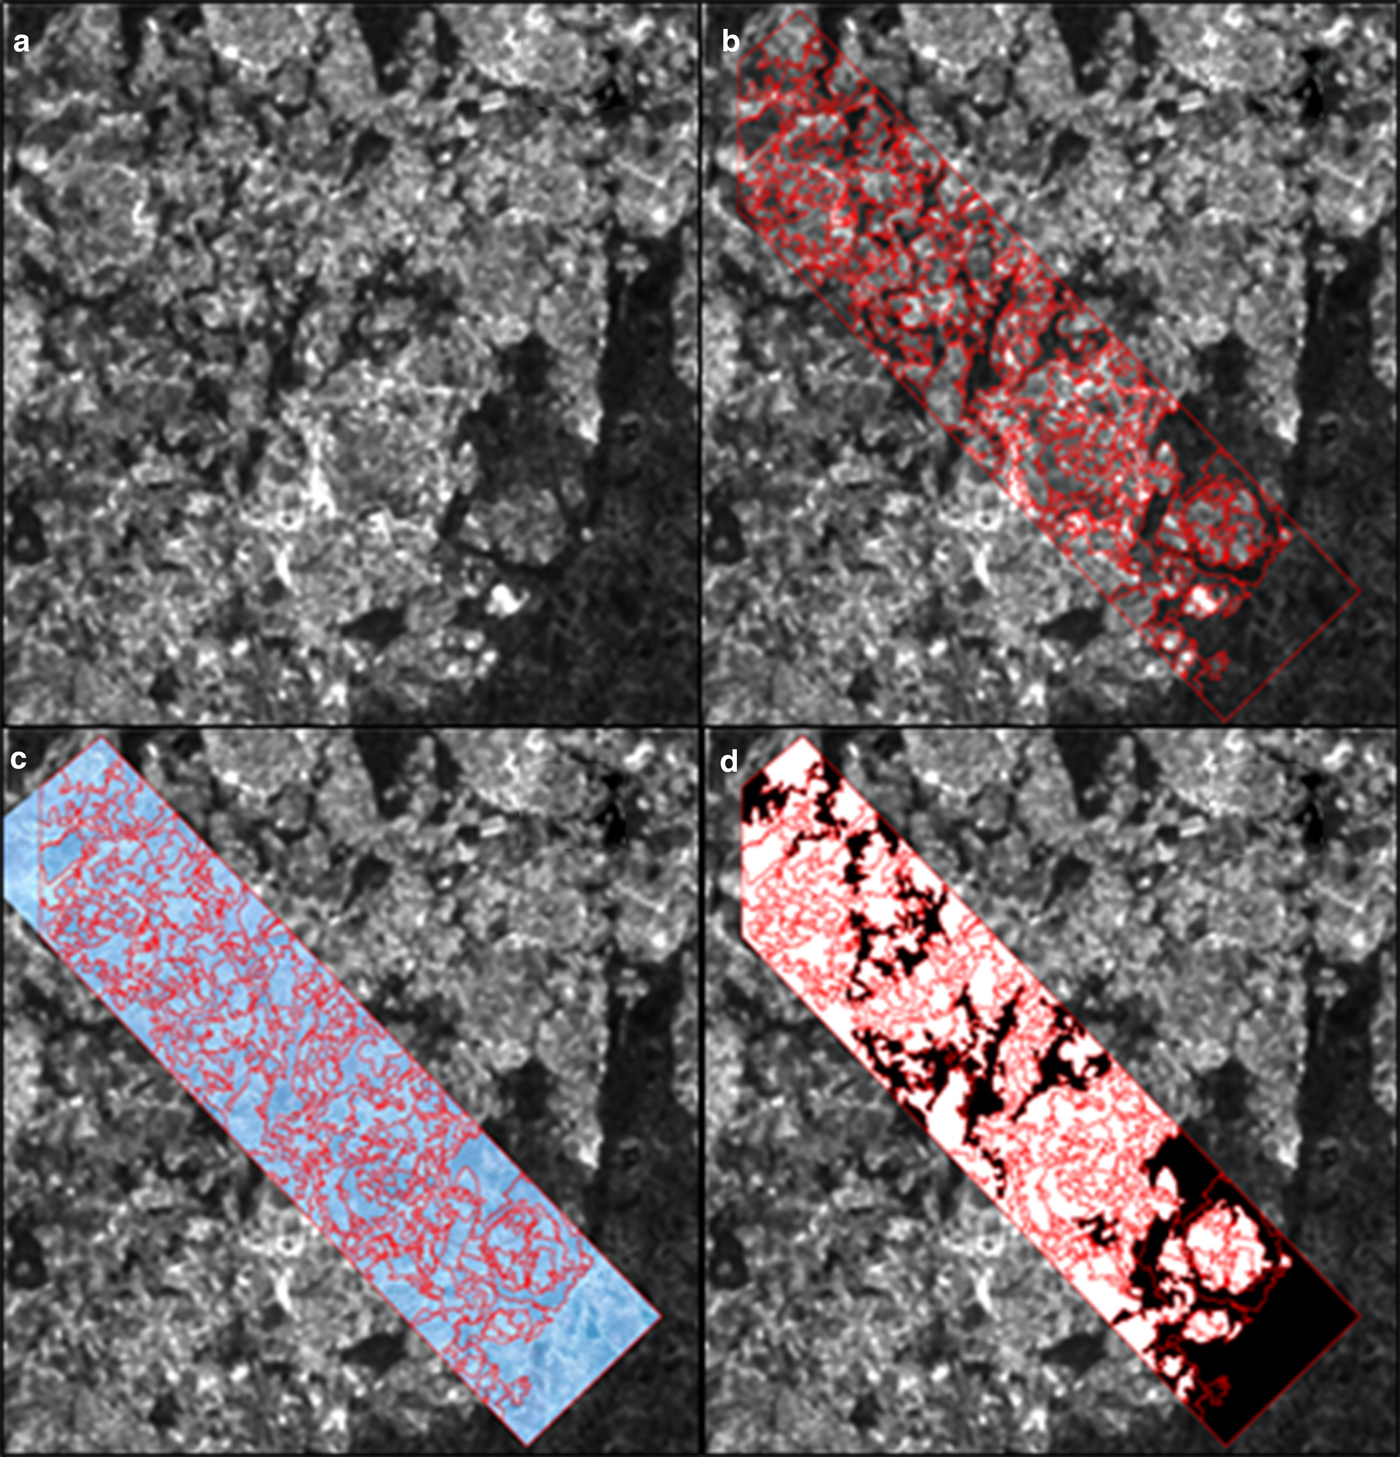
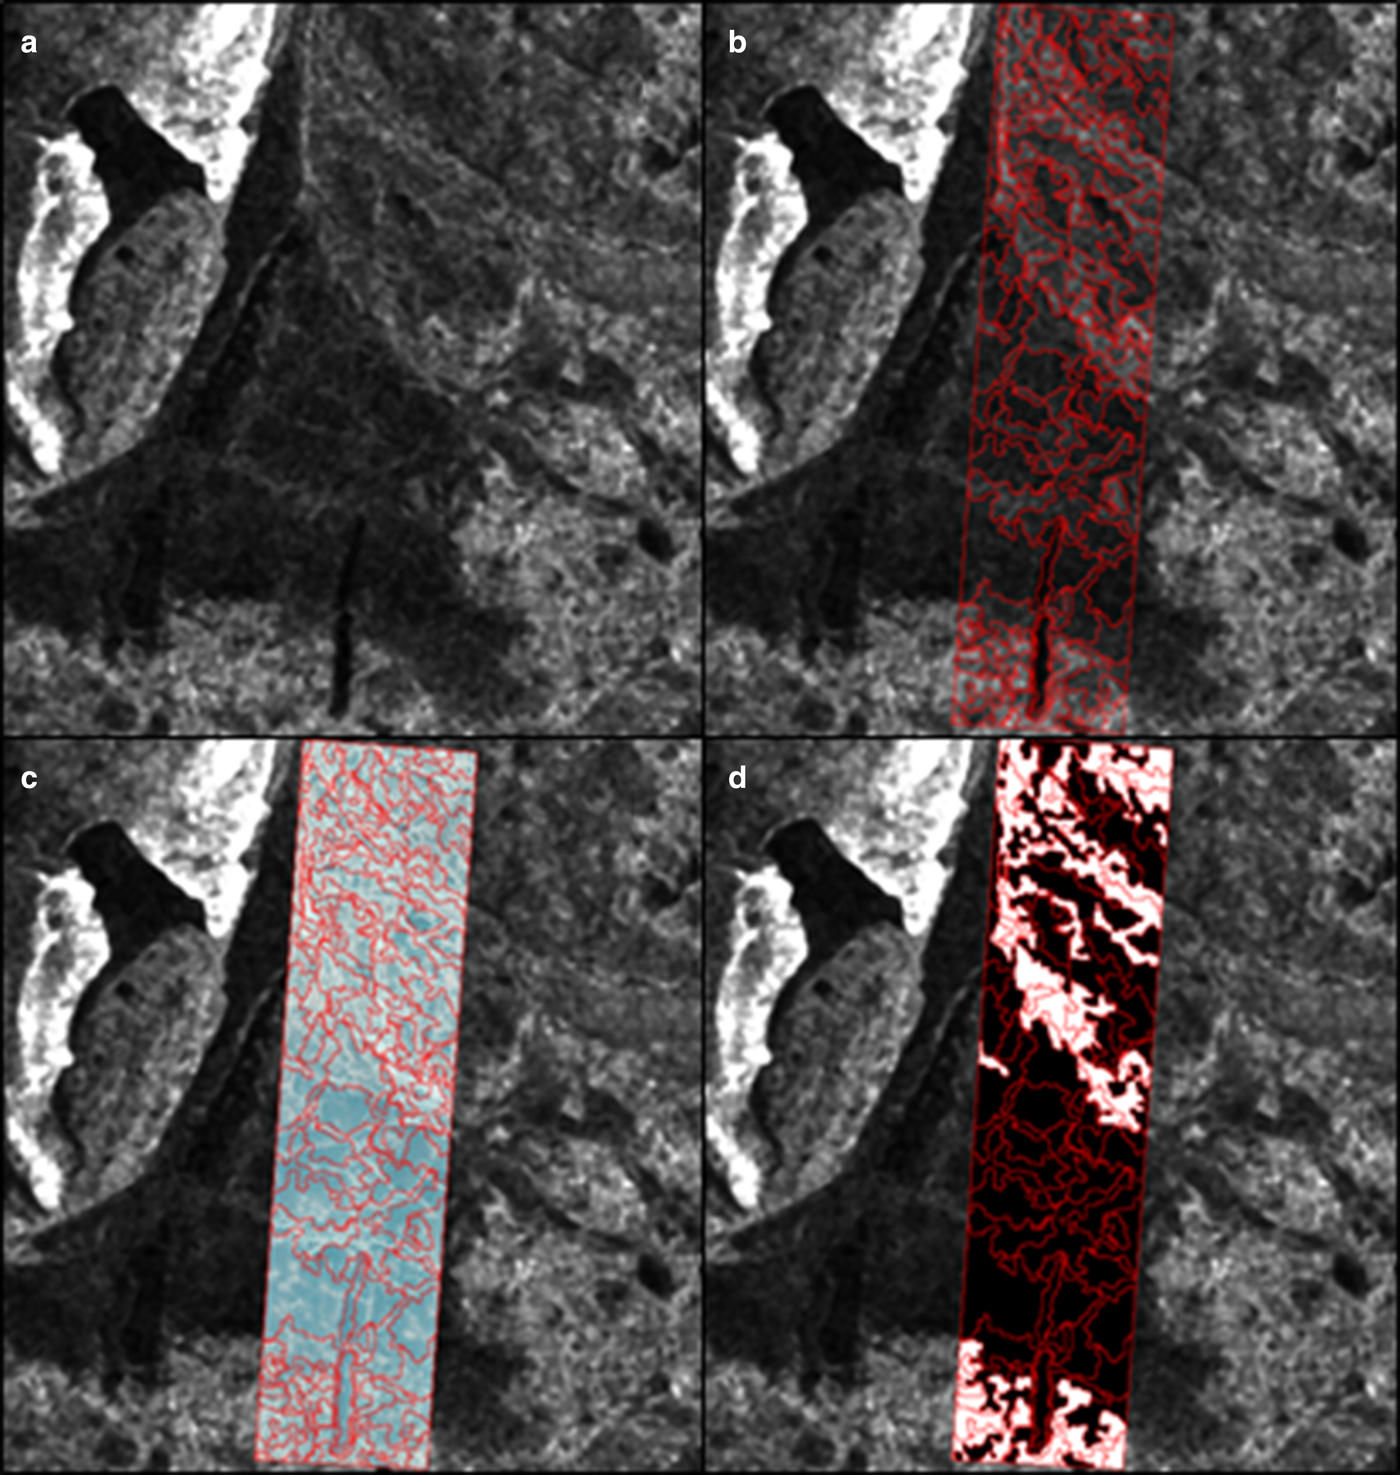
Objects from each site were labeled according to the dominant ice type contained within their bounds by using the winter SAR and spring VIS-NIR imagery, as well as ancillary information such as ice charts, to guide the analysis. Objects from AB all contained FYI. Objects from VN were labeled either FYI or MYI, since the two VN scenes comprised either smooth, thermodynamically grown FYI or MYI floes. The MYI-dominant scene from VN is shown in Figure 5, which also illustrates the segmentation and labeling process. Objects from VS were labeled FYI or DFYI, with the latter evident as predominantly linear and brightly backscattering features in SAR imagery (Fig. 6).
(a) A 20 by 20 km subset of a Sentinel-1 SAR scene of VN containing FYI and MYI; (b) The same scene with the object set overlaid on it; (c) The spring VIS-NIR scene of the same area; and (d) Result of the labelling of objects as FYI (black) or MYI (white).
(a) A 20 by 20 km subset of a Sentinel-1 SAR scene of VS containing FYI and DFYI; (b) The same scene with the object set overlaid on it; (c) The spring VIS-NIR scene of the same area; and (d) Result of the labelling of objects as FYI (black) or DFYI (white).
Each of the three object sets fine, sharp and coarse was overlaid on the SAR scenes of calibrated backscatter and texture. Object metrics were computed from individual objects as the mean of pixel values within an object. Each of the three objects sets pertaining to a VIS-NIR derived snow/ice and pond binary classification output was used to calculate the f p for each image object. This enabled an output database of winter backscatter and texture parameters, and spring f p, for each of the scenes in Table 1 for statistical comparisons.
An exploratory data analysis was used to characterize the backscatter and f p behavior of the sea-ice cover, and to assess backscatter levels relative to SAR sensor noise levels. A correlation analysis of object metrics enabled the examination of inter-relations between SAR backscatter, SAR texture and f p. The correlation analysis focused on the linear association between backscatter and f p values at fine, sharp and coarse scales. Assessment of the three ASAR scenes AB1–AB3 allowed us to examine the combined roles of object size (scale of aggregation) and θ on backscatter relationships with f p. Linear associations between texture and f p were calculated for the intermediate scale sharp image object set only. The Pearson's product–moment correlation coefficient (r) was used as a measure of linear association. The conventional deciBel (dB) transformation was applied to backscatter data (10*log10(σ°)) and, in some instances, the natural log transformation was applied to texture (log10) to achieve linear association between variables and f p.
Linear regression models for predicting f p from winter Sentinel-1 backscatter were constructed using data from the intermediate scale sharp image object set. Only backscatter and GLCM texture parameters derived from the HH polarization channel were used, and input data from only one site were used in order to control for temporal fluctuations in pond fraction (see Melt pond prediction model section). All texture parameters were used as potential explanatory variables, with log-transformed texture parameters used where appropriate.
The backward elimination method was used to develop regression models. Backward elimination is a stepwise method where all possible predictor variables that pass a multicollinearity tolerance criterion are entered into the model, and highly multicollinear variables are removed. Following entry, independent variables with the smallest partial correlation with the dependent variable are sequentially passed through stepping method criteria. If the variable does not contribute a significant increase in r 2 (α > 0.1) it is removed. This process is continued until the model with the smallest number of independent variables remains.
RESULTS AND DISCUSSION
Site conditions
Field data were collected as part of a dedicated sea-ice geophysical and remote-sensing study at the AB site from 5 May to 15 July 2006. In 2016, a multidisciplinary sea-ice campaign was conducted on smooth FYI at DS near Cambridge Bay from 15 April to 22 June, though this location was ~150 km west of site VS. We chose site VS for some remote-sensing studies during the 2016 campaign since it provided a diversity of ice conditions lacking at the field site. No field data were collected in 2015.
Air temperature data were used to guide the selection of ASAR and Sentinel-1 scenes originally acquired during winter (pre-melt) conditions. In the seasonal period leading up to the ASAR acquisitions at AB, the maximum hourly 10 m air temperature was −9.6°C. The ASAR images of AB were collected at hourly air temperatures of −14.6°C or lower. The maximum hourly 10 m air temperature at the Environment Canada Cambridge Bay airport station (69.11N, −105.14W) in the period leading up to the Sentinel-1 acquisitions of VN in 2015 was −13.2°C. The Senitnel-1 images of VN were collected at an hourly temperature of −26.9°C. In 2016, air temperatures recorded at the same station showed a maximum temperature of −15.2°C in the lead up period and −27.2°C at acquisition.
Figure 7 shows time series f p measurements made at site AB, within the same area covered by the acquired VIS-NIR scene from that campaign, and at site DS, 150 km east of the VIS-NIR scene acquired at VS during that campaign. Field measurements of f p came from manual transects, where a surface class and depth (not shown) was recorded every 0.5 m along a 200 m line perpendicular to the major axes of melt ponds and snow/ice patches. Recorded classes were: snow, bare ice, melt pond, frozen melt pond/ice lid and slush/mixture; 400 points were logged during each transect. This approach is reliable for recording an areally representative f p on smooth FYI only, i.e. when there is a quasi-uniform distribution of ponds and ice patches determined by the pre-melt alignment of snow dunes (Grenfell and Perovich, Reference Grenfell and Perovich2004; Istomina and others, Reference Istomina2015). It is a useful approach for recording the time series evolution of f p and other surface features, though consideration must be given to estimation error due to mis-alignment. We tested for mis-alignment error by plotting the location of the in situ transect line on the classified VIS-NIR scene from AB, and determining the f p for that line and lines at 10° intervals to ±20°. The f p range across all angles was 0.06. Figure 7 also shows the timings of VIS-NIR acquisitions at AB and VS, along with means and SDs of f p derived from classified scenes.
Time series melt pond fraction recorded at the Allen Bay (AB) site in 2006, and at the Dease Strait (DS) site in 2016, from the date of pond onset. Orange and blue markers denote the acquisition times of high-resolution VIS-NIR scenes capture at AB in 2006, and Victoria South (150 km east of DS), respectively. The markers also indicate the means and SDs of melt pond fraction derived from the VIS-NIR scenes after classification.
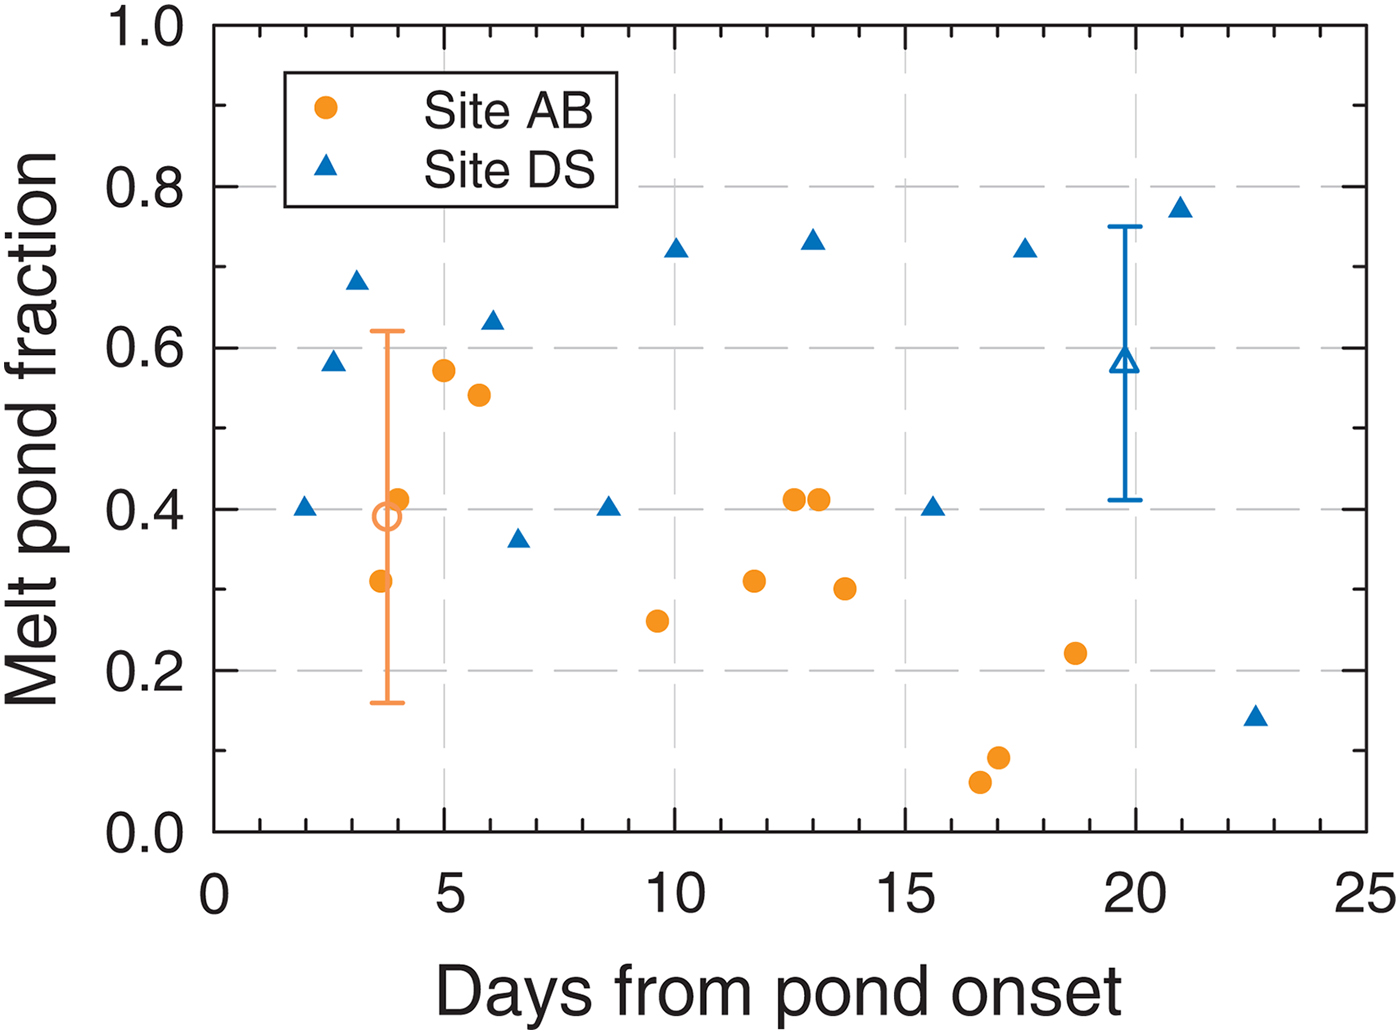
From Figure 7, it is apparent that the VIS-NIR scene at AB was acquired 3.8 d after melt ponds formed, when f p was rapidly increasing but still <0.5. This timing is just prior to the seasonal f p peak for smooth FYI, when f p is growing to its seasonal maximum due to a rapid flux of melt water from the decaying meteoric snow cover (Eicken and others, Reference Eicken, Krouse, Kadko and Perovich2002). When the VIS-NIR scene at VS was acquired, our observations on smooth FYI at DS indicated that ponds formed 19.8 d earlier. The f p at DS was high at ≥0.7, though the snow cover had ablated and fluctuations in f p linked to diurnal melt rates were evident. There is a good agreement between field and satellite-derived f p at AB, whereas an inconsistency between field-derived f p from DS, and satellite-derived f p from VS, is apparent. Note that the offset in f p between DS and VS is due to the inclusion of DFYI and FYI at VS, whereas at DS only FYI is captured (see Fig. 6). Since we did not have field data linked to the VN acquisitions, an examination of cloud-free MODIS reflectance images indicated that the VIS-NIR images were acquired 14 d after pond onset.
Figure 8 shows f p distributions according to major ice types FYI and MYI derived from all acquired VIS-NIR scenes. From Figure 8, it is evident that a wide range of f p on FYI and on MYI is presented by the VIS-NIR image data. As such, a wide range of ice conditions are included in the comparison to backscatter and texture statistics. The average f p for FYI image objects ranged from 0.07 at AB to 0.91 at VS. The lowest mean f p of 0.39 recorded at AB was measured shortly after pond formation began and f p was still increasing. The FYI f p distributions for VN and VS are very similar and representative of conditions after melt ponds have fully developed. Overall, the f p statistics are similar to other observations of FYI and MYI made at a similar scale, e.g. from aircraft observations (Perovich and others, Reference Perovich, Tucker and Ligett2002; Eicken and others, Reference Eicken, Grenfell, Perovich, Richter-Menge and Frey2004).
Melt pond fraction statistics derived from classified high-resolution VIS-NIR images, using the sharp image object set at each site to calculate melt pond fractions.

Relationship between winter backscatter and spring melt pond fraction
Incidence angle and scale: Allen Bay (AB) site
Correlations between backscatter parameters σ hh°, σ hv°, and R hv/hh, and spring f p for all three ASAR scenes at AB and all three aggregation scales, are given in Table 3. This enables a detailed examination of the combined roles of θ and scale (object size) on backscatter-f p relationships. The correlations in Table 3 are all significant at α = 0.01 (P-value <0.01), apart from R hv/hh and f p from AB2 derived using the coarse segmentation (r = 0.362). The polarization ratio R hv/hh and f p from scene AB1 are strongly positively correlated at coarse (r = 0.846) and sharp (r = 0.838) scales. This relationship points to a strong sensitivity of R hv/hh to the winter ice structure that leads to f p formation on the relatively smooth FYI forming in the sheltered bay at AB. This relationship is strongest for AB1, where backscatter was measured at shallow θ, here 39.1–42°. Relationships between R hv/hh and f p are much weaker at steeper θ.
Correlations r between Envisat-ASAR derived σ hh°, σ hv° and Rhv/hh, and melt pond fraction for FYI samples taken from all three AB scenes AB1–AB3, and by using all three scales of aggregation coarse, sharp and fine
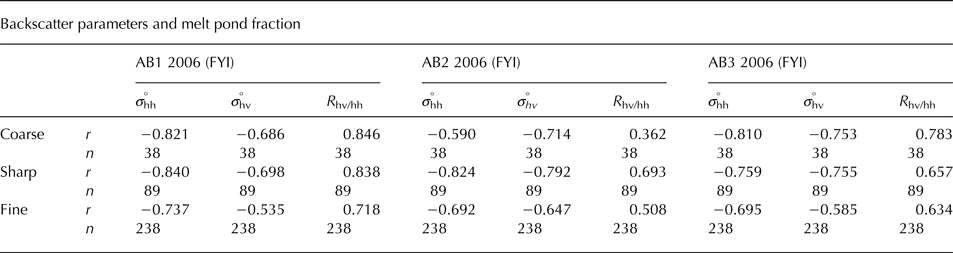
In Table 3 σ hh° and σ hv° are negatively associated with f p and the strongest correlations are found using the sharp object set. Generally strong correlations between σ hh° and f p are found in data obtained from all scenes spanning the near to far θ range examined. Focusing on results in Table 3 derived using the sharp object set only, the strongest relationship between σ hh° and f p comes from the shallow θ. The strongest relationship between σ hh° and f p is found from scene AB2 (r = −0.792), acquired at the steepest θ of the three AB scenes. As near-range σ hv° is more strongly correlated with f p than it is at mid- to far ranges, this implies that near-range σ hv° is more closely related to variations in surface structure on relatively smooth FYI that also lead to variations in f p shortly after pond onset. Given the low levels of σ hv° intensity from smooth FYI, caution is needed when interpreting σ hv° or R hv/hh. We found the overall σ hv° range from the three ASAR scenes to be −18.9 to −23.6 dB. Scenes AB1 and AB2 (ASAR swaths IS6 and IS2, respectively) had σ hv° consistently above the noise-equivalent sigma-zero (NESZ) of those swaths. Scene AB3 (ASAR swath IS4) σ hv° measurements were below the NESZ of that swath (ESA, 2006). The relatively consistent behavior of the σ hh° across the θ range investigated, combined with high σ hh° intensity levels relative to the system NESZ (here −9.2 to −20.4 dB) suggests the parameter can be used for the development of f p retrieval techniques spanning a large portion of the wide 400 km swath employed by Sentinel-1 operating in EW mode.
Correlations between GLCM texture parameters and spring f p for all three AB scenes, aggregated using the sharp scale, is shown in Table 4. All variables in Table 4 are significantly correlated with f p at α = 0.01 (P-value <0.01), though the log transformation is required in the case of CON. As before it must be stated that GLCM parameters derived from σ hv° or R hv/hh from AB3 may be contaminated by system noise. The potential utility of GLCM parameters derived from the σ hh° to be used along with σ hh° in the development of a f p estimation approach is apparent. All GLCM parameters derived from σ hh° at all examined θ, i.e. from AB1 to AB3, are strongly correlated with f p provided the log transformation is used where appropriate (see Table 4). GLCM parameters from σ hh° are generally most strongly associated with spring f p when measured at the shallow θ, here 39.1–42°.
Correlation r between Envisat-ASAR derived GLCM texture parameters contrast (CON), homogeneity (HOM), energy (ENE), entropy (ENT) and GLCM variance (GLV), and melt pond fraction for FYI samples taken from all three AB scenes AB1–AB3
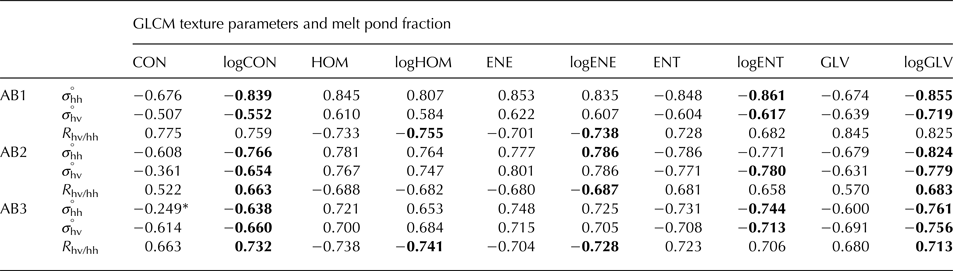
*Significant at the α = 0.05 level.
The prefix log is used to denote instances where the texture parameters were log scaled after they were derived from HH, HV and HV/HH bands. All correlations are significant at α = 0.01 unless otherwise noted. Bolded text is used to highlight situations where the log transformation of a parameter improved the strength of correlation with f p.
Sentinel-1 backscatter and FYI, DFYI and MYI pond fractions
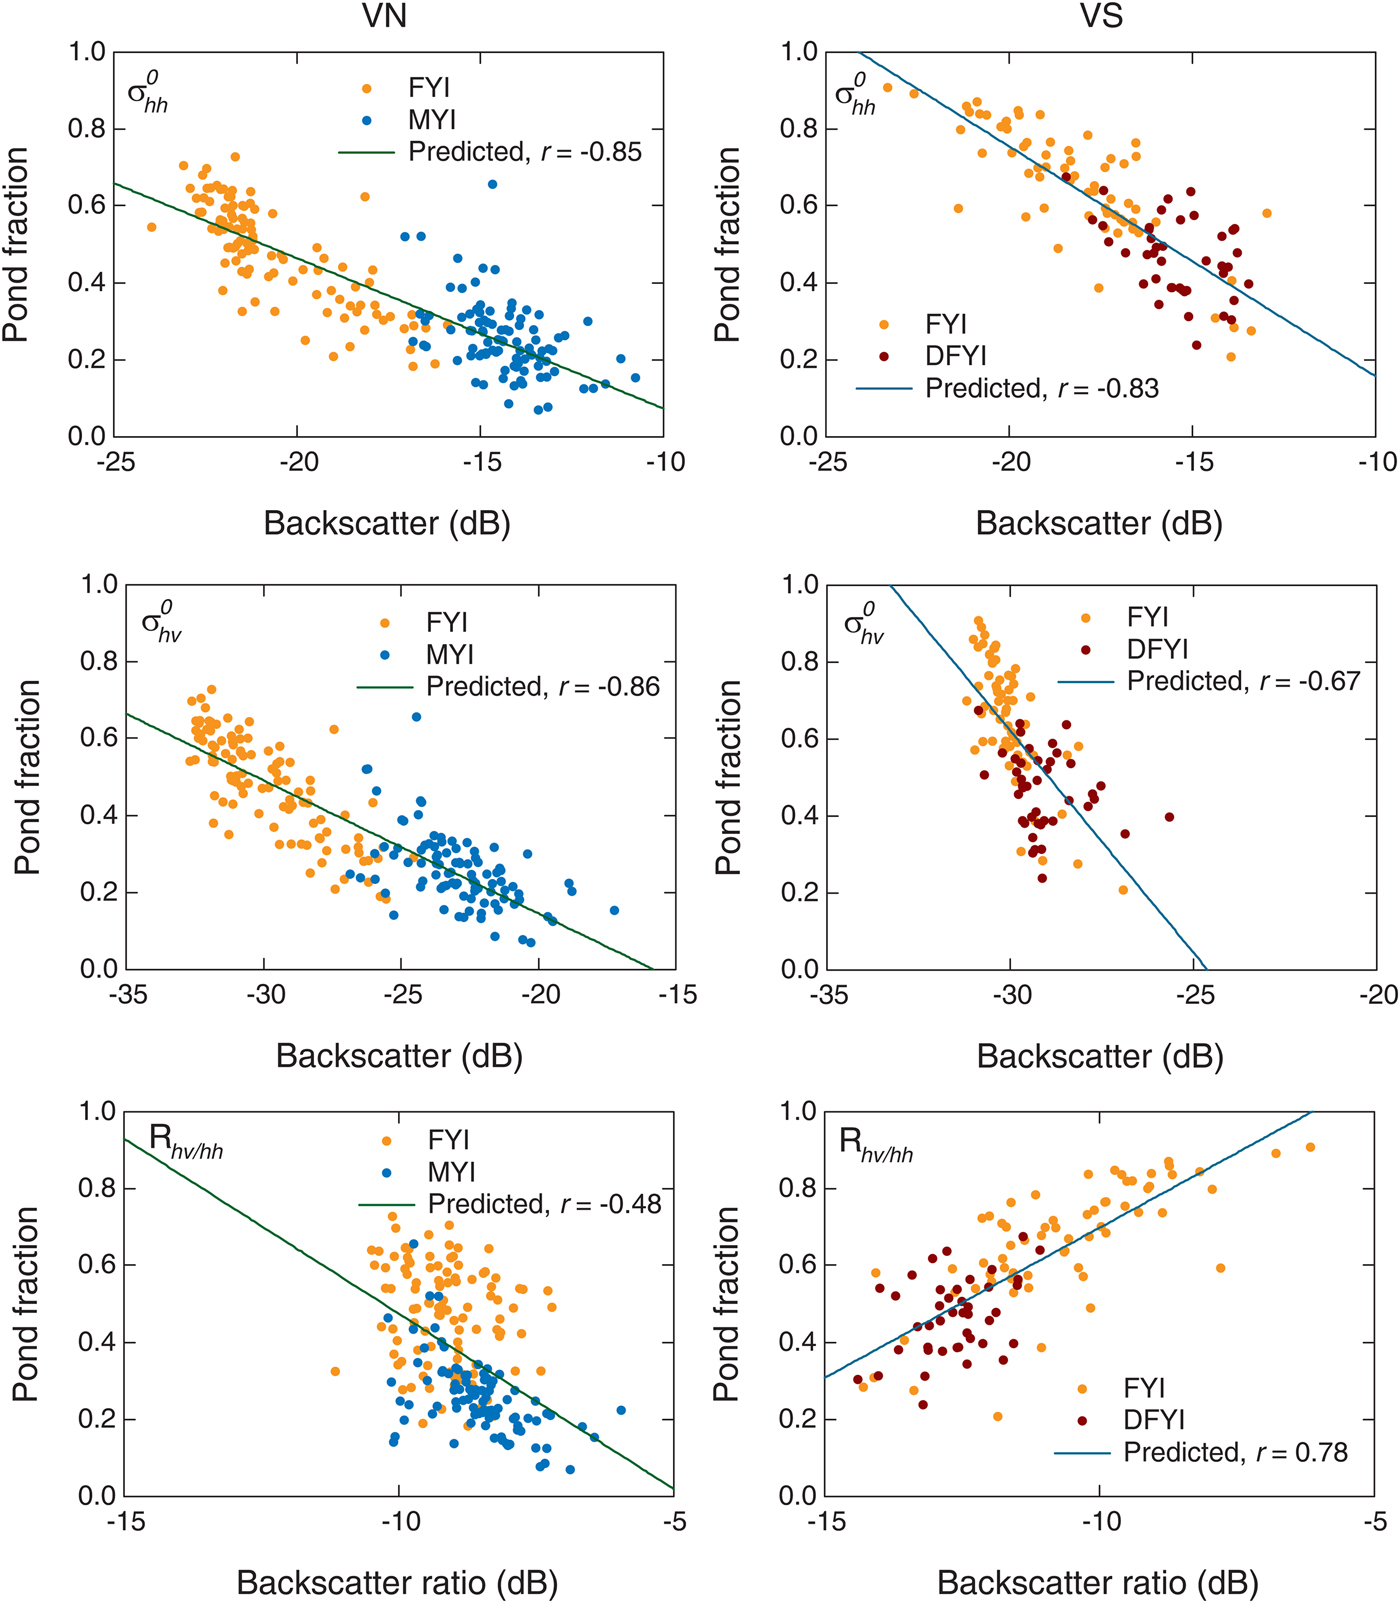
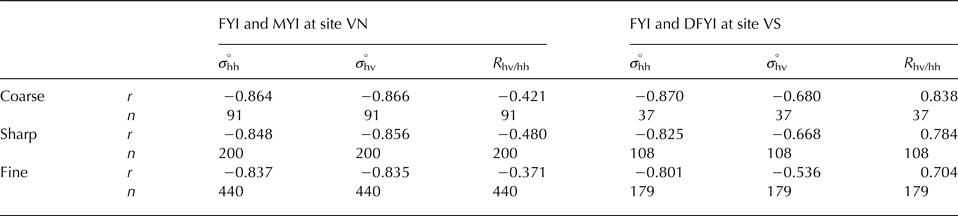
Correlations between winter Sentinel-1 backscatter parameters σ hh°, σ hv° and R hv/hh, and spring f p for FYI, DFYI and MYI are shown in Figure 9. Data in Figure 9 were produced from datasets collected at VN and VS, with backscatter and f p aggregated at the intermediate (sharp) scale. Table 5 provides additional information on significance testing as well as correlation results obtained by using the two other scales for aggregating data. The two-tailed significance of each correlation was tested at α = 0.01 and all correlations are significant (P-value = 0.00). The scatterplots in Figure 9 aid the interpretation of the winter backscatter behavior as it relates to spring f p, as well as intensity levels relative to the Sentinel-1 NESZ. FYI and MYI are compared separately from FYI and DFYI, given that those datasets were collected at different locations and in different conditions.
Correlations between pre-melt σ hh° and spring melt pond fraction (top), σ hv° and spring melt pond fraction (middle) and the cross-polarization ratio R hv/hh and spring melt pond fraction (bottom) for FYI and MYI sampled at site VN (left panel). Correlations between pre-melt σ hh° and spring melt pond fraction (top), σ hv° and spring melt pond fraction (middle), and the cross-polarization ratio R hv/hh and spring melt pond fraction (bottom) for FYI and DFYI sampled at site VS (right panel). All backscatter parameters are expressed in deciBel (dB) format. The Pearson's product moment correlation coefficient r is shown in each plot.
Correlations r between winter Sentinel-1 derived σ hh°, σ hv° and Rhv/hh, and melt pond fraction for all FYI and MYI samples from site VN, and all FYI and DFYI samples from site VS. Testing was done using object sets coarse, sharp and fine in each case. P-values from two-tailed significance tests (t-tests) of each correlation are all 0. The number of sampled objects (n) from each object set are also given
FYI and MYI are easily distinguishable during winter due to the higher bulk salinity of FYI compared with MYI, which acts to prevent the penetration of C-band microwaves into its volume. Typical ice salinities for FYI are 5–8 ppt at 1–2 m thickness and 0.1–3 ppt for MYI (Weeks, Reference Weeks1981). MYI has much lower salinity due to desalination from a previous summer, thereby promoting the penetration of C-band microwaves and significant volume scattering from air bubbles and other constituents in the desalinated upper ice layer (Hallikainen and Winebrenner, Reference Hallikainen, Winebrenner and Carsey1992). This volume scattering mechanism enhances the backscatter of energy to the SAR and increases intensity levels relative to FYI. As well, thermodynamically grown FYI is relatively smooth compared with MYI which has meter-scale variations in topography due to the ablation and refreezing of melt ponds and hummocks from a previous year (or years’) melt. The large-scale variations in topography also enhance backscatter by increasing the occurrence of features titled toward the SAR, which enhance microwave backscatter. The σ hh° and σ hv° plots that combine FYI and MYI in Figure 9 show a continuum of backscatter intensity related to those ice types that is also connected to the ice topography, which controls the formation of spring melt ponds.
Comparing FYI and DFYI in Figure 9, there also appears to be a continuum of σ hh° and σ hv° intensity levels which are also connected to ice topography and spring f p. As winter σ hh° and σ hv° increases due to enhanced backscatter from the ridges and ice blocks that make up DFYI, the spring f p decreases due to topographical controls on melt water distribution from the same ridges and ice blocks (Eicken and others, Reference Eicken, Krouse, Kadko and Perovich2002). The σ hh° channel is more sensitive to this relationship; the σ hv° to f p relationship is much weaker.
As with the Envisat-ASAR examined above, consideration must be given to low σ hv° measured by Sentinel-1 relative to the NESZ for the sensor and image mode. The ground range detected EW product used here has a maximum NESZ of −22 dB, though the σ hv° data in Figure 9 suggest sensitivity to sea-ice backscatter mechanisms down to −30 dB or less. Nonetheless, uncertainty regarding the utility of σ hv°, and by extension R hv/hh, is exemplified by looking at the general behavior of those parameters in Figure 9. In the right panel of Figure 9, FYI and DFYI σ hh° decreases with increasing f p, whereas σ hv° is almost static at ~−30 dB. The association between R hv/hh and f p switches from negative to positive in the left and right panels of Figure 9, despite the consistent behavior of σ hh°. Given that σ hv° levels are so low, combined with the fact that the HV polarization channel of Sentinel-1 is subject to variable swath-dependent noise levels across the sub-swaths which make up the EW and IW modes, backscatter and texture information from the HH polarization channel from Sentinel-1 should only be used.
Table 5 reveals generalizations to larger aggregation units that are matched by increases in the magnitudes of r. This is expected based on common geographic theory concerning modifiable areal units, where an increase in the magnitude of r between two variables occurs when those two variables are aggregated by larger units such as grid cells (Fotheringham and Wong, Reference Fotheringham and Wong1991). However, aggregating by larger units does not reveal the concomitant loss of variability in the dataset. Should a regression model be developed from the data created at the coarse resolution, with fewest aggregation units (n = 37 or n = 91), the explanatory power of the model would be expected to be weaker than would a model derived from a greater number of smaller aggregation units, in this case image segments.
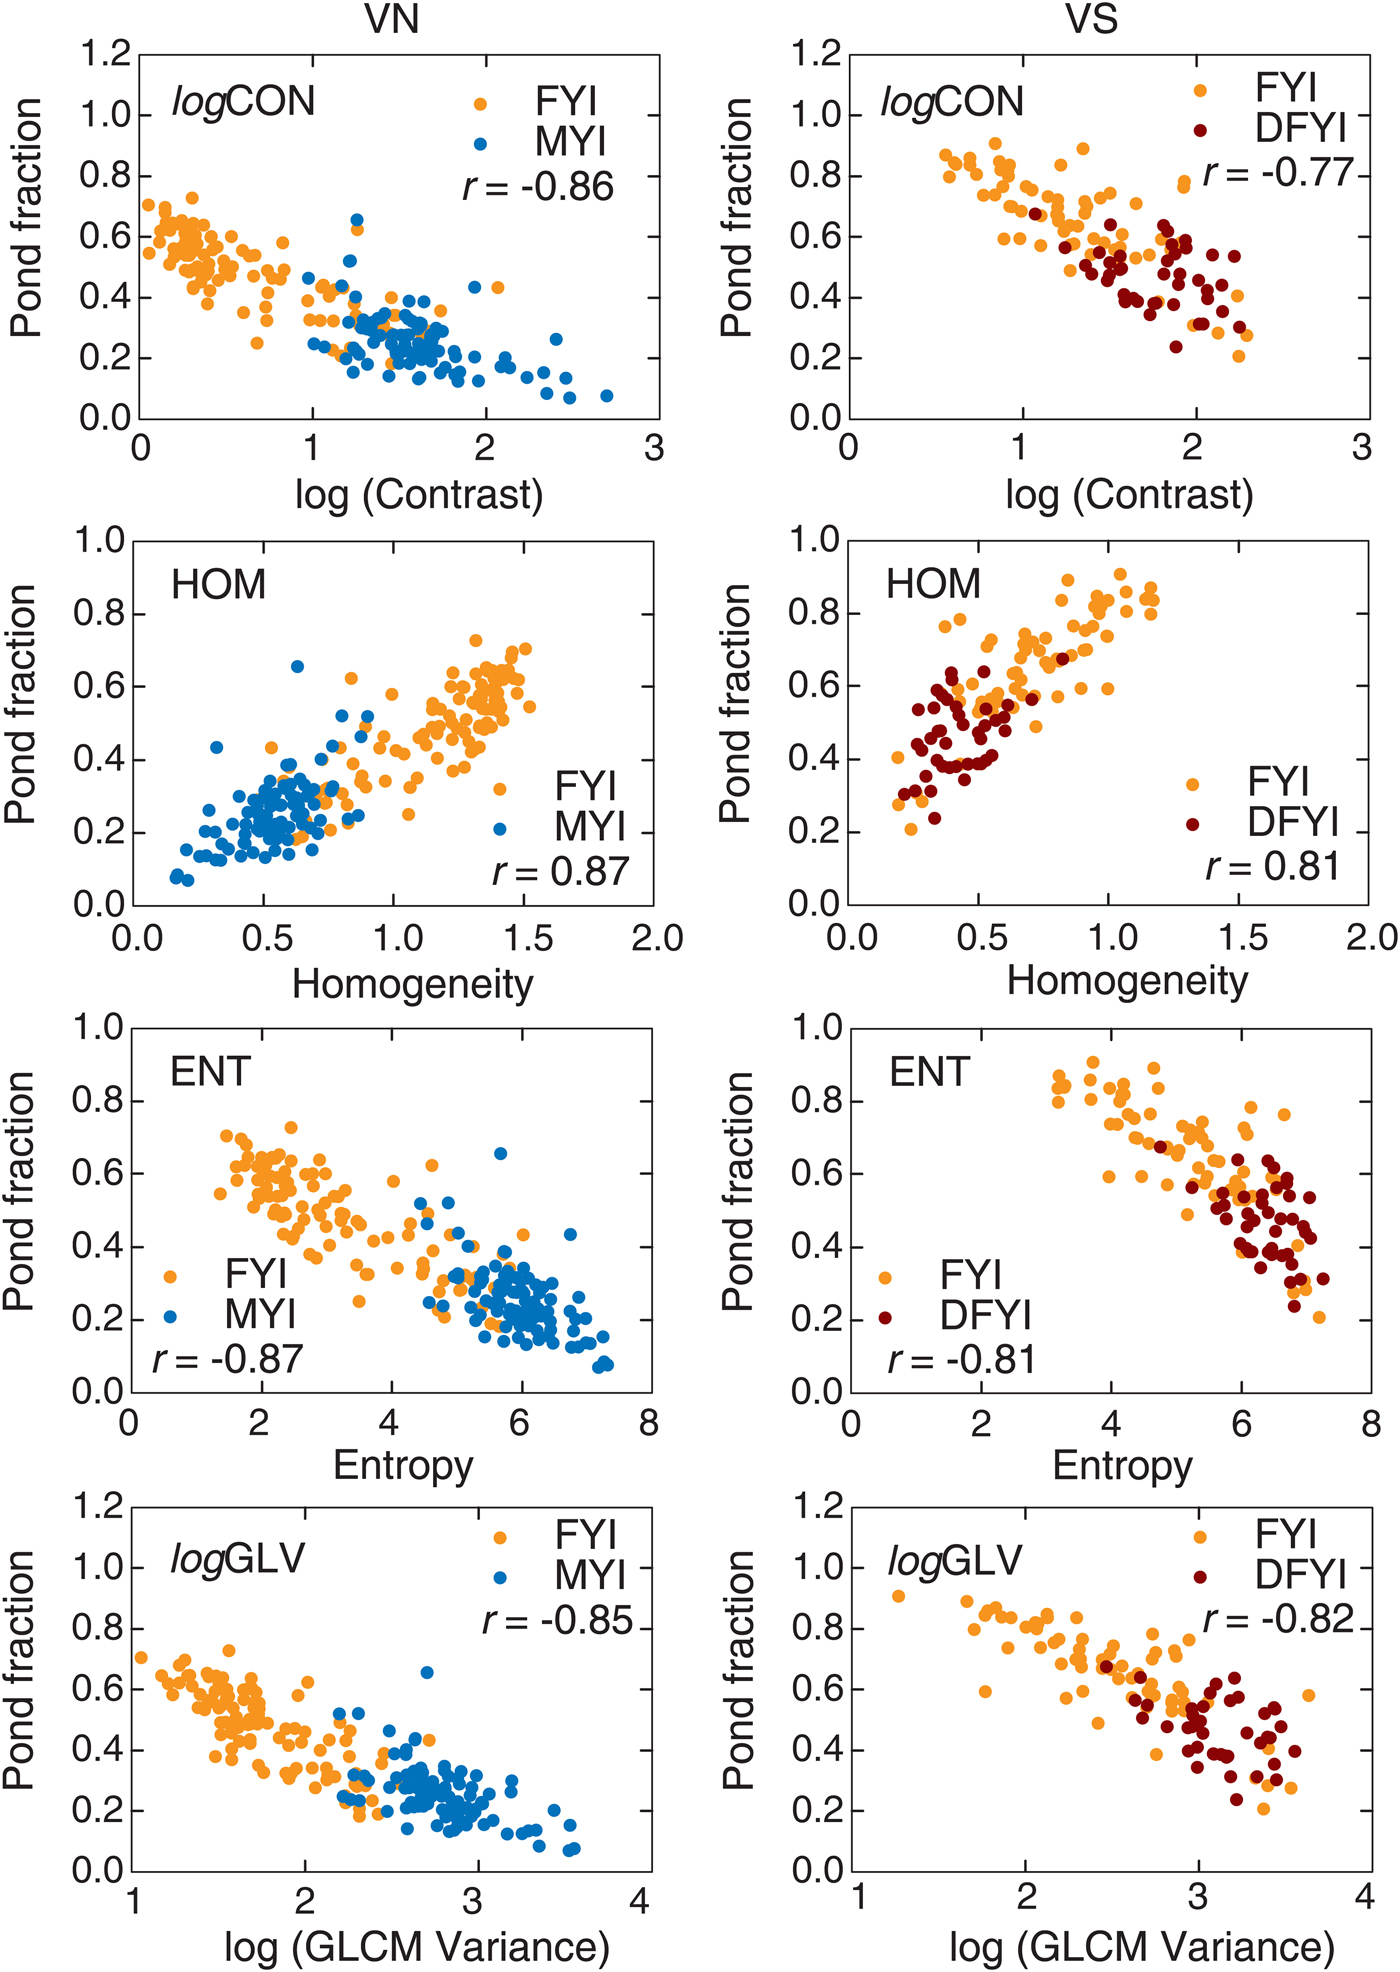
Scatterplots showing relationships between winter GLCM texture parameters derived from σ hh° and spring f p are given in Figure 10. Data were aggregated at the sharp scale, and log transformed texture parameters were shown in cases where the strength of association was stronger. All GLCM parameters in Figure 10 are significantly correlated with f p α = 0.01 (P-value = 0.00). The texture variable logENE is not shown in Figure 10 since it is co-linear with HOM. Relationships between winter GLCM texture parameters and spring f p are intuitive when considered in the context of the heterogeneity of spatial patterns of single-polarization backscatter intensity in SAR images as they relate to ice type. Relatively smooth FYI, which evolves to have high spring f p, is also characterized by spatially homogeneous zones of backscatter intensity. MYI, which has a more complex topography and evolves to have lower f p compared with FYI, is characterized by heterogeneous distributions of scattering mechanisms and pixel intensity values (see Fig. 5a). DFYI, which can have similar σ hh° intensity levels as MYI, also have more complex textures when compared with FYI. As such the texture parameters which are responsive to spatial heterogeneity or disorder, being logCON, ENT and GLV, are highest for winter MYI and DFYI and evolve to lower f p. Texture parameters which are responsive to orderliness or uniformity, such as HOM and logENE (not shown), are highest for winter FYI evolve to higher f p. This behavior of GLCM texture parameters of winter sea ice is not unfounded, as the inclusion of GLCM texture parameters has been shown to improve the classifications of sea-ice types in winter SAR images (Clausi and Deng, Reference Clausi and Deng2003). However, the further connection of textural features of ice types to spring f p has not yet been made.
Scatterplots of winter GLCM texture parameters and spring melt pond fraction for sites VN (FYI and MYI) and VS (FYI and DFYI). The Pearson's product moment correlation coefficient r is shown in each plot.
Melt pond prediction model
As a first step in the development of a f p prediction model, we considered the importance of evaluating data collected in different conditions separately in this study. A robust f p prediction model, i.e. one that includes a wide range of FYI and MYI features, would include input data of all features captured in the same controlled conditions. Unfortunately the limiting factor in this study is the scarcity of high-resolution optical scenes from which to derive spring f p data coincident to winter C-band SAR imagery. Moreover, C-band σ hh° and σ hv° are affected by θ; both parameters generally decrease with increasing θ, with the rate of decrease greater for FYI compared with MYI (Geldsetzer and others, Reference Geldsetzer, Mead, Yackel, Scharien and Howell2007). This effect would mask backscatter to f p relationship if not controlled.
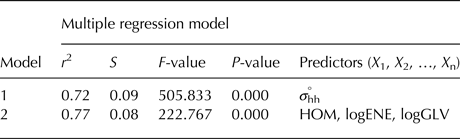
Based on the above, we fit linear regression models to the Sentinel-1 backscatter and texture data, and f p data from the VN site only. Our rationale for choosing data from VN only is based on the ideal timing of those VIS-NIR acquisitions relative to the sub-stage of melt pond evolution. Based on in situ studies (Eicken and others, Reference Eicken, Krouse, Kadko and Perovich2002; Polashenski and others, Reference Polashenski, Perovich and Courville2012 and Landy and others, Reference Landy, Ehn, Shields and Barber2014), rapid changes in f p linked to melt rates and significant meltwater inputs from snow are known to occur. After the snow cover has ablated, f p is comparatively stable in time and varies in space according to topographic relief (macroscopic flaws such as seal holes and leads excepted). Eventually permeability thresholds are crossed and rapid vertical drainage of melt ponds occur in a spatially heterogeneous manner. Based on the timing of acquisition after the onset of ponds (14 d), visual inspection of the pan-sharpened VIS-NIR imagery, and statistics derived from classified VIS-NIR scenes (Fig. 8), we are confident that site VN is most representative of this sub-stage of melt pond evolution, when f p is linked to ice topography, hence closely related to ice type. On the other hand, VIS-NIR data at AB and VS were acquired during the initial snow melt and drainage sub-stages, respectively. The VN data capture winter FYI and MYI that evolves into a wide range of f p, from 0.07 to 0.73 (see Fig. 8). Regression model fitting was done using two approaches: (i) using σ hh° only; and (ii) using σ hh° and candidate texture parameters from Figure 10. A table of the output regression model parameters is given in Table 6 and the derived regression equations are shown below.
 $$f_{\rm p} = - 0.317 - 0.039X_1,$$
 $$f_{\rm p} = - 0.533 + 0.853X_1 - 1.157X_2 - 0.069X_3.$$
Summary of regression model outputs. Shown for each model are the coefficient of determination (r 2), standard error of the estimate (S), the F-value, the P-value, and the input predictor variables
The Sentinel-1 data used for regression model development was collected over a θ-range of 36.5–39.7°, a portion of the studied angles within which strong σ hh° and texture relationships with f p were observed. We expect the models would be applicable to a wider range of θ, as the change in σ hh° from FYI and MYI is not significant from ~35 to 45° (testing is required). Furthermore, the models may prove capable of predicting f p of DFYI to within an acceptable error, as both MYI and DFYI display similar σ hh° and texture characteristics, and evolve to overlapping f p in spring. Fortunately, with Sentinel-1 operating as a two satellite constellation with near-polar orbits 180° apart, the θ limitation of the models presented here can be overcome by the regular collection of scenes during the winter period.
CONCLUSIONS
In this study, we matched winter C-band SAR scenes with spring high-resolution VIS-NIR scenes in order to examine linkages between SAR backscatter, texture and melt pond fraction. As a key first step to the development of a melt pond fraction prediction model, we examined the roles of incidence angle and scale on correlations between backscatter parameters and pond fraction. An object-based image analysis, with objects (or segments) representing zones of ice with unique characteristics, provided a logical basis for comparing the winter and spring thermodynamic sea-ice states. First-year ice, deformed first-year ice and multiyear ice types were included in the analysis.
Backscatter parameters σ hh° and σ hv°, and GLCM texture parameters derived from σ hh° and σ hv°, and spring melt pond fraction on all ice types are strongly correlated. Backscatter parameters derived from σ hv° were found to be of limited utility due to the intensity levels approaching or within the NESZ; this is particularly true in the case of Sentinel-1. The exclusion of σ hv° is not critical. We found that σ hh°, and GLCM texture parameters homogeneity, energy and GLCM variance derived from σ hh°, are most closely linked to spring melt pond fraction on the basis of correlation and regression testing. Two simple linear models for estimating melt pond fraction of FYI and MYI from the HH polarization channel of Sentinel-1 were proposed, one utilizing only σ hh° as the explanatory variable and one utilizing σ hh° and texture parameters derived from σ hh° as explanatory variables. The model was created using input data obtained during the sub-stage of melt pond evolution when pond fraction is related to ice topography and ice type, and not influenced by rapid fluctuations due to snow melt (early ponding) or drainage processes (late ponding). The model r 2 were 0.72 and 0.77, with standard errors of 0.09 and 0.08, respectively.
The models developed here apply to σ hh° collected over a narrow θ range (37–40°). This is partially a consequence of relying on sporadic high-resolution VIS-NIR scenes to derive spatially coincident f p information for model development. However, with regular C-band frequency SAR coverage of the Arctic, especially by Sentinel-1 operating in its full two satellite constellation now, coverage of ice covered regions at some point during winter within a small θ range is achievable. As Sentinel-1 data are free and open access, its implementation is relatively straightforward. A legacy of C-band SARs providing wide-swath HH polarization data, as well as anticipated continuity including new missions such as RADARSAT Constellation Mission (RCM) in 2018, provides alternatives to Sentinel-1.
A first attempt at predicting sea-ice melt pond fraction from winter SAR data has been presented in this study. A method for estimating a single pond fraction value describing the relative susceptibility of the sea-ice surface to flooding according to its topography has been presented. A framework has been established for the development of more robust and widely applicable melt pond prediction algorithms, i.e. ones that are extendable to a wider range of ice conditions and applicable to a wider range of radar parameters such as incidence or frequency. The ability to predict the spring melt pond fraction during the preceding winter months will assist seasonal ice forecasts and outlooks by providing key parameter that is linked to the sea-ice thermodynamic state during the critical melting period. Application of this approach on a local to regional scales, made possible given the high spatial resolution of Sentinel-1 (40 m pixel spacing in EW mode), will assist process studies by providing an indication of how preconditioned the ice cover is for mass and energy exchanges that are linked to melt pond fraction, such as carbon uptake and light transmittance to the upper ocean layer.
ACKNOWLEDGEMENTS
This research was supported by a Marine Environmental Observation Prediction and Response (MEOPAR) grant No. 1.22, and a Natural Sciences and Engineering Research Council of Canada Discovery Grant. The Climate Research Division of Environment and Climate Change Canada, Toronto, Ontario, Canada is thanked for their scientific support and collaboration. The Changing Earth Science Network, part of the European Space Agency's Support to Science Element (STSE) is acknowledged for support in research leading to the development of this work. We are very appreciative of the staff and crew at the Polar Continental Shelf Project in Resolute Bay and the Canadian High Arctic Research Station for providing logistical support.


 Open access

