





Bipolar disorder is a multi-component mental health disorder characterised by recurring episodes of depression and mania, with a population prevalence of 1–4%.Reference Merikangas, Jin, He, Kessler, Lee and Sampson1 The clinical trajectory of bipolar disorder is highly variable, with phenomenological and biological heterogeneity contributing to differences in illness course and prognosis.Reference Soreca, Frank and Kupfer2 This makes accurate and timely diagnosis challenging, with patients reporting an average diagnostic delay of almost a decade.Reference Fritz, Russell, Allwang, Kuiper, Lampe and Malhi3 This delay is associated with poorer prognosis, including greater symptom severity and increased suicidality.Reference Drancourt, Etain, Lajnef, Henry, Raust and Cochet4,Reference Post, Leverich, Kupka, Keck, McElroy and Altshuler5
Recent research has aimed to reduce clinical heterogeneity by demarcating more homogenous subgroups of patients with bipolar disorder, with the aim of improving diagnostic accuracy and refining appropriate treatment options.Reference Duffy, Vandeleur, Heffer and Preisig6 It has been proposed that age at onset (AAO) may be a key variable in delineating these subgroups.Reference Leboyer, Henry, Paillere-Martinot and Bellivier7 Meta-analytic results indicate a differing clinical trajectory between early- and late-onset bipolar disorder, with an early AAO associated with longer delays to treatment, greater severity of depressive episodes, increased suicide risk, increased rates of hospital admission and higher levels of comorbid anxiety and substance misuse.Reference Agnew-Blais and Danese8,Reference Joslyn, Hawes, Hunt and Mitchell9 Additionally, initial evidence suggests that there is genetic homogeneity within AAO subgroups and heterogeneity between groups.Reference Etain, Mathieu, Rietschel, Maier, Albus and McKeon10–Reference Mathieu, Dizier, Etain, Jamain, Rietschel and Maier12 Despite this, no known research has comprehensively investigated potential psychosocial predictors of AAO.Reference Etain, Lajnef, Bellivier, Mathieu, Raust and Cochet13,Reference Baldessarini, Tondo, Vazquez, Undurraga, Maffei and Salvatore14 Identifying the risk factors that likely interact with various susceptibility genes to influence bipolar disorder AAO has the potential to inform diagnosis and targeted approaches for early intervention.
Objectives
We employed a supervised machine-learning approach to build a model examining which psychosocial factors are individually and collectively associated with bipolar disorder AAO. Potential predictors were selected based on their availability in our data-set and possible relevance to bipolar disorder AAO based on prior research. As the data was retrospective, we selected variables that could be reasonably considered as present ‘pre-onset’. These included: family history of suicide, psychiatric and/or affective disorders;Reference Hamshere, Gordon-Smith, Forty, Jones, Caesar and Fraser15–Reference Post, Altshuler, Kupka, McElroy, Frye and Rowe17 alcohol use;Reference Holtzman, Miller, Hooshmand, Wang, Chang and Hill18,Reference Javaid, Kennedy and de Luca19 drug use;Reference Lagerberg, Sundet, Aminoff, Berg, Ringen and Andreassen20,Reference Lin, McInnis, Potash, Willour, MacKinnon and DePaulo21 poor premorbid social and work adjustment;Reference Baldessarini, Tondo, Vazquez, Undurraga, Maffei and Salvatore14,Reference Hafeman, Merranko, Goldstein, Axelson, Goldstein and Monk22,Reference Tsuchiya, Byrne and Mortensen23 low educational attainment;Reference Tsuchiya, Byrne and Mortensen23 personality traits and temperament;Reference Akiskal, Hantouche and Allilaire24–Reference Hafeman, Merranko, Axelson, Goldstein, Goldstein and Monk26 childhood trauma or abuse;Reference Agnew-Blais and Danese8,Reference Daruy-Filho, Brietzke, Lafer and Grassi-Oliveira27–Reference Leverich and Post30 and stressful life events.Reference Hosang, Korszun, Jones, Jones, McGuffin and Farmer31,Reference Post, Altshuler, Leverich, Nolen, Kupka and Grunze32
Method
Our study used data from the UK Bipolar Disorder Research Network cohort (BDRN; www.bdrn.org), which is an on-going programme of research into the genetic and non-genetic determinants of bipolar disorder and related mood disorders. All procedures contributing to this work comply with the ethical standards of the relevant national and institutional committees on human experimentation and with the Helsinki Declaration of 1975, as revised in 2008. All procedures involving human patients were approved by a Heath Research Authority NHS Research Ethics Committee (approval number MREC/97/7/01) and all participating NHS Trusts and Health Boards. Written informed consent was obtained from all participants. The data used in the current analysis was accrued from February 2002 to June 2015, and analysed in 2021.
Participants were recruited throughout the UK via NHS services and advertisements through patient support organisations. Inclusion criteria were aged 18 years or over, able to provide written informed consent, met DSM-IV criteria for bipolar disorder, and onset of mood symptoms was before the age of 65 years. Individuals were excluded if they experienced affective illness only because of substance use or medical illness, or were biologically related to another study participant.
Measures
Diagnosis
Best-estimate main lifetime diagnosis was made according to DSM-IV criteria based on in-depth interview with the Schedules for Clinical Assessment in Neuropsychiatry,Reference Wing, Babor, Brugha, Burke, Cooper and Giel33 and review of psychiatric and primary care case notes, where available.
Outcome measure
The primary outcome variable was AAO of bipolar disorder, defined as the age at first clinically significant impairment owing to manic or depressive symptoms. Signs of clinically significant impairment included arguments and/or fights, missed work and/or job loss, treatment referral, the use of lithium or neuroleptics for treatment of manic symptoms, disrupted work or social life, police involvement, family breakdown and psychotic features.
Candidate predictors
Twenty-eight predictors (see Supplementary Appendix 1, Section 1.1 available at https://doi.org/10.1192/bjo.2022.536 for full details) were considered. These were selected based on availability in our data-set and potential relevance to bipolar disorder AAO based on prior research. These were: family history of affective disorders, psychiatric disorders and/or suicide; any known sexual and/or physical and/or emotional childhood abuse occurring before the age of 16 years; average number of units of alcohol consumed per week in the year before bipolar disorder onset; regular use of cannabinoids or unspecified non-prescription drugs in the year before bipolar disorder onset; highest level of educational attainment; poor premorbid work and social adjustment (evaluated with the Modified Operational Criteral Symptom Checklist Details and History QuestionnaireReference Brittain, Stahl, Rucker, Kawadler and Schumann34,Reference Azevedo, Soares, Coelho, Dourado, Valente and Macedo35 ); trait neuroticism (assessed with the neuroticism subscale of the Eysenck Personality Questionnaire RevisedReference Eysenck and Eysenck36); schizotypal personality traits (self-report Kings Schizotypy QuestionnaireReference Jones, Cardno, Murphy, Sanders, Gray and Mccarthy37); cyclothymic, depressive, irritable, hyperthymic and anxious temperament (evaluated with the Temperament Evaluation of Memphis, Pisa, Paris and San Diego Auto-QuestionnaireReference Akiskal, Mv, Jean-Louis, Rapaport, Kelsoe and Gillin38) and significant life events (11 ‘yes/no’ questions from the Brief Life Events QuestionnaireReference Brugha, Bebbington and Hurry39,Reference Brugha and Cragg40 ).
Demographics
Age at interview and individuals’ highest level of occupation were recorded. These were not considered as potential predictor variables as they did not specifically relate to pre-bipolar disorder onset. For individuals’ highest occupation, responses were grouped into ‘professional’, ‘non-professional’, ‘never worked’, ‘student’ and ‘unknown’.
Statistical analysis
The R code used for data pre-processing and analysis is openly available via the Open Science Framework.
Data pre-processing
Analysis was conducted in R version 4.0.3 (2020-10-10)Reference R Core Team41 for Mac OS (R Foundation for Statistical Computing, Vienna, Austria; https://www.r-project.org/), using the ‘glmnet’ package version 4.1.1 for the main analysis,Reference Friedman, Hastie and Tibshirani42,Reference Friedman, Hastie, Simon, Tibshirani and Hastie43 along with multiple helper packages (listed in Supplementary Appendix 1, Section 2.1 with references); figures were produced with the ‘ggplot2’ package version 3.3.5.Reference Wickham44 Missing variables were removed with the listwise-deletion method, with analysis conducted on this data-set. The data-sets with versus without missing data removed were not statistically significantly different from one another (Supplementary Appendix 1, Section 2.2). Pre-processing steps for the full sample included (a) log transforming our outcome variable, AAO, so that age was correctly modelled as a positive number in analysesReference Steyerberg45 (Supplementary Appendix 1, Section 2.3); (b) filtering out data collected pre-2008 as not all questionnaires were administered before this date; (c) dummy coding all categorical variables (with K-1 levels per variable) and (d) scaling numeric dependent variables with z-score standardisation. We examined the correlations between all 28 predictor variables. Pearson's correlation coefficients ranged from small (±0.21) to moderate (0.68) effect sizes according to Cohen's rule of thumb (Supplementary Appendix 1, Section 2.4). The variables that were most highly correlated were those relating to dimensions of personality and temperament, which are known to be traits that cluster. Accordingly, as these traits cannot be considered in isolation, we retained them in the model building process to preserve ecological validity.
Sociodemographic characteristics of the sample were described with mean and s.d. for continuous variables, and absolute and relative frequencies for categorical variables. We randomised the full sample into a model development (70%, n = 717 of total sample) and a held-out validation set (30% of sample, n = 305). This 70:30 split allowed us to have a sufficiently large training set for the purposes of model development, while maintaining an adequately large sample size for out-of-sample model evaluation.
Model building
Model development and evaluation followed the recommendations from the transparent reporting of a multivariable prediction model for individual prognosis or diagnosis (TRIPOD) statement.Reference Collins, Reitsma, Altman and Kgm46 Model development was performed with a supervised machine-learning method, the least absolute shrinkage and selection operator (LASSO). With many predictors (n = 28), this approach is computationally more efficient than more ‘classical’ model selection methods such as subset selection, which use least squares to fit a linear model that contains a subset of the predictors.Reference James, Witten, Hastie and Tibshirani47 In contrast, LASSO is a penalised regression analysis method that can fit a model containing all predictors, and then perform regularisation and variable selection. Regularisation involves shrinking the sum of the absolute values of the regression coefficients; thus, LASSO (unlike other shrinkage methods such as ridge regression) can effectively exclude predictors from the final model by shrinking their coefficients to zero, i.e. performs variable selection.Reference Ambler, Seaman and Omar48 This regularisation approach helps mitigate overfitting and allows for a more parsimonious, interpretable and replicable model.Reference Tibshirani49
Internal model validation
LASSO methods require the shrinkage hyper-parameter (λ) to be optimised for the data and model. In contrast to model parameter estimation methods in classical regression, LASSO algorithms do not yield standard errors and uncertainty intervals for estimated model parameters. For this reason, we apply the following procedure:
(a) Step 1, resample (with replacement) the model development data-set (N = 717) to generate a sample, S.
(b) Step 2, execute the LASSO procedure with ten-fold cross-validation on S to locate the optimal λ parameter that yields the minimum mean-squared error between predicted and actual AAO outcomes.
(c) Step 3, extract the model parameters given the optimal λ parameter.
(d) Step 4, repeat from step 1 1000 times.
We used the ‘cv.glmnet’ function from the R package ‘glmnet’ version 4.1-1Reference Friedman, Hastie and Tibshirani42 for steps 2 and 3. After 1000 resample-fitting procedures, we collated all parameter estimates (coefficients) to examine which predictor variables were consistently retained, and estimated the variability in these coefficients (Supplementary Appendix 1, Section 3.2). We report these non-exponentiated coefficients as histograms, showing their distributions over 1000 resamples of the training set (Supplementary Appendix 1, Section 3.1).
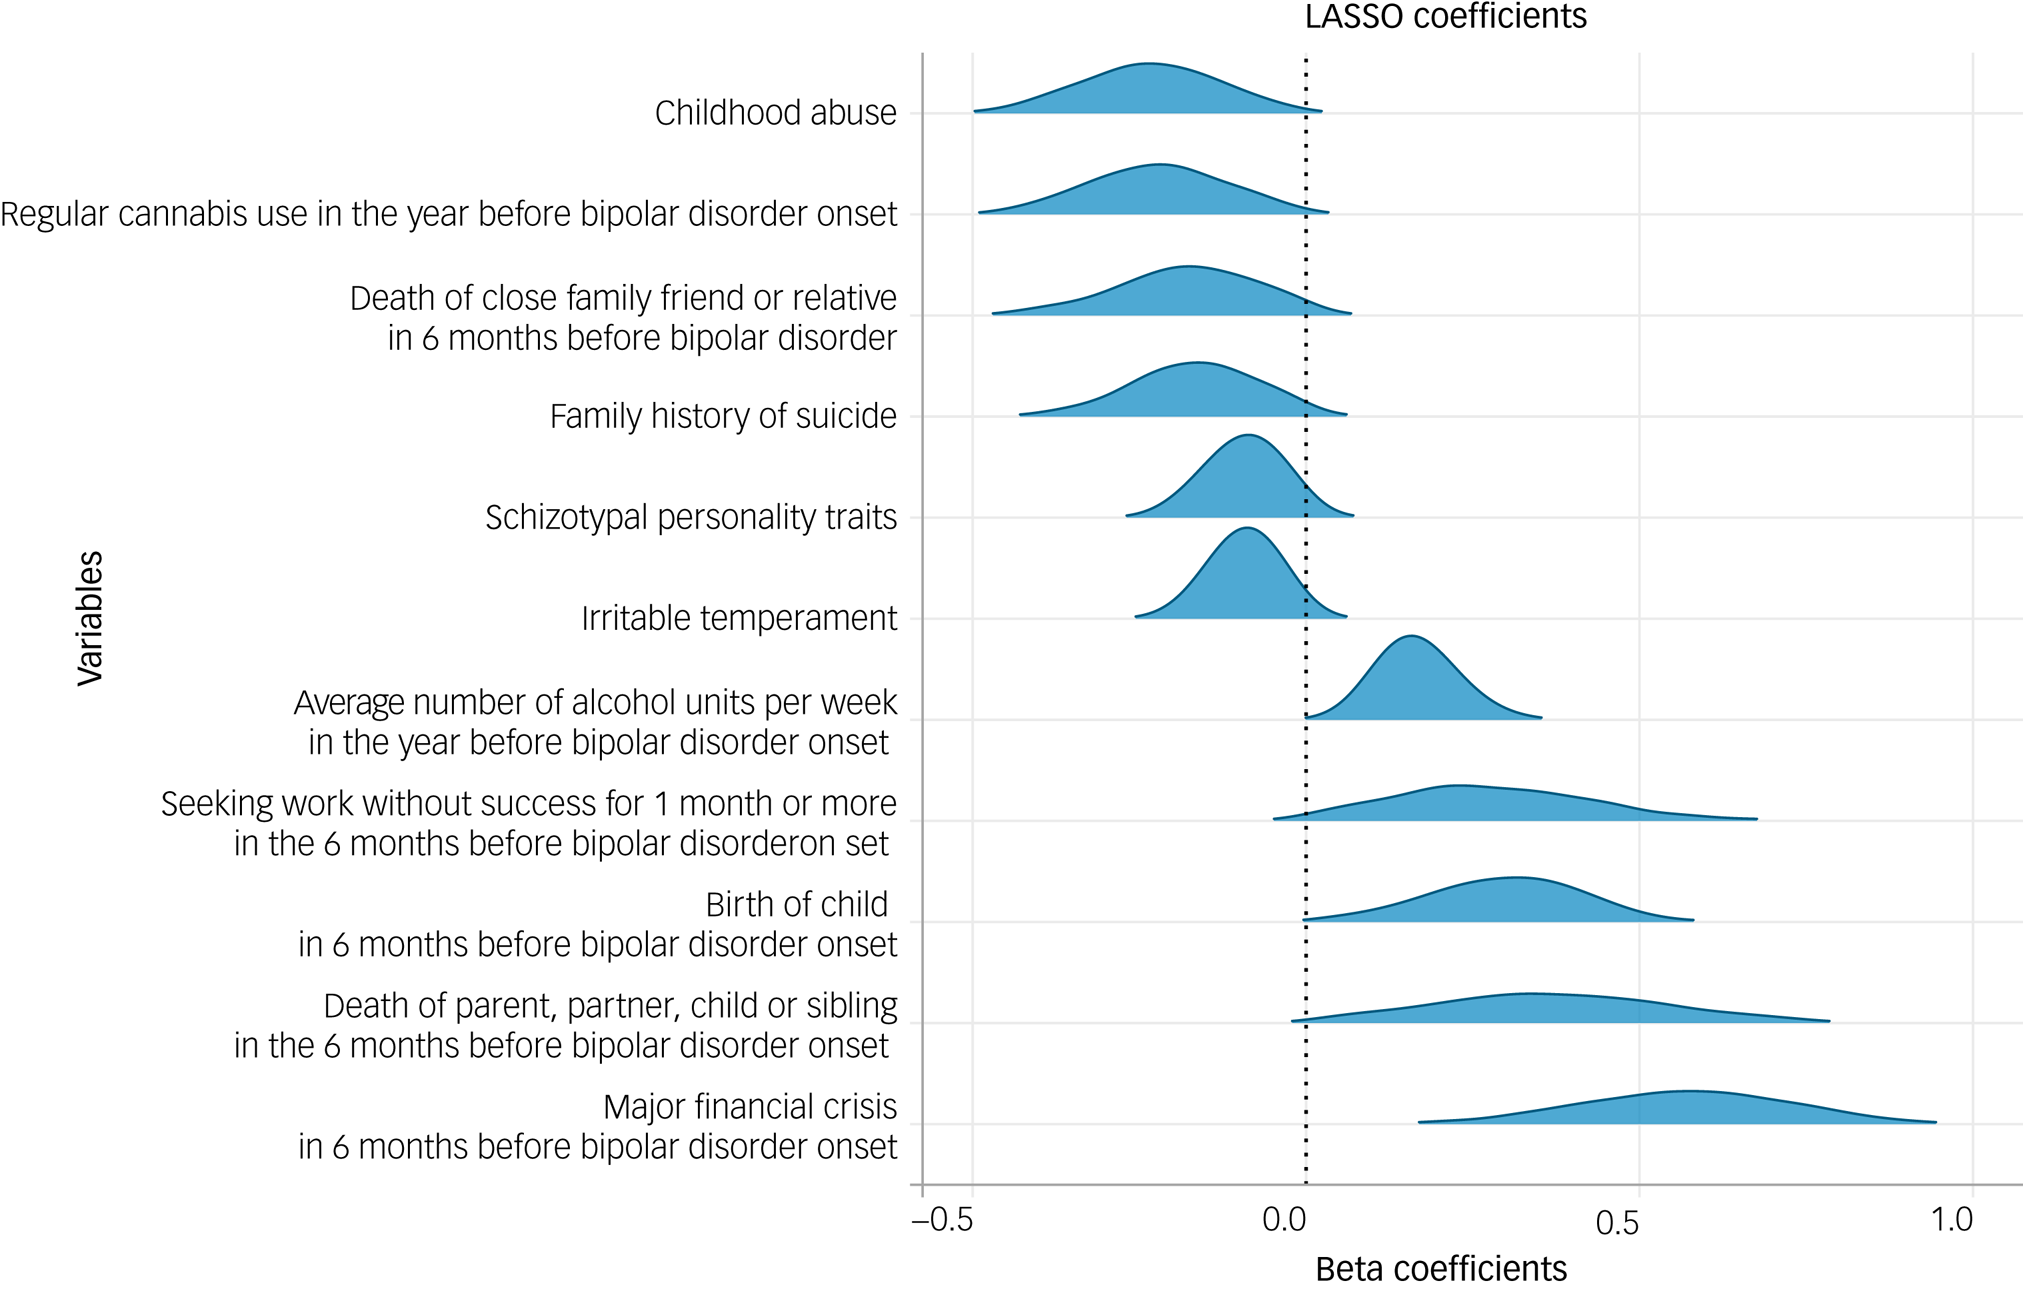
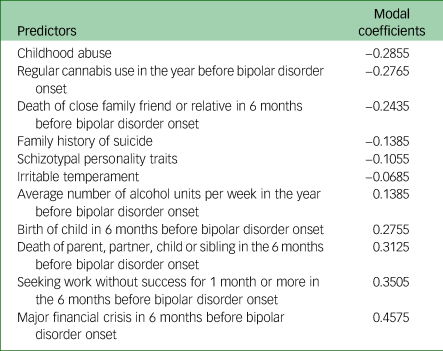
For inferential analysis, we ranked the number of times a predictor was included on each of the 1000 resampling runs/model fits. We then selected the predictors that were included on >90% of these runs. A 90% cut-off point was chosen pre-analysis as a limit that was sufficiently high enough to ensure predictors were reliably present in each model refit. Once we arrived at a selected set of predictors, to display effect sizes, we derived density plots for each predictor from the coefficients generated across the 1000 resamples (Fig. 1). We also report the most common (modal) coefficient value for each of the predictors present on >90% of reruns (Table 1).
Density plots for the 11 predictors selected by cross-validated LASSO regression model on >90% of the 1000 resampling runs. Negative beta coefficients indicate an association with an earlier AAO, whereas positive coefficients represent an association with a later AAO. AAO, age at onset; LASSO, least absolute shrinkage and selection operator.
Non-exponentiated modal coefficients for each of the 11 predictors selected by the least absolute shrinkage and selection operator regression model on >90% of resampling runs
Model evaluation
In an exploratory internal validation, we applied the selected model to the held-out validation set (n = 305). The model generated predictions for bipolar disorder AAO for each case in the validation set. Model predictive performance was assessed with a calibration curve. Calibration refers to the agreement between observed AAO values in the validation set and predictions from the model, and can be represented graphically with predictions on the x-axis, observed outcome on the y-axis and a 45° line representing perfect calibration.Reference Steyerberg, Vickers, Cook, Gerds, Gonen and Obuchowski50 We used a non-parametric locally weighted scatterplot smoothing algorithm (LOESS) to produce our calibration plot. LOESS is a form of regression that uses a weighted, sliding window (passing along the x-axis) average to calculate a line of best fit. The span parameter, which is the size of the sliding window, determines the amount of smoothing and was set to 0.3.Reference Austin and Steyerberg51 Plotting the smoothed regression line allows us to examine calibration across the full range of predicted values.
Results
Sociodemographic and clinical characteristics of the sample
There were a total of 1022 participants. The sample is described with mean, s.d. and range for continuous variables (Table 2), and absolute and relative frequencies for categorical variables (Table 3).
Means, s.d. and ranges for continuous measures in the total sample (n = 1022)

Absolute (n) and relative (%) frequencies for categorical variables in the total sample (n = 1022)

Predictors of bipolar disorder AAO
Model development
For >90% of the resampling runs, the cross-validated LASSO regression analysis (mean λ = 0.0182, s.d. = 0.00727) consistently selected 11 variables as predictors of AAO (Fig. 1). Of these 11 variables, the following six were associated with an earlier AAO: childhood abuse, regular cannabis use in the year before onset, death of a close family friend or relative in the 6 months before onset, family history of suicide, schizotypal personality traits and irritable temperament. Five variables were associated with a later AAO: the average number of alcohol units consumed per week in the year before onset; birth of a child in the 6 months before onset; death of parent, partner, child or sibling in the 6 months before onset; seeking work without success for 1 month or more in the 6 months before onset and a major financial crisis in the 6 months before onset. Of these 11 variables, some had partial correlation with one another as well as with non-chosen predictor variables, with effect sizes ranging small (±0.21) to moderate (0.68) (see Figs 2.2 and 2.3 in Supplementary Appendix 1, Section 2.4). The non-exponentiated modal coefficients for these 11 predictors are shown in Table 1. The full model with all predictors’ coefficients (not just those selected on >90% of resampling runs) can be found in Supplementary Appendix 1, Section 3.3.
Model internal validation on held-out samples
The model showed reasonable calibration when validated on the held-out test set with R2 = 0.237 and exponentiated mean absolute error (MAE) of 2.004. We chose exponentiated MAE as our metric for model accuracy as it is on the same scale as our outcome measure, AAO. Thus, the average absolute difference between the observed AAO and the predicted AAO values was approximately 2 years. This reasonable calibration can also be judged visually: as shown in Fig. 2, the predicted and observed AAO are similar, with approximately 90% of the model's confidence interval lying close to the 45° line.
Calibration curve showing the agreement between observed outcomes and predictions, using the test set data. The dotted line represents ‘perfect model calibration’; the blue line is the calibration curve generated by our model with a locally weighted scatterplot smoother and 95% confidence intervals (grey); the blue scatter points are the observed data. Observed and predicted age at onset is shown on a natural logarithm scale. MAE, mean absolute error.

Post hoc analysis
Post hoc, to ensure our model was reliable, we re-ran the full model building procedure by using elastic net penalised regression, which employs L1 and L2 regularisation, rather than LASSO, which uses L1 regularisation. The elastic net model selected the same 11 predictors as the LASSO regression, indicating that these features were stable across models, and showed comparable prediction accuracy (Supplementary Appendix 1, Section 3.4).
Discussion
This is the first known study to comprehensively investigate a range of psychosocial predictors for bipolar disorder AAO. We found 11 variables that were reliably associated with bipolar disorder AAO. Six predicted an earlier AAO: childhood abuse, regular cannabis use in the year before onset, death of a close family friend or relative in the 6 months before onset, family history of suicide, schizotypal personality traits and irritable temperament. Five variables were associated with a later AAO: the average number of alcohol units consumed per week in the year before onset; birth of a child in the 6 months before onset; death of parent, partner, child or sibling in the 6 months before onset; seeking work without success for 1 month or more in the 6 months before onset and a major financial crisis in the 6 months before onset. We discuss these findings in the context of previous research, along with their implications for diagnosis, treatment and early intervention.
Childhood abuse and individual-level characteristics
The variable that was associated with the earliest AAO was childhood abuse. This aligns with a large body of evidence indicating that maltreatment in childhood is associated with an earlier AAO,Reference Agnew-Blais and Danese8 and is more common in individuals with bipolar disorder compared with healthy controls.Reference Daruy-Filho, Brietzke, Lafer and Grassi-Oliveira27 As suggested by prior research, the trauma of childhood abuse may expedite the AAO of bipolar disorder.Reference Daruy-Filho, Brietzke, Lafer and Grassi-Oliveira27,Reference Geoffroy, Etain, Scott, Henry, Jamain and Leboyer52 For instance, recent research (which has partial sample overlap with the current study) found that the path between childhood abuse and an earlier AAO was selectively explained by individuals’ mood instability.Reference Marwaha, Briley, Perry, Rankin, Diflorio and Craddock53 The authors suggest that mood instability – defined as rapid and intense fluctuations in affect – may bring forward illness onset in children who are vulnerable because of abuse, with increased mood instability developing into episodes of mania or depression.Reference Broome, Saunders, Harrison and Marwaha54,Reference Berk, Post, Ratheesh, Gliddon, Singh and Vieta55 However, the causal nature of this relationship is yet unclear. It may be that behavioural difficulties and emotional dysfunction resulting from an early bipolar disorder AAO confer greater social and emotional vulnerability, which, in turn, has been identified as a major risk factor for childhood abuse.Reference Fleming, Mullen and Bammer56,Reference Sheikh57 Thus, there may be a bi-directional relationship between mood instability and childhood abuse, with increased mood lability reducing an individual's resilience to childhood abuse, and/or vice versa, with childhood abuse increasing the likelihood for mood instability. Prospective longitudinal studies are needed to elucidate the precise nature of the relationship between mood instability, childhood abuse and how it relates to early-onset bipolar disorder.
The mediating effect of mood instability on the relationship between trauma and early-onset bipolar disorder parallels our finding that irritable temperament was associated with an earlier AAO. Irritable temperament has been positively associated with mood instability, borderline symptoms, impulsivity and grandiosity,Reference Walsh, Royal, Barrantes-Vidal and Kwapil58 as well as predicting manic symptoms.Reference Iasevoli, Valchera, di Giovambattista, Marconi, Rapagnani and de Berardis59 It has been suggested that irritable temperament forms part of a broader bipolar disorder spectrum and represents a prodromal phase of the disorder,Reference Duffy, Jones, Goodday and Bentall60 and, as with mood instability, may accelerate the onset of manic or depressive episodes meeting diagnostic criteria. Indeed, the association between high levels of trait irritability and an earlier AAO may be an artifact of the increased likelihood of these individuals manifesting behavioural problems that are brought to the attention of psychiatric services, in turn making it more likely to receive an early (or timely) diagnosis. Indeed, the diagnosis of pre-pubertal bipolar disorder, which is prevalent in North America, requires irritability (not mania) as a core symptom for diagnosis.Reference Duffy61,Reference Wozniak62
Irritability is not the only trait measure that appears to be predictive of an earlier AAO. Greater endorsement of schizotypal personality traits – including magical thinking, paranoid ideation, ideas of reference and social isolation or anxiety – was also associated with an earlier AAO in our model. As with irritability, it is thought that schizotypy represents a dimensional trait that indexes the genetic liability to bipolar disorder and forms part of the bipolar disorder spectrum.Reference Mahon, Perez-Rodriguez, Gunawardane and Burdick63 Although this is the first known study to specifically investigate schizotypal personality traits in relation to bipolar disorder AAO, previous research indicates that schizotypal traits are elevated in those with bipolar disorder and predict future hypomanic episodes.Reference Joyce, Luty, McKenzie, Mulder, McIntosh and Carter64,Reference Schürhoff, Laguerre, Szöke, Méary and Leboyer65 There is a growing body of evidence demonstrating that genes (e.g. variants of the catechol-o-methyltransferase gene) may interact with environmental factors, such as childhood abuse, to contribute to elevated levels of schizotypal traits in bipolar disorder.Reference Savitz, der van Merwe, Newman, Stein and Ramesar66 Additionally, greater genetic liability for schizophrenia in individuals with bipolar disorder has been associated with increased schizotypy scores.Reference Hori, Matsuo, Teraishi, Sasayama, Kawamoto and Kinoshita67 As our findings show a link between increased schizotypal traits and early AAO, this lends support to the idea that earlier- versus later-onset bipolar disorder may differ in genetic aetiology, and highlights the importance of recognising the role of genetic interactions with the psychosocial predictors in our model. Of note, however, schizotypal traits and irritable temperament were partially correlated with other personality traits not included in our final model (e.g. trait neuroticism, cyclothymic temperament, depressive temperament). These correlated, but not included, temperament traits may also be of predictive relevance. As dimensions of personality are known to be traits that cluster, this should be considered when interpreting the impact of personality traits on AAO.Reference Iasevoli, Valchera, di Giovambattista, Marconi, Rapagnani and de Berardis59
Life experiences and familial risk
Pertinent to the discussion of gene-environment interactions, we found that ‘family history of suicide’ was predictive of an earlier AAO, which is in line prior research.Reference Post, Altshuler, Kupka, McElroy, Frye and Rowe17,Reference Chen, Kao, Lu, Yang, Liao and Jang68 A family history of suicide confers a stronger familial/genetic loading for suicidality and corresponding psychiatric disorders, which supports the view that genetics contribute to an increased vulnerability for an earlier AAO in bipolar disorder. This is consistent with evidence suggesting that early onset may be a more heritable form of bipolar disorder than late onset, with studies demonstrating differences in transmission patterns and more pronounced familial aggregation in early- compared with late-onset bipolar disorder.Reference Etain, Mathieu, Rietschel, Maier, Albus and McKeon10,Reference Geoffroy, Etain, Scott, Henry, Jamain and Leboyer52,Reference Priebe, Degenhardt, Herms, Haenisch, Mattheisen and Nieratschker69 Beyond specific genetic influences, a family history of suicide can convey increased transgenerational risk based on intra-familial behavioural interactions and their associated stressors.Reference Post, Altshuler, Kupka, McElroy, Frye and Rowe17,Reference Serretti, Chiesa, Calati, Linotte, Sentissi and Papageorgiou70 This, in turn, influences family environment and reciprocal offspring resilience,Reference Miklowitz, Simoneau, Sachs-Ericsson, Warner, Suddath, Mundt, Goldstein, Hahlweg and Fiedler71 hinting that epigenetic mechanisms may be at play in bipolar disorder AAO.Reference Agnew-Blais and Danese8,Reference Daruy-Filho, Brietzke, Lafer and Grassi-Oliveira27,Reference Post, Altshuler, Kupka, McElroy, Frye and Rowe29
Looking beyond childhood abuse and family suicide, our model also suggests that other negative early-life experiences may catalyse disorder onset. Namely, ‘the death of a close family friend or relative in the 6 months before bipolar disorder onset’ correlated with an earlier AAO. Within the psychological framework of the diathesis stress model, it is thought that early negative life events interact with predisposed vulnerability to precipitate disorder onset.Reference Brietzke, Mansur, Soczynska, Powell and McIntyre72,Reference Horesh, Apter and Zalsman73 Accordingly, evidence suggests a dose effect of exposure to stressful life events on the AAO of bipolar disorder, with a greater number of early stressors being significantly associated with an earlier AAO.Reference Hosang, Korszun, Jones, Jones, McGuffin and Farmer31,Reference Post, Altshuler, Leverich, Nolen, Kupka and Grunze32 In contrast to this, however, we found that that the following life events were associated with a later AAO: birth of a child, major financial crisis and/or death of parent, partner, child or sibling in the 6 months before bipolar disorder onset; as well as seeking work without success for 1 month pre-onset. Yet, the direction of these relationships is unclear. For instance, these are all life events that become more common with increasing age, which therefore confounds the direction of these associations with a later AAO. In support of this, we can see from Fig. 1 that the coefficient variability of these four variables is greater than the others (i.e. ‘flatter’ density plots), which suggests that the relationship between these life events and AAO may be less reliable than the other predictors in our model, and is likely weakened by age being a possible confound. Equally, there were small numbers of participants reporting these negative life events, which could have weakened the strength of their relationship to AAO. This slightly less robust association may also be partially attributed to the finding that the effect of life events on the emergence of bipolar disorder diminishes with age,Reference Hillegers, Burger, Wals, Reichart, Verhulst and Nolen74 perhaps because of the development of appropriate coping strategies or the presence of other neutralising life events.
Substance use
The presence of stressful life events has also been associated with alcohol use,Reference Paulino, Pombo, Ismail, Figueira and Lesch75 which was identified as a significant predictor in our model. Our model suggests that alcohol use correlates with a slightly later AAO. Previous research has found mixed results, with some studies demonstrating that premorbid alcohol use is significantly associated with an earlier AAO,Reference Holtzman, Miller, Hooshmand, Wang, Chang and Hill18,Reference Lin, McInnis, Potash, Willour, MacKinnon and DePaulo21,Reference Azorin, Bellivier, Kaladjian, Adida, Belzeaux and Fakra76 whereas others have found an association with a later AAO.Reference Lagerberg, Sundet, Aminoff, Berg, Ringen and Andreassen20,Reference Strakowski, DelBello, Fleck, Adler, Anthenelli and Keck77 Similar to the age-dependent life events we discuss above, the relationship between alcohol use and an early bipolar disorder onset may be confounded by age restrictions on purchasing and accessing alcohol. Equally, however, it may be that increases in alcohol use masks the true AAO of bipolar disorder, with it being unclear if mood and behavioural disturbances are a consequence of incipient bipolar disorder or directly related to heavy alcohol use.Reference Berk, Post, Ratheesh, Gliddon, Singh and Vieta55 Thus, individuals may not recognise their first incidence of impairment as specifically related to bipolar disorder, artificially inflating their reported AAO. Early prodromal symptoms, such as sleep disturbances and anxiety symptoms may be attributed to alcohol use rather than recognised as part of the clinical trajectory of early-stage bipolar disorder.Reference Stein and Friedmann78 Indeed, anxiety symptoms have been found to be both a cause and a consequence of heavy alcohol use, as well as a clinical precursor in bipolar disorder.Reference Duffy79–Reference Kushner, Abrams and Borchardt81 This highlights that the relationship between alcohol consumption and bipolar disorder AAO is likely non-linear, and so our findings must be interpreted with caution.
Despite previously mixed findings regarding the relationship between AAO and alcohol use, our finding that alcohol use was associated with a later AAO and cannabis use was associated with an earlier AAO, directly corroborates previous research that controlled for age as a potential confound.Reference Lagerberg, Sundet, Aminoff, Berg, Ringen and Andreassen20 Furthermore, evidence from systematic reviews and meta-analyses points toward a significant association between cannabis use and an earlier AAO in bipolar disorder,Reference Sideli, Quigley, la Cascia and Murray82–Reference Bally, Zullino and Aubry84 with results suggesting that cannabis use may trigger the onset of mania.Reference Bally, Zullino and Aubry84–Reference Aas, Etain, Bellivier, Henry, Lagerberg and Ringen86 The mechanism behind this effect is unclear, but it has been hypothesised that the principal ingredients in cannabis (tetrahydrocannabinol and cannabidiol) affect mood via their interaction with the endocannabinoid, dopamine and serotonin neurotransmitter systems.Reference Gibbs, Winsper, Marwaha, Gilbert, Broome and Singh87,Reference Chadwick, Miller and Hurd88 In contrast, alcohol use is thought to increase the risk for depressive rather than manic symptoms.Reference Sideli, Quigley, la Cascia and Murray82,Reference Baethge, Hennen, Khalsa, Salvatore, Tohen and Baldessarini89 This may help explain why increased alcohol use was not associated with an earlier AAO, as the presence of a manic episode is needed before a clinical diagnosis of bipolar disorder can be made.
Strengths and limitations
This is the only known study that models a wide range of psychosocial markers of AAO in a large, well-characterised sample of participants with bipolar disorder. We use a novel machine-learning approach not previously employed when investigating bipolar disorder AAO, employing bootstrapping, k-fold cross-validation and a held-out validation set to ensure model robustness and reduce overfitting. Our model showed good calibration, indicating that we can be confident in its predictive validity.
There are, however, several methodological limitations that must be considered. Relating to model validation, we did not have an independent sample for external validation. Although we used a held-out test set, this was a subsample of our original data-set and therefore subject to the same limitations as the data used for model building. The most notable of these limitations is the cross-sectional retrospective nature of the study, and the cohort's limited generalisability. As the analyses are not based on prospective data, we cannot be sure of the direction of causality in our model, and it is unclear whether our predictors should be conceptualised as causal risks factors or as risk markers, i.e. a factor that is associated with an outcome but is not necessarily its cause.Reference Feinleib90 Although, as with many psychiatric illnesses, it is likely that the relationships are bidirectional and symbiotic. Retrospective studies are also subject to recall bias, which undermines the reliability of self-reported AAO. This was mitigated by referring to medical case notes rather than relying solely on self-report. Yet, it has been suggested that people with bipolar disorder may be more likely to recall depressive compared with manic episodes, or even fail to recognise hypomanic episodes pre-diagnosis as pathological.Reference da Silva R, Mograbi, Silveira, Nunes, Novis and Landeira-Fernandez91,Reference Gazalle, Frey, Hallal, Andreazza, Cunha and Santin92 This introduces biases into individuals’ recall of their bipolar AAO. Additionally, as the sample was skewed toward a younger age at study entry (average age of 46 years), late-onset bipolar disorder may have been underreported, thus weakening the reliability of our model. Moreover, a bipolar disorder diagnosis in older age may be masked or missed in favour of more prevalent later-life disorders with psychiatric symptoms (e.g. frontotemporal dementia), further obscuring the true rate of late-onset bipolar disorder. Therefore, as a gold standard, future research investigating bipolar disorder AAO should aim to employ prospective longitudinal methodologies.
Furthermore, the included personality trait predictors had partial correlation with other personality variables not chosen in our final model. Thus, schizotypal personality traits and irritable temperament may not be the most valuable personality predictors per se, but rather represent the predictive importance of a clustering of other personality variables, such as high trait neuroticism and cyclothymic, depressive and anxious temperaments. Additionally, there are other theoretically driven potential psychosocial predictors that would have been interesting to include in our modelling. This includes information on pre-onset smoking and suicide attempts, as well as sleep and circadian rhythms, mood lability and premorbid anxiety, which are known to be important in the manifestation and prodromal stages of bipolar disorder.Reference Duffy93,Reference Ritter, Höfler, Wittchen, Lieb, Bauer and Pfennig94 Additionally, given the likely role of gene×environment interactions, including genetic data in future analyses would help to elucidate aetiological mechanisms.
In conclusion, our study sheds light on the importance of several psychosocial markers for bipolar disorder AAO. Identifying these predictors provides is a further step toward understanding key processes in the aetiology of this heterogeneous psychiatric disorder. Our findings suggest that bipolar disorder AAO is likely catalysed via an interplay of genetic susceptibility, individual-level personality traits and exposure to negative life events and trauma in childhood. The identified predictor variables can be used to stratify individuals already at high-risk for bipolar disorder (e.g. offspring of parents with bipolar disorder) into likely AAO groups. Defining these AAO subgroups can help guide treatment provision and streamline approaches to early intervention. Future research should aim to externally validate our model in prospective, phenotypically detailed cohorts.
Supplementary material
Supplementary material is available online at https://doi.org/10.1192/bjo.2022.536
Data availability
The R code used for data pre-processing and analysis is openly available via the Open Science Framework. The data used in this study is not openly available as participants did not agree for their data to be shared publicly. For appropriately qualified researchers, however, data access may be granted upon reasonable request, and those interested should contact the BDRN.
Acknowledgements
We would like to thank all BDRN members and participants for their ongoing support.
Author contributions
S.B. had full access to all the data in the study and takes responsibility for the integrity of the data and the accuracy of the data analysis. All authors were responsible for study concept and design, and data acquisition, analysis or interpretation. S.B. drafted the manuscript. All authors provided critical revision of the manuscript for important intellectual content. S.B. and D.W.J. conducted statistical analysis.
Funding
This work was supported by the Medical Research Council (grant number MR/N013468/1 to S.B.), the National Institute for Health Research Oxford Health Biomedical Research Centre, the Wellcome Trust and the Stanley Medical Research Institute.
Declaration of interest
None.


 Open access


eLetters
No eLetters have been published for this article.