


The definition of food security, accepted and used for two decades in developed countries, is that ‘food security is assured access to nutritionally adequate and safe foods’. Conversely, food insecurity exists when the availability of nutritionally adequate and safe foods, or the ability to acquire such foods in socially acceptable ways, is limited or uncertain( 1 , Reference Holben 2 ). A contemporary definition( 3 ) augments the reference to ‘nutritionally adequate and safe foods’ by referring to ‘food and nutrition security’ and adding the need for the support of ‘an environment of adequate sanitation, health services and care’. Failure to achieve food security is undoubtedly more frequent in less developed countries where there is a greater likelihood of a food supply being interrupted by a protracted crisis( 4 ). The question ‘Why food insecurity should be an issue in countries where the food supply appears to be both plentiful and consistent?’ presents an ongoing challenge.
Commencing in 1984, the USA addressed the issue of developing a tool to assess food security at the household level. The resulting Food Security Core Survey Module has been successfully used in North American studies (1) to routinely determine the prevalence of food insecurity in the population( Reference Coleman-Jensen, Nord and Singh 5 ), (2) to assess its severity and (3) to explore the associated and negative consequences of experiencing food insecurity( Reference Kirkpatrick 6 ). The view adopted in the USA has been that the experience of food insecurity is ‘a sequence of stages reflecting increasingly severe deprivation of basic food needs and characterised by a managed process of decision making and behaviour in response to increasingly constrained household resources’( Reference Carlson, Andrews and Bickel 7 ). The module comprises eighteen questions, eight of which pertain only to households including children. A short form (six questions) of the full module( Reference Blumberg, Bialostosky and Hamilton 8 ) has been considered to be appropriate in some circumstances, particularly when respondent burden is of paramount importance. The US Core Food Security Measure has been demonstrated to be valid and reliable for use in the North American context( Reference Frongillo 9 ). Many studies have used the categories of food security from the Food Security Core Survey Measure to assess the population prevalence of food (in)security or to ascertain the adverse nutrition and health outcomes of food insecurity among adults( Reference Cristofar and Basiostis 10 – Reference Che and Chen 12 ) and children( Reference Alaimo, Olson and Frongillo 13 , Reference Cook and Frank 14 ). However, when the module is used outside of the North American cultural context, it has not always proved to be robust, as, for example, among Samoans living in Hawaii( Reference Derrickson, Fisher and Anderson 15 , Reference Frongillo, Chowdhury and Ekstrom 16 ). Also, as noted by Frongillo et al. ( Reference Frongillo, Chowdhury and Ekstrom 16 ), the process adopted by the USA for developing a food security measurement tool can be used successfully in other countries because it is used to ‘construct a direct measure of food insecurity based on people's experience gained through in-depth qualitative investigation in a locality in which the measure is to be used’. In 2011, Ivers & Cullen( Reference Ivers and Cullen 17 ) noted that ‘there remains no clear cross-cultural standardised tool for the measurement of food insecurity’, and this is important to note in terms of furthering research in the area.
In New Zealand (NZ), the emerging issue of the influence of poverty on nutritional status was demonstrated in several studies during the 1990s( Reference Parnell, Kohler, Feichtinger, Barlosius and Dowler 18 ). From these reports, it was deemed important to examine food insecurity in the population using an instrument appropriate to the unique social and cultural context. NZ has a universal social security system (including government benefits for the unemployed, for those unable to work due to disability or sickness, and for sole parents of young children); however, it does not have government-funded food-assistance programmes, which in the USA have been credited with mitigating the effects of poverty on nutrition outcomes( 19 ). In the NZ society, obtaining food from charitable food banks is not regarded as ‘socially acceptable’ and is consequently an indicator of food insecurity( Reference Reid 20 , Reference Riches 21 ).
As has been fully described previously( Reference Reid 20 , Reference Parnell, Reid and Wilson 22 ), the development of the indicators of food insecurity for use in NZ was a stepwise process, commencing with a literature search to identify key themes and followed by focus groups among low-income men and women, particularly including Māori and Pacific Island people( Reference Reid 20 ). The NZ population includes 15 % Māori (indigenous to NZ) and 7 % Pacific Island people, a group including new and first- and second-generation migrants. People in both of these ethnic groups are over-represented in the low socio-economic sector( 23 ). During this process, eight food security statements were developed, each encapsulating a different aspect of household food insecurity and demonstrating both face and content validity( Reference Parnell, Reid and Wilson 22 ). When the ‘indicators’ of food security were presented as direct questions to the pre-test sample, many respondents found the questions offensive. Therefore, the indicators were reworded and presented as statements either in writing or verbally. Subsequently, pre-test respondents were comfortable to state whether or not they experienced the aspect of food insecurity presented to them in this less direct manner( Reference Parnell, Reid and Wilson 22 ).
The present study describes the trial and further development of the eight-item food insecurity measurement tool. The major aim was first to determine whether an eight-item instrument could demonstrate construct validity for measuring food security in the NZ population through item response analysis by using a Rasch model. A further aim was to determine whether categories of food security could be devised in order to examine the relationships between household food security status and nutrition and health outcomes that were measured at the same time, thus providing an indication of the concurrent validity of the instrument.
Methods
As described by Parnell et al. ( Reference Parnell, Reid and Wilson 22 ), the eight-item measurement tool was tested in the NZ 1997 National Nutrition Survey (NNS97), a voluntary cross-sectional population survey conducted over a 12-month period in non-institutionalised NZ residents aged 15 years and older. Survey sampling and methods have been fully described previously( Reference Parnell, Wilson and Russell 24 ).
Of the 4635 participants of the NNS97, 4576 provided data on a full range of food and nutrient intakes (from a 24 h dietary recall and a FFQ) and responded to the eight food security statements (Fig. 1). The participants included those from all household types, with and without children. To determine whether each of the food security attributes was discrete and contributed meaningfully to the construct, and whether the attributes could be ranked on a unidimensional scale, Rasch model analysis was performed on all participants whose household reported experiencing at least one aspect of food insecurity. Rasch analysis had been deemed in the USA to be a suitable tool to take a set of food security attributes (indices) and produce a unidimensional continuous variable measure of the severity of food insecurity, which is both reliable and valid( Reference Carlson, Andrews and Bickel 7 , Reference Derrickson, Fisher and Anderson 15 , Reference Hamilton, Cook and Thompson 25 ).
Ranking of households and indices on a food security scale, by level of severity (# = approximately fifty households). M, mean; S, one standard deviation above/below the mean; Q, two standard deviations above/below the mean.

The analysis ranks each household by the indices to which the participating household member responded positively. The scale value achieved by a household depends both on the number of affirmative responses to the set of indices and on the severity or rank order (item calibration) of the indices to which they responded affirmatively. The analysis also maps the food security indices to the same scale as the households, assigning them a calibration score, based on the probability of the participants in the households responding positively to that indicator. The resulting item calibration score orders the indices and denotes their spacing relative to one another, on a linear scale. The more food secure a household is, the less likely there will be affirmative responses to the indices, especially those indices with a higher scale value than the household. The expectation is that less severe indices will be responded to more often than more severe indices by any given household.
Both the household response measures and the severity of the indices are calibrated on the same linear scale. The analysis assigns a measure of reliability (standard errors of the item calibrations and household food security measures) to each estimate. Furthermore, the goodness of fit (to the model) of each index is determined, by mean square residuals, which are the ratios of the observed v. the expected scores( Reference Derrickson, Fisher and Anderson 15 ). The misfit rate was calculated as the percentage of respondents who ‘misfit’ on at least one of the infits and outfits, where misfitting is defined as having the mean square value >1·2 and the absolute value of the standardised Z-score >2.
Rasch analyses on the NNS97 dataset were performed using BIGSTEPS 2.82( Reference Linacre and Wright 26 ). Polytomous rather than dichotomous Rasch models were used in all cases to utilise the full range of the possible responses (never/always, sometimes and often). The statement ‘I/we can afford to eat properly’ was anchored at 0 on the linear scale. This ‘general’ indicator of food security status assisted with comparing item difficulties for the remaining indices, particularly when making comparisons between population subgroups such as males v. females. Rasch analysis was also performed separately for households where the respondent was female and for households where the respondent was male.
To obtain useful categories of food security, scale cut-off points for three categories of household were assigned, following the ranking of the indices so that:
-
(1) The categories made sense conceptually (the cut-off points for the most food-insecure category were set so that they included the indices ‘rely on others for food and/or money for food’ and ‘use of special food grants/banks’).
-
(2) The distributions of households across the categories provided adequate cell sizes to enable statistical comparisons of outcome variables for each category.
To explore the predictive ability of food security categories on food choice and energy and nutrient intakes, the following eight variables were chosen from the Qualitative FFQ of the NNS97( Reference Russell, Parnell and Wilson 27 ):
-
(1) Fruit serves 2+/d
-
(2) Vegetable serves 3+/d
-
(3) Fruit and vegetable serves 5+/d
-
(4) Bread and cereal serves 6+/d
-
(5) Bread serves 5+/d
-
(6) Cereal serves 10+/week
-
(7) Beef/veal serves 1+/d
-
(8) Sausages/saveloys 1+/d
Variables 1–4 were taken directly from the NZ Dietary Guidelines for Adults( 28 ). Variables 5 and 6 were arbitrarily chosen in order to examine separately the possible effect of food insecurity on choice of breads and cereals. Variables 7 and 8 arose from the Dietary Guidelines that recommend 1 serve/d from the group ‘meats and alternates’ and further that the meat choice be lean. Few New Zealanders avoid red meat( Reference Russell, Parnell and Wilson 27 ), and lean meats tend to be more expensive, so one relatively lean but expensive meat group (beef/veal) and one relatively fatty but cheap meat group (sausages/saveloys) were selected.
Daily intake of energy and nutrients was calculated from the primary 24 h dietary recall of each participant( Reference Parnell, Wilson and Russell 24 , Reference Russell, Parnell and Wilson 27 ). Associations between the three categories of food security and food choice, mean daily energy intake and intake of selected nutrients were investigated by general linear models controlling for the following factors: sex; ethnicity (NZ European and others, NZ Māori, Pacific with the order or priority being NZ Māori over Pacific over NZ European and others); NZ 1996 Index of Deprivation (NZDep96 quartile); place of residence (urban or rural); level of education (no qualification, school only, post-school only, school or post-school); annual household income (in NZ dollars: ≤ $20 000, >$20 000–$30 000, >$30 000–$50 000 or >$50 000); household size (1–4 persons, 5–6 persons or 7+ persons). Nutrient intakes had been shown to vary by these covariates in unadjusted analyses. Standard regression diagnostics were performed with log transformations of the dependent variable used, which improved model residuals in terms of normality and/or homoscedasticity. The statistical packages SAS (version 8.02; SAS Institute, Inc.) and Stata 13.1 (Stata Corporation) were used for these analyses, with two-sided P< 0·05 considered statistically significant in all cases.
Results
Food security indices: ranking and categorisation
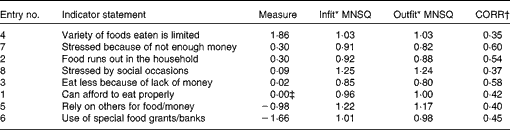
Rasch analysis was performed on participants of 1868 households reporting some food insecurity, i.e. responding affirmatively to one or more statements. (One extreme household responded positively to the full extent to all indices, so that it could not be assigned a food security score and was removed from the analysis.) Table 1 summarises the eight indices of food security to which the participants responded.
Indices of food security presented in measure order, i.e. from least to most severe food insecurity
MNSQ, mean square; CORR, correlation.
* Values between 0·8 and 1·25 were generally considered acceptable.
† CORR between item responses and scores without item.
‡ Item chosen as the anchor.
Table 1 shows that item measures ranged from − 1·66 (‘use of special food grants/banks’, this was the index least reported and at the same time most severe) to 1·86 (‘variety of foods eaten limited’, this was the index most often reported to be experienced and at the same time the least severe index of food insecurity). For the household responses to the eight indices, the mean measure (or score) achieved was 2·19 (minimum observed food security − 2·92; maximum observed food security 3·84). Fig. 1 visually demonstrates that the indices successfully separate out and ‘scale’ the household's experiences of food security.
Subject (household) reliability (the proportion of variance in respondent scores that is not due to measurement error), a measure of whether households respond to the indices in a similar order, lies between 0·60 and 0·66. This is close to a level conventionally regarded as acceptable: >0·7( Reference Linacre and Wright 26 ). The infits and outfits were shown to lie between 0·80 and 1·25, which is an acceptable range( Reference Wright and Linacre 29 ).
Item (index) separation is in the range of 17·20–17·77, indicating that each index is capturing a distinct aspect of food insecurity.
Fig. 1 maps on the left-hand side the household ‘measure’/score of food insecurity around the anchor-point (arbitrarily assigned 0) indicator on the right-hand side ‘can afford to eat properly’. It also maps on the right-hand side the eight indices of food insecurity in measure (score) order as described above.
Categories of food security
The following three categories across the range of severity of food insecurity were assigned:
-
(1) Fully secure/almost food secure: scale reading over 2·00. These households either provided no affirmative response to any of the eight indices of food insecurity (n 2720) or responded affirmatively to only one of the indices (n 557).
-
(2) Moderate food security: scale reading 0·00–2·00 (n 1097).
-
(3) Low food security: scale reading < 0·00 (n 196).
As demonstrated in Fig. 1, the moderately food-secure group have a higher probability than the fully secure/almost food-secure group of experiencing ‘limited variety of foods eaten’, ‘running out of food’, ‘stress because of not enough food’, ‘stress because of not enough food for social occasions’, or ‘eating less because of lack of money’. However, this group is unlikely to report having undertaken any resource augmentation actions (‘rely on others for food/money for food’ and ‘use of special food grants/banks’).
The low food-secure group has the highest probability of respondents reporting that they have also experienced resource augmentation actions in addition to having experienced other aspects of food insecurity.
When the Rasch analysis was repeated for each sex separately, the model for females demonstrated superior subject reliability (0·64–0·69) compared with males (0·50–0·59).
Predictive ability of food security on food choice
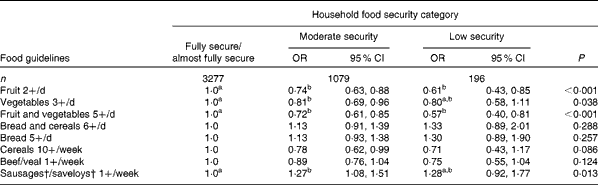
Compared with the fully secure/almost fully secure households, those who were moderately secure were less likely to consume the recommended daily servings of fruit and vegetables (separately and combined), and more likely to consume fatty meats such as sausages and saveloys. The moderately secure group consumed more daily serves of bread (and breads and cereals combined) and fewer serves of leaner meats such as beef and veal than those in fully secure/almost secure households in unadjusted models (results not shown); however, these differences were no longer statistically significant following adjustment. For most outcomes, there was a trend across those three categories of food security, but small numbers in the low food security category often resulted in wide CI, indicating the uncertainty of the odds in this group (Table 2).
Adjusted OR for meeting food guidelines by category of food security status, for the household* (Odds ratios and 95 % confidence intervals)
a,bValues within a row with unlike superscript letters were significantly different (P< 0·05).
* Logistic regression model adjusted for sex, ethnicity, NZDep96 quartile, urban/rural status, income, age and household size, place of residence, level of education and annual household income.
† Fatty processed meat product.
Predictive ability of food security on nutrient intake
Category of household food security was associated with the level of intake of total fat, saturated, monounsaturated and polyunsaturated fat, cholesterol, lactose and vitamin B12 increasing with lower levels of food security. Intakes of glucose, fructose and vitamin C were highest in the fully secure/almost fully secure category. Vitamin B6 showed a U-shaped association with the lowest levels in the moderate food security category (Table 3). Other nutrient intakes, including total energy, did not display an association with the categories of food security.
Energy and nutrient* intakes of adults by category of household food security

CHO, carbohydrates; RE, retinol equivalents.
a,bMean values within a row with unlike superscript letters were significantly different (P< 0·05).
* Mean values adjusted for sex, ethnicity, NZDep96 quartile, urban/rural status, level of education, income, age and household size.
Discussion
Among developed countries, only the USA has developed a tool for assessing household food insecurity in the population, namely the US Core Food Security Measure. While this tool has been adapted for use in other countries, including ensuring that the adapted version is valid( Reference Perez-Escamilla, Segall-Correa and Kurdian Maranha 30 ), few other developed countries have given priority to the development of a specific rigorous and objective measure of household food security. Australian researchers have chosen to use the US Core Food Security Module to assess food insecurity among adults in disadvantaged urban areas( Reference Ramsay, Gaskes and Turrell 31 ), children( Reference Ramsay, Giskes and Turrell 32 ) and tertiary students( Reference Gallegos, Ramsay and Ong 33 ). In these disadvantaged populations, the researchers assessed the internal consistency of the US tool, and found that it was acceptable. The evidence presented in these reports demonstrates that food security as assessed using the US instrument was associated with diet quality that was mixed. Nevertheless, food security is widely recognised as a phenomenon of importance; its possible causes are commented on and a multitude of solutions are proposed to mitigate its effects( Reference Rychetnick, Webb and Story 34 ).
In this NZ model, the indices differ from those included in the US Core Food Security Measure. First, they were presented to the participants as statements (to which they could respond as follows: never/always, sometimes or often), and not as questions. Second, they were fewer in number (eight compared with eighteen for US families with children), which minimised respondent burden, and were suitable for all participants of the NNS97, regardless of income level (data were obtained on a full national sample with no prior income-level screening). Third, they included resource augmentation actions, e.g. obtaining food from friends, relatives or charitable sources. These intermittent actions in the NZ context were considered to have only a temporary effect on food security status, and to be socially unacceptable in all circumstances( Reference Reid 20 , Reference Riches 21 ).
The Rasch analyses of the NZ indices, described in the present paper, have provided evidence that a relatively small number of multidimensional food security indices (eight) can be translated to a unidimensional scale. Furthermore, the categories developed from this scale have the ability to predict aspects of nutritional status, namely food and nutrient intakes, independently of other potential socio-economic indicators such as level of education and annual household income.
The NZ model has marginal ‘household’ reliability (0·60–0·66), as it is considered that reliability is satisfactory at >0·7 (analogous to Cronbach's α)( Reference Derrickson, Fisher and Anderson 15 ). When data for household food security have been provided by women, reliability lies between 0·64 and 0·69, demonstrating that better or more reliable data are provided by women compared with men( Reference Parnell 35 ). This is likely to be because women more often than men would be expected to be the major food provisioner for a household and thus have a greater awareness and experience of food security issues. While household reliability could be improved by adding items to the instrument, this would reduce the benefit of a short instrument in relation to respondent burden.
Item separation for the eight indices lay between 17·20 and 17·77, above the item separation levels reported by Derrickson for the US Core Food Security Measure( Reference Derrickson, Fisher and Anderson 15 ) of 9·29. Such a high item separation index is an indication that the indices chosen for this model are adequate to define a line of increasing intensity.
The infit and outfit values for the indices range from 0·8 to 1·25 (within the range 0·5–1·5 considered acceptable( Reference Wright and Linacre 29 )). These statistics from the Rasch model compare the observed proportions of positive responses to each index, with the proportions expected by the model assumptions( Reference Connell, Nord and Lofton 36 ). Values exceeding 1 show that a disproportionate number of responses have not followed the expected order, which is that respondents would give positive responses to less severe indices before a positive response to the index in question. Values less than 1 indicate that an item is not contributing useful information to the overall measure of food insecurity. Thus, the item fit, which is the extent to which the chosen indices fit the Rasch model, is satisfactory. In other words, each of the eight indices selected from the original focus group analyses to represent the experience of food insecurity in the NZ population could be considered to be appropriate.
While the Rasch model assumes a basic pattern of response (to household food security indices), clearly some households would not fit the expected pattern of always responding to easier indices before more difficult ones. Derrickson quotes an acceptable misfit rate of ≤ 5 %, and in these data, the misfit rate for infits and outfits is lower at 4·1 %( Reference Derrickson, Fisher and Anderson 15 ). The reasons for misfit are not clear, but may be because some respondents did not fully comprehend the statements (indices) presented to them. In further studies using these indices, more rigorous introductory explanations of the issues at stake could be necessary.
It appears that this eight-index model (NZ Food Security Model) is sufficient to assess the phenomenon of food security in the NZ population. The indices ‘Relying on others for food/money for food’ and the ‘Use of special food grants/food banks’ have been demonstrated to fit the NZ model. Such resource augmentation questions did not do so in the USA( Reference Hamilton, Cook and Thompson 25 ). The difference is likely to be that such actions in NZ, while they are last resort responses to food insecurity, can only temporarily alleviate the situation. These actions cannot eliminate it as they depend upon voluntary charitable responses such as provision of a food parcel intended to supplement a household's food for less than 1 week( Reference Hamilton, Cook and Thompson 25 , Reference McKay 37 ). Special food grants are one-off payments by government agencies as a temporary measure to alleviate the situation. In NZ, food banks are charitable, and it has no programmes analogous to the Supplemental Nutrition Assistance Program, a permanent government-funded institutional response, where enrolment is for a longer-term duration.
The scale divisions of the NZ Food Security Model set to assign categories of food security status can be considered satisfactory for several reasons. Intuitively, on the one hand, the resource augmentation actions (two indices) would be expected to be taken only by households experiencing the most severe form of food insecurity. On the other hand, the food security index ‘Variety of foods eaten is limited’ was the most frequently experienced aspect of food insecurity across all age, sex and ethnic subgroups of the population( Reference Parnell, Reid and Wilson 22 ), and this is the aspect of food insecurity at the least severe end of the scale. The demonstrated ability of the categories as assigned to predict nutritional outcomes is further evidence of their external validity.
The cumulative evidence from a variety of studies( Reference Perez-Escamilla, Segall-Correa and Kurdian Maranha 30 , Reference Dowler and Calvert 38 – Reference Tingay, Tan and Tan 42 ) has demonstrated that when economic circumstances engender food insecurity, fruits and vegetables are first foods to be reduced or omitted in the diet. This is to be expected given their relatively low energy density and perishability( Reference Drewnowski and Specter 43 ). These results illustrate that in the NZ population, the level of food insecurity increased the probability of eating less than the recommended number of servings of fruits and vegetables. The lower levels of intake of fructose, glucose, vitamin C and vitamin B6 with increasing levels of household food insecurity are fully congruent with these food choice data since fruits are important contributors of these nutrients in the diet in NZ( 44 ).
In the NZ population, where it is clear that meat is a dietary preference( Reference Russell, Parnell and Wilson 27 ), rather than omitting meat from the diet, food insecurity moves the meat choice towards cheaper, higher fat options. It is possible that in NZ, food insecurity could result in some reduction in meat portion size or frequency of consumption overall, similar to what was noted in Brazil, namely that the food-insecure households were less likely to consume meat on a daily basis( Reference Perez-Escamilla, Segall-Correa and Kurdian Maranha 30 ). While this question cannot be entirely resolved from the data presented, the fact that vitamin B12 intake, one-quarter of which is sourced from animal products that include meats, was significantly higher among the least food secure, points to the conclusion that meat portion size is not reduced. However, the deduction can be made from these data that for the food insecure, there is an economic barrier to achieving recommended dietary practices, i.e. choosing lean meats.
There is further evidence for the relationship between food security status and both food and nutrient intakes. The least food secure had higher intakes of total, saturated, monounsaturated and polyunsaturated fats and also cholesterol. Such a relationship between food security status and level of fat intake in the diet has not been demonstrated before either in studies where a surrogate food security measure has been used( Reference Kendall, Olsen and Frongello 40 , Reference McIntyre, Connor and Warren 45 , Reference Rose and Oliveira 46 ) or in the one study( Reference Tarasuk 47 ) where the predictive variable was the validated US measure of food security status. The particularly striking variation in fat intake (10 % higher for the least food-secure category compared with the most food-secure category) has not been demonstrated previously. Again, for New Zealanders, it illustrates that achieving dietary goals (in this case to reduce the proportion of energy from fat, in particular saturated fat) is impeded by food insecurity( 28 ). The fact that 5 % of the population are in severely food-insecure households and many more in moderately food-insecure households highlights the fact that a reduction in food insecurity might have an impact on the fat intake of the population. This in turn could have a positive influence on obesity levels. The paradox that those who are food insecure are more likely to be obese( Reference Adams, Grummer-Strown and Chavez 48 ) might in part be explained by the higher fat intakes among the least food-secure group.
Lactose intake is a marker of dairy product consumption. Dairy products are frequently consumed in the NZ diet, particularly the high fat options such as full-cream milk and cheddar cheese( Reference Russell, Parnell and Wilson 27 ). Given the higher lactose intake by the food insecure, it appears that dairy products may contribute to the fat burden of the food insecure.
Other studies have found an association between increased food insecurity, or insufficiency, and decreased intake of the following nutrients: vitamin C( Reference Dowler and Calvert 38 , Reference Kendall, Olsen and Frongello 40 , Reference Tarasuk and Beaton 41 , Reference McIntyre, Glanville and Raine 49 ); Fe( Reference Kendall, Olsen and Frongello 40 , Reference Tarasuk and Beaton 41 , Reference McIntyre, Glanville and Raine 49 , Reference Dowler, Calvert, Kohler, Feichtinger, Barlosius and Dowler 50 ); Ca( Reference Kendall, Olsen and Frongello 40 , Reference Tarasuk and Beaton 41 ); folate( Reference Tingay, Tan and Tan 42 , Reference McIntyre, Glanville and Raine 49 , Reference Dowler, Calvert, Kohler, Feichtinger, Barlosius and Dowler 50 ); dietary fibre( Reference Dowler and Calvert 38 , Reference Kendall, Olsen and Frongello 40 ); vitamin A( Reference Tarasuk and Beaton 41 , Reference McIntyre, Glanville and Raine 49 ). However, more extensive measures of nutrient intake were used in these studies on smaller and relatively homogeneous populations compared with the present study. Also, within any given country or culture, the relative costs of particular foods or beverages and the foods that are ‘preferred’ are likely to differ( Reference Drewnowski and Specter 43 ). Food insecurity might therefore be expected to be associated with food and nutrient intake levels uniquely in different countries or cultures. However, it must be emphasised that while in NZ, household food security appears to be unrelated to the concurrent intakes of Fe, Ca and folate, for example, intakes of these nutrients in the population are not necessarily ideal( Reference Russell, Parnell and Wilson 27 ); factors other than food security status may influence the food choices determining their level of intake and utilisation.
Conclusions
A population-specific model of food security has been successfully developed for use in NZ. It illustrates that the relatively short eight-index food security model is effective and the underpinning aspects of food insecurity were successfully captured in the focus group method used in the development phase. The NZ Food Security Model is an instrument with both internal and external validity. It also has an acceptable respondent burden for use in national health and nutrition surveys. It is not only an important tool in these contexts to monitor the food security status of the whole population, but also is suitable for use in studies of the health and nutrition of socio-economically deprived sectors.
The evidence for the conclusion that the instrument has validity (fitness for purpose) as outlined by Frongillo( Reference Frongillo 9 ) is as follows. The construction of the items was ‘well grounded’ in the verbalised experiences of food-insecure New Zealanders. In accord with item response theory (Rasch analysis), a logical sequence of response from less to more severe ‘experience’ is demonstrated in a national sample of households. Internal consistency has been reasonably upheld with good separation of the items (each capturing a distinct aspect of the phenomenon) and performing reasonably reliably in the model. Household food security status is associated with nutrition outcomes in an ‘expected manner’; the members of most food-insecure households had the poorest nutrition.
Given the demonstrated ability of food security status to predict the ability to meet recommended food guidelines and also nutrient intakes, particularly those well known to influence health, its use could now be considered as one of the markers of nutritional status in the NZ population. The successful process of developing a valid, reliable and practical instrument for measuring household food security in NZ illustrates that other developed countries could also do this. It would enable them to appropriately monitor the food security status of their population over time and to explore relationships between food security status, nutrition and other health parameters within their population.
Acknowledgements
The data used in this study were from the Adult National Nutrition Survey of 1997. The present survey was funded by the New Zealand Ministry of Health, and conducted by the University of Otago.
The authors’ responsibilities are as follows: W. R. P. formulated the research question, made a major contribution to the development of the food security indices (underlying the ultimate research tool), was responsible for the data collection, worked with A. R. G. on the analysis and drafted the manuscript; A. R. G. took responsibility for the statistical methods chosen to develop the tool, based on the eight indices, carried out the statistical analyses, including Rasch analysis, and contributed to the discussion of the results.
There are no conflicts of interest to declare.



