Childhood obesity is a major public health problem. The National Health and Nutrition Examination Survey (NHANES) 2009–2010 data showed that nearly 15 % of US children aged 2–5 years were overweight, while 12 % were obese(Reference Ogden, Carroll and Kit1). Key contributing factors to overweight and obesity in children have not been determined; however, most experts agree that weight gain occurs when dietary intake exceeds energy expenditure. Children's eating patterns are initiated early in life (i.e. at age 2–5 years), suggesting that the pre-school period is a pivotal developmental time point during which healthful eating patterns may be fostered(Reference Cashdan2–Reference Birch6).
Child-care settings are an increasingly important social environment in which food-related behaviours develop, since up to 60 % of young children are cared for in these settings and thus eat outside their parents’ care(Reference Capizzano and Adams7). Head Start (HS) is a US federal child-care programme that provides comprehensive services to children of pre-school age and their families who have incomes below the federal poverty level(8). HS programmes are expected to encourage family-style meal service to allow children to: (i) identify and be introduced to new foods, tastes and new menus; (ii) choose the amount of food they want to have on their plate; and (iii) practise good table manners and new skills with their hands and fingers(9).
Child-care feeding practices have important implications for the development of eating patterns, including practices involving portion size; however, little is known about the characteristics of the eating environment and its potential effect on weight status(Reference Freedman and Alvarez10). Young children demonstrate self-regulation of short-term energy intake but environmental cues regarding food intake can override this ability(Reference Rolls, Engell and Birch11–Reference Birch, McPhee and Sullivan13). Exposure to large portion sizes is one strong environmental cue that is positively associated with increased energy intake in population-based and experimental studies of children(Reference Rolls, Engell and Birch11, Reference McConahy, Smiciklas-Wright and Birch14–Reference Fisher20).
Large portion sizes may contribute to the high prevalence of overweight among children by promoting excessive intake at meals(Reference Rolls, Engell and Birch11, Reference Fisher, Rolls and Birch17–Reference Fisher and Kral21). Studies have shown that increased portion sizes of energy-dense foods promoted increased intake of those foods and were positively related to body weight(Reference McConahy, Smiciklas-Wright and Birch14, Reference Huang, Howarth and Lin16, Reference Ello-Martin, Ledikwe and Rolls22). The effects of large portions on intake may extend to fruits and vegetables and encourage increased consumption(Reference Kral, Kabay and Roe23, Reference Spill, Birch and Roe24). Children's intake of fruits and vegetables remains low and does not meet the daily recommendation(Reference Bachman, Reedy and Subar25, Reference Krebs-Smith, Guenther and Subar26). That fruit and vegetable intake has been inversely related to body weight in some adult studies suggests that low intake might also place children at increased risk for obesity, as well as for cancer and other chronic diseases later in life(Reference Ledoux, Hingle and Baranowski27).
More studies are needed to better understand factors that influence portion sizes of a variety of foods, in an effort to decrease the excessive intake of energy-dense foods and increase the consumption of fruits and vegetables(Reference Mendoza, Drewnowski and Cheadle28–Reference Leahy, Birch and Rolls30). Little is known about food portions served and the amount of plate waste in meals served to young children in day care. It is unknown whether variations in portion sizes of fruits and vegetables have a beneficial effect on children's intake of those foods. Therefore the primary goal of the present study was to examine the variability in the portions of foods served and consumed by African-American and Hispanic-American children of pre-school age attending HS. A secondary goal was to examine whether child characteristics were associated with the amount of total food served and consumed by the children at the lunch meal.
Experimental methods
Lunch meals at Head Start
All participating HS centres provided family-style lunch meals where children served themselves the food offered at that meal. On rare occasions the teacher helped with serving the food to the children. The kinds of foods served at the lunch menu were required to meet minimum standards recommended in the Child and Adult Care Food Program (CACFP)(31) meal pattern requirements. Given that the children served themselves, the amount of food served and consumed by each child varied. Thus, the amounts served reflected the self-service amounts.
Food consumed
Digital photography(Reference Hampl, Dixon and Hall32) was used to measure 3 d of lunch meal intake for each child participating in the study. To examine the types of foods that were offered and consumed, foods were categorized into six different food groups: entrées, starches, vegetables, fruit, beverages and condiments. Prior to lunch, the children were briefly told that the research staff would be taking pictures of the food on their plate. For the diet assessment, the plate of food was photographed with a digital camera, and any second servings and plate waste were also photographed during or after the meal. The foods were photographed with a digital camera mounted on a tripod with the lens 60 cm (2 ft) above and 60 cm (2 ft) away from the centre of the meal plate with a camera angle of 45°. A place mat with marked regions for placement of the meal plate was fixed to the table supporting the camera tripod to ensure optimal visibility of the meal plate. The same camera angle and distance from foods were used throughout, so that the apparent size of all foods remained constant across the photographs. While in the dining location, photographs of weighed reference portions of the food choices available to the children on each day of data collection were also taken(Reference Nicklas, O'Neil and Stuff33). The reference portions of foods were the standards used to determine the amount of foods that were on the filled plates.
In the laboratory, a computer application was used to simultaneously display the digital photographs of the reference portions and meal plate showing either food selection or plate waste. Trained research staff estimated the percentage of the reference portion of the food selections, any second helpings and plate waste.
The trained estimators were not the same staff who did the nutrient coding. To derive the energy and nutrient contents for each food served in the HS centres during the study, foods were coded using the Nutrition Data System-Research (NDSR) dietary analysis program version 2006 (Nutrition Coordinating Center, University of Minnesota, Minneapolis, MN, USA). The HS staff provided recipes, labels and preparation of food items. For mixed dishes, an attempt was made to match the food to a similar food item in NDSR. If no match was available, the components of the recipe were coded. The food groups used in the present study reflect the CACFP meal pattern requirements(31) for those specific food groups. For each food item, the nutrient content was expressed per gram and was multiplied by the gram weight for portion size, plate waste and food intake for each child. Results for macronutrients in each food's portion size, plate waste and intake were downloaded and merged with other variables in the master database.
The digital photography method has been found to be reliable and accurate when used to measure the food intake of pre-school children. Mean differences between directly weighed foods and the digital photography method range from <6 g to 11 g; agreement is consistently high among the research staff who estimate portion sizes; and the overall portion size estimates highly correlate with weighed portion sizes (r values range from 0·77 to 0·96)(Reference Nicklas, O'Neil and Stuff33).
Anthropometrics
Duplicate heights and weights were obtained following a standardized protocol which included quality control procedures(Reference Lohman, Roche and Martorell34). Heights and weights of the teachers and children were obtained by trained research staff at the HS centre and the average values were used in the present study.
Demographics
A demographic questionnaire (e.g. age, ethnicity) was completed by the teachers at the HS centre. For the children, both the research staff and the teachers mutually completed the demographics questionnaire for each child participant.
Statistical analyses
All statistical analyses were run using the SAS statistical software package version 9·2. Weight and height status of the children were measured, from which BMI were calculated as weight (in kilograms) divided by the square of height (in metres) and converted to age- and gender-appropriate BMI Z-scores or percentiles from the Centers for Disease Control and Prevention Reference Standards(Reference Kuczmarski, Ogden and Guo35).
Means and standard deviations, as well as the frequency distribution of participant characteristics, and the amounts of food served, plate waste and food consumed were calculated and then averaged for each food group (fruits, vegetables, entrées, milk, condiments and starches) and for all foods together. Energy density was defined as mean energy content per weight of food (kJ/g) consumed at the lunch meal. Post hoc comparisons for total energy from food intake and total amount of food consumed were examined across energy density tertiles. Plots and histograms of residuals were used to investigate homogeneity of variance and normal distribution of variables. P < 0·05 was considered statistically significant. A Bonferroni correction was used to adjust the significance level for multiple comparisons.
Multilevel modelling was necessary to account for cluster effects and to provide greater efficiency because the children were nested within teachers/classrooms and teachers/classrooms were nested within schools/centres. Three-level hierarchical models were performed to assess whether selected demographic characteristics of the children were associated with the amount of food served, plate waste and intake. Demographic characteristics included gender, ethnicity/race, age and BMI Z-score as first level (children), while teachers’ characteristics included ethnicity/race, age and BMI as second level, and schools/centres as third level.
Results
The study included pre-school children (n 796) attending HS (51 % boys, 42 % African-American and 58 % Hispanic-American). Thirty-nine per cent of the children were overweight or obese. The children were recruited from 149 classrooms within sixteen HS centres in Houston, Texas. Consent forms were sent home with the children for parents to sign for their child (passive consent). Active consent was received for the teachers participating in the study.
The mean amount of food in lunch meals served and consumed by food type is shown in Table 1. The mean amount of food/milk served was 572 g (58 % food). The mean amount of food/milk plate waste was 240 g; thus 331 g were consumed. The mean amounts of food/milk served to pre-schoolers at the lunch meal were comparable to the CACFP requirements(31): 2·54 ounces for the entrée (meat/meat alternate), 0·77 ounces for the starch (grains/bread), 0·59 cups for the vegetables, 0·54 cups for the fruit and 1·07 cups for the milk food components (data not shown). However, the CV of the amount of food/milk served by food type varied considerably: 44 % for vegetables, 76 % for starch, 8 % for milk, 33 % for entrées and 60 % for fruit. Only 57 % of the total food served was actually consumed. Plate waste was highest for vegetables (61 %) and lowest for fruit (38 %) and entrées (39 %). The energy density of the food served and consumed was highest for entrées and starches and lowest for fruit and milk.
Characterizing lunch meals in terms of energy density and amount served, wasted and consumed, according to food type served: pre-school children (n 796) enrolled in sixteen Head Start centres, Houston, Texas

Ratio = intake/served.
1 kcal = 4·187 kJ.
The macronutrient composition of the lunch meal served and consumed is shown in Table 2. The mean energy intake from the lunch meal was 1421 kJ (339 kcal). The macronutrient percentage of total energy was 21 % protein, 46 % carbohydrate and 34 % fat. Figure 1 shows the relationship between the total amount of food served and the total amount of food consumed. There was a significant (P < 0·0001) linear increase in the food served and the amount of food consumed (Fig. 1). This was true for all food categories. There was a significant (r = 0·43, P < 0·0 0 1) correlation between the total amount served and the amount consumed, ranging from 0·71 (vegetables, P < 0·0001) to 0·80 (starches, P < 0·0001).
Macronutrient composition of lunch meals served and consumed by pre-school children (n 796) enrolled in sixteen Head Start centres, Houston, Texas

Ratio = intake/served.
1 kcal = 4·187 kJ.
Association between lunch meals served and consumed by pre-school children (n 796) enrolled in sixteen Head Start centres, Houston, Texas. Total intake = 43·6+0·50 × total served; R 2 = 0·18, P < 0·0001
There were significant linear relationships between the total energy intake from food, energy density and the amount of food consumed by the children at the lunch meal (Fig. 2). For the lowest tertile of energy density of total food consumed, there was a significantly lower total energy intake from food (P < 0·0001) and a significantly higher total amount of food consumed (P < 0·0001), compared with the middle-to-upper energy density tertiles.
Relationship of (a) energy intake from foods and (b) amount of food consumed at the lunch meal with energy density among pre-school children (n 796) enrolled in sixteen Head Start centres, Houston, Texas. Values are means with their standard errors represented by vertical bars. a,bMean values with unlike superscript letters were significantly different (P < 0·0001). 1 kcal = 4·187 kJ
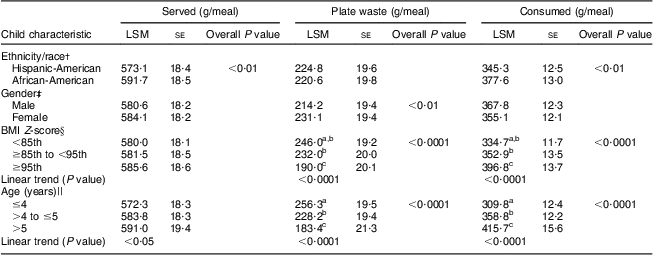
Several child characteristics were associated with the amount of total food served and consumed at the lunch meal (Table 3). African-American children served themselves more food than Hispanic-American children (P = 0·007) and had significantly higher food intakes (P = 0·0014). Although the amount of food the children served themselves did not vary by BMI, the heavier children were more likely to consume larger amounts of food (P trend < 0·0001). There was a linear increase in the total amount of food consumed by age (P trend <0·0001). The oldest children (5 years) consumed 106 g more food than the youngest children (3 years).
Mean variation in amount of food served and consumed at lunch meals by child characteristics: pre-school children (n 796) enrolled in sixteen Head Start centres, Houston, Texas
LSM, least square mean.
a,b,cMean values within a column with unlike superscript letters were significantly different (Bonferroni correction P < 0·0167).
†Controlling for child's gender, age and BMI Z-score and teacher's ethnicity/race, age and BMI.
‡Controlling for child's ethnicity/race, age and BMI Z-score and teacher's ethnicity/race, age and BMI.
§Controlling for child's ethnicity/race, gender and age and teacher's ethnicity/race, age and BMI.
||Controlling for child's ethnicity/race, gender and BMI Z-score and teacher's ethnicity/race, age and BMI.
There was considerable variation in the mean amount of food/milk served at the lunch meal across the sixteen HS centres (Fig. 3). The mean amount of food/milk served ranged from 228 to 503 g with an intra-class correlation coefficient of 0·47. The variation in the mean amount consumed across sixteen HS centres was much smaller. Mean intake ranged from 132 to 255 g with an intra-class correlation coefficient of 0·14.
Variation (intra-class correlation) in lunch meals served and consumed among pre-school children (n 796) enrolled in sixteen Head Start centres, Houston, Texas.  , amount served (mean range 228–503 g, intra-class correlation coefficient between schools = 0·47;
  , amount consumed (mean range 132–255 g; intra-class correlation coefficient between schools = 0·14)
Discussion
To our knowledge, the present study is the first to evaluate lunch meals by the amounts served and consumed by pre-school children in HS. Specifically, the amount of foods served was evaluated together with child characteristics as potential predictors for the amount of foods consumed. On average, the mean amount of foods/milk served to pre-schoolers at the lunch meal was comparable to the CACFP requirements. However, the variation in the amount of foods served and consumed was substantial, particularly across the sixteen HS centres. Plate waste of the HS lunch meal was very high, with 43 % of total food served not being consumed.
There was a significant correlation between the amount of food served and the amount consumed. This is consistent with the literature that children who received a larger portion of food consumed more food than if they received a smaller portion(Reference Rolls, Engell and Birch11, Reference Fisher, Rolls and Birch17–Reference Fisher20). Children aged 3–5 years consumed 25 % more of an entrée and 15 % more total energy at lunch when presented with portions that were double an age-appropriate standard size(Reference Fisher, Rolls and Birch17). Despite the amount of food wasted, results suggested that larger portions resulted in increased intake. Food portions served have been positively related to body weight of 1-year-old children, where children with higher body weights consumed, on average, larger portions(Reference McConahy, Smiciklas-Wright and Birch14). Similar results were found in the present study, in that obese children were more likely to consume larger amounts of food.
Intake of an entrée has been shown to be greater with large portions than with self-selected portions(Reference Fisher, Rolls and Birch17, Reference Fisher20). However, in the present study the portions served to the child were all self-selected portions but these varied considerably. Children generally selected portions of food that were equivalent to, or greater than, the minimum portion sizes specified in the CACFP meal pattern requirements(Reference Fox, Glantz and Geitz36). Children generally consumed between 70 and 75 % of the portions of food taken at lunch. Different types of foods were consumed in varying proportions, with 73 % of the milk being consumed and only 59 % of the vegetables(Reference Fox, Glantz and Geitz36). The wide range of children's observed self-served portion sizes suggests that allowing children to self-serve may be less beneficial to some children than to others, since increased amounts of foods served were associated with increased intakes. This was true for the energy-dense foods but not the case with fruits and vegetables.
Total energy intake increased significantly with increased energy density of the total food consumed. Children who ate the lunch meal with the lowest energy density (tertile 1) consumed 925 kJ (221 kcal) compared with those in the upper tertile who consumed 1227 kJ (293 kcal). An effect of meal energy density on energy intake is consistent with experimental and population-based studies of energy density in children(Reference Mendoza, Drewnowski and Cheadle28–Reference Leahy, Birch and Rolls30). Further, in the present study total food intake (in grams) was also negatively associated with meal energy density, consistent with relationships reported in the Feeding Infants and Toddlers Study between energy density and food portions consumed(Reference Fox, Devaney and Reidy37). Highly controlled experimental studies of energy density in children have demonstrated that the weight of food intake is not substantially altered by systematic changes to energy density, such that children consume greater amounts of energy when more energy-dense versions of foods are served(Reference Leahy, Birch and Fisher29, Reference Leahy, Birch and Rolls30, Reference Leahy, Birch and Rolls38). Taken together, the findings of the present research suggest that HS children consume more energy at school meals when more energy-dense meals are offered.
Another key finding was the influence of age, ethnicity and BMI on portion size and young children's intake at the lunch meal. African-American children served themselves a larger amount of food than Hispanic-American children, resulting in significantly higher intakes. Older children consumed more total amount of food than younger children. The obese children consumed more total food than the overweight and normal-weight children, despite the finding that there was no difference in the amount that was served by weight status. In one study, the tendency to consume more when served large portions was not influenced by age, ethnicity or BMI(Reference Birch, McPhee and Sullivan13). However, population-based studies suggest that family demographics, including income, ethnicity and education, may influence the extent to which children prefer and consume large portions(Reference McConahy, Smiciklas-Wright and Birch14, Reference Colapinto, Fitzgerald and Taper39).
The mean energy and macronutrients from the lunch meal consumed are similar to levels reported for children aged 2–5 years from national surveys(40). Pre-school children consumed an average of 1423 kJ (340 kcal) from the lunch meal and the percentage of protein, carbohydrate and fat did not exceed the Institute of Medicine's Acceptable Macronutrient Distribution Ranges(41). A recent national survey showed that, on average, children in HS consumed adequate amounts of all key nutrients studied(Reference Bucholz, Desai and Rosenthal42). However, compared with other low-income children of the same age, HS children were at greater risk for not meeting the RDA for total daily intake of thiamin, riboflavin, niacin and Ca. Other studies have evaluated food intake of children at child-care centres(43, Reference Padget and Briley44). They found that children aged 3 years consumed sufficient fruits and meat/alternates, but insufficient grains, vegetables or dairy to meet two-thirds of the Food Guide Pyramid recommendations for young children. The children aged 4 and 5 years only consumed the recommended amounts of dairy.
In the present study, the amount of food consumed by children at the HS lunch meal was assessed with a more precise method than the dietary methods used in other studies(Reference Nicklas, O'Neil and Stuff33, Reference Williamson, Allen and Martin45–Reference Martin, Han and Coulon47). The digital photography method has been used in a number of settings and its reliability and validity have been established in adults(Reference Williamson, Allen and Martin45, Reference Martin, Nicklas and Gunturk48, Reference Williamson, Martin and Allen49), school-age(Reference Martin, Han and Coulon47, Reference Martin, Nicklas and Gunturk48, Reference Martin, Newton and Anton50) and pre-school(Reference Nicklas, O'Neil and Stuff33) children. Portion size estimates correlate highly with weighed portion sizes(Reference Williamson, Allen and Martin45) and mean differences between directly weighed foods and digital photography estimates are minimal (<6 g) with no systematic bias over levels of food intake(Reference Williamson, Allen and Martin45). These results are consistent with those shown specifically with pre-school children(Reference Nicklas, O'Neil and Stuff33). In the NHANES, the nutritional intakes of pre-school children were assessed with parents serving as a proxy for their child's intake. Older studies have shown that parental recall of pre-school children's intake is a valid measure(Reference Klesges, Klesges and Brown51, Reference Baranowski, Sprague and Henske52); however, more recent studies show that parental recalls may overestimate what a child is consuming outside the home in day care(Reference Klesges, Klesges and Brown51–Reference Fisher, Butte and Mendoza53).
Our study found that the energy intake of the lunch meal consumed by children in the NHANES was comparable to what was actually served to the children in day care. Yet, with 43 % plate waste found in the lunch meal at day care, children's energy intake from the lunch meal was actually 42 % lower than the amount of energy served.
Limitations
Use of a convenience sample, such as the one used in the present study, has several inherent limitations including that the results may not be representative of pre-school children outside the Houston HS population and may be difficult to duplicate. Another limitation is that information on caregivers’ behaviours related to child self-service was not collected and may have influenced the variability in the results. Data were also not collected on the menus across the sixteen HS centres or on the demographic composition of the classrooms. Lack of consistency in the menus or differences in classroom compositions may have contributed to the variability in the amount of food consumed across the centres. Conducting digital photography in the HS centre may be viewed as intrusive with the potential of influencing the typical consumption of lunch meals and the environment surrounding the lunch meals. However, there was large variation in the amount of food served and plate waste, suggesting that children's eating behaviour at the lunch meal was not altered. The amount of variability captured in food intake using this unobtrusive method has been shown in other studies(Reference Nicklas, O'Neil and Stuff33, Reference Martin, Correa and Han46–Reference Martin, Nicklas and Gunturk48, Reference Martin, Newton and Anton50, Reference Williamson, Allen and Martin54). The method is limited in terms of the environment in which it can be used. It has been used only to assess lunch and dinner meals in a child care or home setting and does not translate in measuring the real-life 24 h dietary intake of pre-school children. This method can serve as a methodological foundation for incorporating more technological innovations(Reference Boushey, Kerr and Wright55), such as cell phones using computer imaging algorithms(Reference Martin, Han and Coulon47, Reference Martin, Kaya and Gunturk56), for reducing the burden on respondents and research staff and to measure food intake in near real time in free-living conditions(Reference Martin, Newton and Anton50, Reference Williamson, Allen and Martin54).
Conclusion
Findings from our study showed that plate waste was high. Variation in the amounts served and consumed was substantial and the amounts served were positively associated with the amounts consumed. Finally, child characteristics influenced the amount of food served and consumed by pre-school children. Given that large portion sizes may contribute to the high prevalence of overweight among children by promoting excessive intake at meals, teaching pre-school children how to serve themselves appropriately sized amounts of food may help prevent obesity and reduce food waste.
Acknowledgements
Sources of funding: This research project was supported by the US Department of Agriculture (USDA)/Agricultural Research Service (ARS) through specific cooperative agreement 58-6250-6-003 and the National Cancer Institute (Grant 5 R01 CA-107545). Partial support was received from the USDA Hatch Project LAB 93951. Conflicts of interest: The authors declare that they have no conflict regarding this paper and have no involvements that might raise the question of bias in the work reported or in the conclusions, implications and opinions stated. Ethics: The study was approved by the Institutional Review Board for Baylor College of Medicine and Affiliated Hospitals. Authors’ contributions: T.A.N. conceptualized the study and wrote the first draft of the manuscript. C.E.O'N. and J.A.M. substantially revised the manuscript with critical feedback. Y.L. conducted all data analyses and wrote parts of the statistical analyses section. J.E.S. and J.O.F. edited the manuscript. All of the authors listed in this paper meet the criteria set down by the International Committee of Medical Journal Editors. No one who might consider that he or she has a right to be an author has been excluded. Acknowledgements: The authors thank the USDA and National Cancer Institute for providing financial assistance. They extend a special thanks to the administration of the HS districts in Houston, Texas, i.e. Neighborhood Centers Inc., Avance and Gulf Coast, and all of the children and families who have participated in the study. Special thanks go to Sandra Lopez for coordinating the study, Lori Briones for help in preparing the manuscript, and Bee Wong for obtaining research articles.