


1. Introduction
Laser–plasma interaction of high-peak-power femtosecond (fs) and kilohertz-class lasers with a wide range of applications is an exciting area of research (Malka et al. Reference Malka, Faure, Gauduel, Lefebvre, Rousse and Phuoc2008; Rovige et al. Reference Rovige, Huijts, Andriyash, Vernier, Tomkus, Girdauskas, Raciukaitis, Dudutis, Stankevic, Gecys, Ouille, Cheng, Lopez-Martens and Faure2020; Hidding et al. Reference Hidding, Assmann, Bussmann, Campbell, Chang, Corde, Cabadag, Debus, Döpp and Gilljohann2023). The propagation of the laser pulses over a long distance and the ability to create a plasma channel and control its length are significant subjects of research on laser wakefield accelerators (LWFAs) (Andreev et al. Reference Andreev, Chizhonkov, Frolov and Gorbunov1998; Tomassini et al. Reference Tomassini, De Nicola, Labate, Londrillo, Fedele, Terzani, Nguyen, Vantaggiato and Gizzi2018; Palastro et al. Reference Palastro, Shaw, Franke, Ramsey, Simpson and Froula2020). The energy of accelerated electrons depends on the laser–plasma interaction length (which is proportional to the Rayleigh length). The investigated methods of increasing laser–plasma interaction length and accelerating beam guiding can be divided into three categories: (1) self-focused propagation; (2) propagation in hollow fibre structures; and (3) laser-pulse pre-formed plasma waveguides. The first method is associated with relativistic self-focusing and ponderomotive charge displacement by the femtosecond laser pulse. By employing this method, the refractive index of the on-axis plasma channel increases with the relativistic increase of electron inertia near the centre of the beam and ponderomotive charge expulsion to the side of the channel (Milchberg et al. Reference Milchberg, Kim, Kumarappan, Layer and Sheng2006). Self-focusing of the laser pulse in an ionised gas facilitates the guiding of the laser pulse beyond its Rayleigh length. However, the process typically depends delicately on plasma instabilities (Esarey, Schroeder & Leemans Reference Esarey, Schroeder and Leemans2009). Implementation of the second method allows to produce a stable plasma-guiding channel and accelerate electron bunches up to 8 GeV. This technique was realised by propagating of the accelerating laser pulse in a capillary with a gas pre-ionised by discharge current and preheated with a supplementary laser pulse. It led to the creation of a parabolic plasma channel guiding the accelerating high-peak-power laser pulse over approximately 10 cm (Leemans et al. Reference Leemans, Gonsalves, Mao, Nakamura, Benedetti, Schroeder, Tóth, Daniels, Mittelberger and Bulanov2014; Gonsalves et al. Reference Gonsalves, Nakamura, Daniels, Benedetti, Pieronek, De Raadt, Steinke, Bin, Bulanov and Van Tilborg2019). The third method was implemented using an axicon lens or parabolic mirror with extended focal depth to pre-ionise the gas along the extended focal area and produce the guiding plasma channel. A parabolic plasma channel was formed within a few nanoseconds due to the hydrodynamic expansion of pre-ionised plasma. Experimental and theoretical investigations have demonstrated that the recombination process and the lifetime of a plasma channel created by a single femtosecond laser pulse was in the range of several nanoseconds (Tzortzakis et al. Reference Tzortzakis, Prade, Franco and Mysyrowicz2000). A long pre-ionising laser pulse allows to heat the plasma electrons by inverse Bremsstrahlung and increase the channel lifetime (Hao et al. Reference Hao, Zhang, Li, Lu, Yuan, Zheng, Wang, Ling and Wei2005). However, long pulses, due to diffraction losses, are challenging to propagate over long distances and it is difficult to cope with the guiding requirements of using such a guiding scheme. Another way to form the parabolic plasma channel is to use the relativistic and ponderomotive self-channelling of the pre-ionising laser pulse (Mohamed et al. Reference Mohamed, Chen, Kim, Tao, Ahn and Kim2011). Recently, the laser-pulse pre-formed plasma guiding channels produced using various techniques have been studied by several authors (Osterhoff et al. Reference Osterhoff, Popp, Major, Marx, Rowlands-Rees, Fuchs, Geissler, Hörlein, Hidding and Becker2008; Zhang et al. Reference Zhang, Chen, Luo, Zeng, Yuan, Yu, Ma, Yu, Yu and Weng2016; Smartsev et al. Reference Smartsev, Caizergues, Oubrerie, Gautier, Goddet, Tafzi, Phuoc, Malka and Thaury2019; Chitgar et al. Reference Chitgar, Gibbon, Böker, Lehrach and Büscher2020; Tang et al. Reference Tang, Yin, Hong, Gao, Cheng and Xue2020). Lu et al. (Reference Lu, Chen, Ma, Hou, Liao, Wang, Han, Liu, Teng and Han2015) considered a quasi-steady-state plasma channel with a 60–80 ns lifetime formed by pulse sequences of a femtosecond laser in air. Smartsev et al. (Reference Smartsev, Caizergues, Oubrerie, Gautier, Goddet, Tafzi, Phuoc, Malka and Thaury2019) presented the axiparabola as a novel reflective optics instrument that permits prolonging the propagation of diffraction-free high-peak-power and broadband laser pulses. It was observed that a laser beam shaped by axiparabola forms a 10 mm long plasma channel and guides a 20 TW laser radiation over nearly 10 Rayleigh lengths. Shalloo et al. (Reference Shalloo, Arran, Corner, Holloway, Jonnerby, Walczak, Milchberg and Hooker2018) showed that fully ionised and low-density plasma channels could be produced by the hydrodynamic expansion of plasma columns generated by optical field ionisation (OFI). Furthermore, it was found that an axicon lens could be used to generate long plasma channels with on-axis densities of the order of ${n_e} \approx {10^{17}}\;\textrm{c}{\textrm{m}^{ - 3}}$ , matched spot-sizes wM ≈ 40 μm, and attenuation lengths of the order of L att ~ 1000 mm. Lemos et al. (Reference Lemos, Cardoso, Geada, Figueira, Albert and Dias2018) explored the plasma waveguides produced by the laser pulses with intensities of ~1015 W cm−2 in an 8 mm long hydrogen plasma waveguide with a 35 % guiding efficiency. Zhang et al. (Reference Zhang, Chen, Luo, Zeng, Yuan, Yu, Ma, Yu, Yu and Weng2016) investigated the electron beam acceleration with multiple transverse plasma density structures in a wakefield driven by a Laguerre–Gauss (LG) pulse through three-dimensional particle-in-cell (PIC) simulations. It was found that the wakefield has various transverse structures under proper conditions, and it was demonstrated that the doughnut-like wakefield structures could accelerate the ring-shaped hollow electron beam. Tang et al. (Reference Tang, Yin, Hong, Gao, Cheng and Xue2020) studied the propagation dynamics of the azimuthally polarised first-order Bessel–Gauss (BG) laser beam in a parabolic plasma channel by using a two-dimensional PIC simulation. It was observed that the evolution of this dark hollow laser beam during propagation in the plasma channel could be classified into three types: (1) the propagation with a constant ring-shaped beam radius and width; (2) the synchronous periodic defocusing oscillation; (3) the synchronous periodic focusing oscillation. Vieira & Mendonça (Reference Vieira and Mendonça2014) considered the nonlinear laser-driven doughnut wakefield for positron and electron acceleration. The authors have shown that nonlinear wakefield driven by LG laser pulses can lead to the self-injection of a ring-shaped electron bunch and positron acceleration. The high-order modes of the laser beam form a doughnut-shaped wakefield able to accelerate positrons similarly as electrons are accelerated in a spherical bubble.
This paper aims to study the effects of LWFA accelerating pulse guiding of a doughnut Bessel–Gauss beam by using the PIC simulation method. The research is pushed by the progress in high-intensity, high-repetition-rate OPCPA lasers (Budriūnas et al. Reference Budriūnas, Stanislauskas, Adamonis, Aleknavičius, Veitas, Gadonas, Balickas, Michailovas and Varanavičius2017), which seem to be a promising alternative for LWFA applications to 10 Hz Ti:sapphire lasers with >30 fs pulse durations and a few Joule pulse energies. The emerging kHz-class lasers typically operate at a lower pulse energy of tens of millijoules and have a pulse duration of 7–10 fs. To drive the charged particles using this type of laser in the LWFA self-guiding bubble regime, plasma concentrations of n = 3–5 × 1019 cm−3 are required (Faure et al. Reference Faure, Gustas, Guénot, Vernier, Böhle, Ouillé, Haessler, Lopez-Martens and Lifschitz2018). Consequently, the diameter of the plasma bubble reduces from the typical 25 μm to 8 μm and tighter focusing of the laser beam is required. It leads to shorter acceleration distances of hundreds of micrometres, relatively low energy and high energy spread of accelerated electrons. Lowering the plasma concentration down to n = 3 × 1018 cm−3 would increase the acceleration distance. However, the available laser pulse energy of 40–60 mJ focused to the laser beam waist of 7–8 μm only allows reaching the intensities with the laser strength parameter a 0 = 1.5–2. The laser beam propagation is no longer in a self-guiding regime and additional means for extending acceleration distance are required. The increase of the acceleration distance with the laser-beam guiding permits getting electron bunches with higher energy, lower energy spread and divergence required by various potential applications such as compact secondary X-ray sources and very high energy electron (VHEE) radiotherapy (Fuchs et al. Reference Fuchs, Szymanowski, Oelfke, Glinec, Rechatin, Faure and Malka2009; Subiel et al. Reference Subiel, Moskvin, Welsh, Cipiccia, Reboredo, DesRosiers and Jaroszynski2017; Kokurewicz et al. Reference Kokurewicz, Brunetti, Welsh, Wiggins, Boyd, Sorensen, Chalmers, Schettino, Subiel and DesRosiers2019).
The parameters and stability of accelerated electrons depend also on the proper position and duration of electron injection into the plasma wakefield. Generally, to define the position of injection and control the charge of accelerated electrons, different approaches of injection as density down-ramp triggered injection (Gonsalves et al. Reference Gonsalves, Nakamura, Lin, Panasenko, Shiraishi, Sokollik, Benedetti, Schroeder, Geddes, van Tilborg, Osterhoff, Esarey, Toth and Leemans2011; Burza et al. Reference Burza, Gonoskov, Svensson, Wojda, Persson, Hansson, Genoud, Marklund, Wahlström and Lundh2013; Hansson et al. Reference Hansson, Aurand, Davoine, Ekerfelt, Svensson, Persson, Wahlström and Lundh2015; Massimo et al. Reference Massimo, Lifschitz, Thaury and Malka2017; Cardenas et al. Reference Cardenas, Chou, Wallin, Xu, Hofmann, Buck, Schmid, Rivas, Shen, Gonoskov, Marklund and Veisz2020), injection by a second laser beam (Fubiani et al. Reference Fubiani, Esarey, Schroeder and Leemans2004; Brijesh et al. Reference Brijesh, Thaury, Phuoc, Corde, Lambert, Malka, Mangles, Bloom and Kneip2012), ionisation-assisted (Golovin et al. Reference Golovin, Banerjee, Chen, Powers, Liu, Yan, Zhang, Zhang, Zhao and Umstadter2016) or self-truncated electron injection (Mirzaie et al. Reference Mirzaie, Li, Zeng, Hafz, Chen, Li, Zhu, Liao, Sokollik, Liu, Ma, Chen, Sheng and Zhang2015) are used. In the down-ramp density triggered injection cases, the formation of sharp plasma concentration gradients by using two nozzles (Gonsalves et al. Reference Gonsalves, Nakamura, Lin, Panasenko, Shiraishi, Sokollik, Benedetti, Schroeder, Geddes, van Tilborg, Osterhoff, Esarey, Toth and Leemans2011), and insertion of a wire (Burza et al. Reference Burza, Gonoskov, Svensson, Wojda, Persson, Hansson, Genoud, Marklund, Wahlström and Lundh2013), razor blade (Cardenas et al. Reference Cardenas, Chou, Wallin, Xu, Hofmann, Buck, Schmid, Rivas, Shen, Gonoskov, Marklund and Veisz2020) or capillary jet (Hansson et al. Reference Hansson, Aurand, Davoine, Ekerfelt, Svensson, Persson, Wahlström and Lundh2015) into the nozzle jet causing shock waves have been implemented. An alternative approach for better control of the injection with the position having a precision of 20–40 μm was proposed by manufacturing one-sided shock (OSS) nozzle from single block of fused silica using the three-dimensional (3-D) laser machining technique (Rovige et al. Reference Rovige, Huijts, Andriyash, Vernier, Tomkus, Girdauskas, Raciukaitis, Dudutis, Stankevic, Gecys, Ouille, Cheng, Lopez-Martens and Faure2020). The precise control of injection position by two beams was realized by Brijesh et al. (Reference Brijesh, Thaury, Phuoc, Corde, Lambert, Malka, Mangles, Bloom and Kneip2012) and Fubiani et al. (Reference Fubiani, Esarey, Schroeder and Leemans2004). An ionization injection scheme, using the combination of two nozzles injecting nitrogen mixed into the light gases, such as He or H2, and a second section with pure He or H2, was investigated by Golovin et al. (Reference Golovin, Banerjee, Chen, Powers, Liu, Yan, Zhang, Zhang, Zhao and Umstadter2016).
Advances in free-shape optics manufacturing permit getting nearly any desired spatial-temporal distribution of laser energy. We performed detailed simulations of the laser–plasma interaction using combined Bessel–Gauss doughnut-shaped and Gaussian laser pulses with a delay between laser pulses at a femtosecond scale. In this article, we investigate plasma structures excited by the Bessel–Gauss doughnut beam for guiding the accelerating Gaussian beam and laser wakefield acceleration of electrons using the Wake-T and FBPIC simulation tools.
2. Methods
Two open-source PIC simulation tools, Wake-T (Pousa, Aßmann & de la Ossa Reference Pousa, Aßmann and de la Ossa2019) and FBPIC (Lehe et al. Reference Lehe, Kirchen, Andriyash, Godfrey and Vay2016), were used for numerical simulation. The 3-D code Wake-T uses two-dimensional (2-D) cylindrical geometry (r,z) and quasi-static approximation (Pukhov Reference Pukhov2015). The laser pulse evolution was modelled by solving the equation of the vector potential of the envelope (Benedetti et al. Reference Benedetti, Schroeder, Geddes, Esarey and Leemans2017) rather than simulating the laser wave field. Therefore, it was not necessary to comply with the strict limitation on the simulation step size of the temporal coordinate resulting from the Courant condition. The step size was not limited by the laser wavelength scale; the limitation was only due to the plasma wavelength and Rayleigh length, which are much larger than the laser wavelength. Therefore, the computational efficiency of a quasi-static code can be up to six orders of magnitude higher than a standard 3-D PIC code (Pousa et al. Reference Pousa, Aßmann and de la Ossa2019). When simulating beam guiding with Wake-T, the limitation in BG pulse description is that the 2-D cylindrical geometry does not allow the introduction of the spiral phase of a high-order BG beam. Therefore, in this work, the results presented by Wake-T are obtained when the BG pulse profile fits the amplitude of the envelope function without the helical phase and propagates without modifications due to diffraction or interaction with the plasma.
The assumption that the BG pulse propagates while maintaining a constant spatial and temporal profile is only valid for a certain propagation distance. Therefore, the quasi-3-D FBPIC code, which uses a cylindrical geometry with azimuthal modal decomposition to describe fully the spatial-temporal evolution of the laser beam, was further used to simulate the evolution of the BG pulse and the influence of that evolution on particle acceleration. For the near-cylindrical geometry, only several azimuthal modes are sufficient for beam simulation, making the quasi-3-D code much faster than the standard 3-D PIC code. The performed test simulation results show that including 3 to 5 azimuthal modes are sufficient to model the first- and second-order BG beams with a spiral phase.
The simulations were performed for various amplitudes and durations of the Gaussian and BG pulses, both pulses together, separately for Gaussian and separately for BG pulses. Both pulses had a Gaussian temporal envelope. The size of the coordinate window moving at the speed of light c, r × z = 180 × 60 μm2, was chosen such that in the beam propagation direction (z-axis), it covered both laser pulses and at least two periods of the plasma wave, and along the orthogonal r-coordinate, it was 20/25 times wider than the width of the first ring of the doughnut BG beam. Open-type boundary conditions at the edges of the coordinate window were used to avoid artificial reflection. The number of nodes in the coordinate grid was 600 × 1200. The number of macroparticles per cell for the Gaussian and the first-order BG beams was (3,3,4), and the number of azimuthal modes was m = 3. The number of macroparticles for the second-order Bessel beams was (4,4,5) and the number of azimuthal modes m = 5. The number of macroparticles per cell in Wake-T simulations was 5. The width of the Gaussian envelope of the BG beam was 50 times the width of the BG first ring. To avoid interference of Gaussian and BG laser pulses, polarisations of the pulses were set orthogonal. The initial random distribution of particle coordinates and momentum in an injected electron bunch was Gaussian, the transverse and longitudinal RMS length was (1 μm, 1 μm), the charge 1 pC, initial energy 10 MeV, relative energy spread 5 % and the number of bunch macro-particles 103.
The Wake-T code was used to simulate the plasma structures formed by the BG beam and the Gaussian pulse guiding properties in the BG plasma wake. The FBPIC code was used to model the electron bunch acceleration by the Gaussian pulse and Gaussian pulse guided in the BG plasma wake.
Laser beam/pulse configurations used in the research were:
(1) Gaussian beam (G);
(2) Bessel–Gauss beam (BG) – doughnut-shaped, first- or second-order optical vortex;
(3) The first-order Bessel–Gauss beam (pulse), followed by a Gauss pulse (G + B1G);
(4) The second-order Bessel–Gauss beam (pulse), followed by a Gauss pulse (G + B2G).
The Gaussian or Bessel–Gauss beam or pulse in the article means transversal energy distribution in the laser pulse, while the temporal shape of the pulse is assumed to be Gaussian.
A 2-D cylindrical quasi-static PIC code Wake-T (Pousa et al. Reference Pousa, Aßmann and de la Ossa2019) was used to simulate the accelerating laser pulse propagation in a plasma channel generated by a Bessel–Gauss beam. The envelope of the normalised vector potential of the linear-polarised nth-order BG beam had the shape:

where

is the amplitude of the normalised vector potential, also called the laser strength parameter; ${J_n}$ is the nth-order Bessel function (n = 1, 2); ${w_b}$
 is the distance from the axis of the Bessel beam to the first ring, and for n = 1, the constant is rn = 1.84 and for n = 2, rn = 3; ${w_{0b}}$
 is the Gaussian envelope radius of the BG beam; $\eta = z - ct - {z_{cb}}$
 is the longitudinal coordinate in the moving coordinate window; ${z_{cb}}$
 is the pulse peak coordinate; ${\tau _b}$
 is the pulse duration of the BG beam; $r,\varphi$
 is the radial, azimuthal coordinate. In the Wake-T modelling of the BG beam propagation in plasma, it was assumed that there is no dependency on the azimuthal coordinate, and the envelope of the vector potential is preserved.
The accelerating pulse envelope of the normalised vector potential with the linear polarisation, orthogonal to the polarisation of the BG beam, has the Gaussian temporal and spatial shape:

Here, ${a_0}$ is the amplitude of the normalised vector potential, also called the laser strength parameter; ${w_0}$
 is the radius of the beam; $\eta = z - ct - {z_c}$
 is the longitudinal coordinate in the moving coordinate window; ${z_c}$
 is the pulse peak coordinates; and $\tau$
 is the pulse duration.
3. Accelerating beam guiding using a high-order Bessel–Gauss beam
3.1. Dynamic plasma channel for guiding the accelerating beam
The simulation was performed using the first- and second-order Bessel–Gauss (B1G and B2G) beams to understand the influence of the transverse laser beam intensity profile on plasma density distribution, and optical and electron beam guiding. Wake-T simulation results in figure 1 show that when a high-intensity $({a_{0b}} > 1)$ B1G beam propagates in a sub-critical concentration plasma, ring-shaped, high electron concentration zones are formed in the plasma, and they are moving together with the plasma wave.
Electron charge density distribution ρ(r,η) in a B1G created plasma wave (green-blue) and the first-order B1G pulse envelope (isolines). Dotted lines mark the positions of longitudinal and transverse cross-sections of charge density profiles shown in figures 2 and 3. Plasma electron concentration ${n_0} = 3 \times {10^{18}}\;\textrm{c}{\textrm{m}^{ - 3}}$ . B1G pulse parameters, a 0b = 1.5; τb = 25 fs; w 0b = 7.5 μm. The laser pulse propagates from the left to right side along the z-axis, centred at r = 0.

The transverse charge density profiles of the plasma are shown in figure 2. The difference in charge density on the z-axis and at the plasma ring highly depends on the laser beam strength parameter a 0. For higher intensity BG pulse, we would expect a more remarkable effect of the plasma ring on the accelerating laser pulse and electron bunch propagation.
Transverse profiles of electron charge density ρ(r) for (a) first-order B1G and (b) second-order B2G pulses and various values of the laser strength parameter a 0b. The green line in panel (a) is a parabolic approximation. Plasma electron concentration ${n_0} = 3 \times {10^{18}}\;\textrm{c}{\textrm{m}^{ - 3}}$ . BG pulse parameters, τb = 25 fs; w 0b = 7.5 μm for B1G and w 0b = 11 μm for B2G.

The transverse charge density distribution, presented in figure 2, shows that the charge density profile for the first-order Bessel–Gauss beam (B1G) near the beam propagation axis at a selected point on the z-axis is close to parabolic (figure 2a). The whole structure moves at the laser group velocity. Therefore, we can expect that the ring-shaped electron concentration distribution moving with the plasma wave will act as a plasma channel (Leemans et al. Reference Leemans, Gonsalves, Mao, Nakamura, Benedetti, Schroeder, Tóth, Daniels, Mittelberger and Bulanov2014; Gonsalves et al. Reference Gonsalves, Nakamura, Daniels, Benedetti, Pieronek, De Raadt, Steinke, Bin, Bulanov and Van Tilborg2019) for guiding the accelerating laser pulse, maintaining its high peak intensity and accelerating injected electron bunch. The transverse profile of the plasma distribution produced by the second-order Bessel–Gauss beam (B2G) differs significantly from parabolic (figure 2b). However, even with that plasma density profile, we observe a guiding effect (figure 6b). If the laser strength parameter ${a_{0b}}$ increases from 1 to 1.5, the maximum negative charge density in the ring increases from 3 to more than 7 times relative to the initial plasma density, facilitating better waveguiding properties of the ring-shaped plasma structure.
This waveguide exists only for a limited distance along the beam propagation direction and we performed a detailed simulation of the guiding effect of the plasma electrons ring on the Gaussian laser pulse. The longitudinal charge density profiles of figure 3, along the dotted line shown in figure 1, show that the axial length of the annular high electron concentration zone is approximately 6 μm, which decreases slightly with the increasing ${a_{0b}}$ parameter of the B1G beam.
Longitudinal profiles of the electron charge density ρ(η) for various laser strength parameter values a 0b of the B1G pulse (solid lines) and normalised envelopes of the accelerating Gaussian (green) and B1G pulses (yellow) (dotted lines). Plasma electron concentration ${n_0} = 3 \times {10^{18}}\;\textrm{c}{\textrm{m}^{ - 3}}$ . Gaussian pulse duration τ = 10 fs. B1G pulse parameters, τb = 25 fs; w 0b = 7.5 μm.

To ensure the waveguiding effect of the plasma channel over the entire length of the accelerating laser pulse (green dotted line in figure 3), the accelerating pulse should fit inside the high-concentration electron ring (dip). Its spatial spread along the propagation direction should be short enough to avoid diffraction losses of energy on the tails of the pulse. In addition, as the group velocity of the BG pulse differs from the accelerating Gaussian pulse, the spatial duration of the accelerating pulse should be less than the axial length of the electron ring. Therefore, a 10 fs long Gaussian pulse was used to drive the acceleration, while the guiding BG pulse was selected to be 25 fs long. Technically that could be implemented by transmitting part of the Gaussian beam with a pulse duration of 10 fs through a transparent phase mask, which not only transforms the beam to Bessel–Gauss, but also extends its duration due to dispersion in bulk.
The Wake-T simulation results also showed that the maximum density of the negative charge in the electron ring depends on the BG pulse duration and the initial plasma electron concentration (figure 4).
Dependence of the difference of maximum charge density ρ max and initial charge density ρ 0 in the ring-shaped electron plasma wave created by the B1G laser pulse on its duration for two different initial plasma electron concentrations, ${n_0} = 1 \times {10^{18}}\;\textrm{c}{\textrm{m}^{ - 3}}$ ; ${n_0} = 3 \times {10^{18}}\;\textrm{c}{\textrm{m}^{ - 3}}$
 . B1G pulse parameters, a 0b = 1.5; τb = 25 fs; w 0b = 7.5 μm.

With decreasing plasma concentration, the maximum charge density value in the ring ‘waveguide cladding’ is reached for longer BG pulse durations. For a 0b = 1.5, the optimal pulse duration of the BG beam forming the parabolic guiding channel increases from 25 fs to 55 fs, decreasing the initial plasma concentration from 3 × 1018 cm−3 to ${n_0} = 1 \times {10^{18}}\;\textrm{c}{\textrm{m}^{ - 3}}$ . A particularly strong dependence of the induced charge density on the BG pulse duration is observed for lower plasma concentrations. However, to maintain the lower pulse energy required to reach a 0b = 1.5, a 25 fs pulse duration for the guiding BG pulses in further simulations was selected.
3.2. Guiding the accelerating Gaussian beam by the plasma ring
Simulating the accelerating pulse propagation in the plasma perturbed by the BG pulse, the initial value of the pulse peak coordinate ${z_c}$ was adjusted to the first dip in the longitudinal charge density profile, corresponding to the high-concentration electron plasma ring (figure 2), and the spatial pulse duration was selected to equal to $c\tau = 3\;\mathrm{\mu }\textrm{m}$
 to fit within the dip in the charge density profile (figure 5).
Electron charge density distribution ρ(r,η) in the plasma wave (green-blue) and the envelopes (isolines) of the accelerating Gaussian pulse and pulses of (a) B1G and (b) B2G beams. Parameters of the accelerating Gaussian beam, a 0 = 2.0; τ = 10 fs; w 0 = 7 μm; and BG beam, a 0b = 1.5; τb = 25 fs. The waist of B1G is w 0b = 7.5 μm in panel (a) and the waist of B2G is w 0b = 11 μm in panel (b).

The simulation results show that the guiding effect on the propagation of the accelerating pulse in the BG pulse plasma wake is evident as the central part of the accelerating beam maintains an almost constant diameter at a distance of ten and more times the Rayleigh length of the beam$\; {z_R} = \mathrm{\pi }w_0^2/\lambda$ (figure 6).
Transverse profiles a(r) of the accelerating beam amplitude at the pulse peak, guided by the (a) first-order B1G and (b) second-order B2G beam at various propagation distances in plasma (z = 0, 1, 2, 3 mm). Parameters of the accelerating Gaussian beam, a 0 = 2.0; τ = 10 fs; w 0 = 7 μm; and BG beam, a 0b = 1.5; τb = 25 fs. The waist of B1G is w 0b = 7.5 μm and the waist of B2G is w 0b = 11 μm.

However, the maximum amplitude of the accelerating beam decreases with the propagation distance due to the leak of laser energy through the ‘soft waveguide cladding’ and the difference in the group velocity of the accelerating pulse from the group velocity of the BG pulse. At the initial propagation distance (<0.4 mm), the guiding profile of the moving plasma waveguide is formed, which depends on the ratio of the initial radius of the accelerating beam to the radius of the doughnut BG beam. When the propagation distance exceeds ${\sim} 10{z_R}$ , the modulation of the temporal envelope of the pulse begins to become apparent. For the distance exceeding ${\sim} 20{z_R}$
 (~3.7 mm), the laser pulse is decomposed into several pulses separated in time, and the maximum laser intensity falls significantly. Therefore, we have a limited acceleration distance less than 3 mm.
4. Electron acceleration using a higher-order Bessel–Gauss beam
Based on the initial simulation results of 2-D quasi-static PIC code Wake-T, the more advanced FBPIC code was used to model laser wakefield acceleration of electrons using higher-order Bessel–Gauss beams. B1G and B2G cases were modelled. As a probe, a Gaussian electron bunch with a charge of 1 pC, a standard deviation of σr,z = 1 μm in longitudinal and transversal direction, a relative electron energy spread of 5 %, and initial energy of 10 MeV was injected at the position of the maximum of the longitudinal electric field Ez of the plasma wave. The selected parameters of the injected charge allow for minimising the distortions of the plasma wakefield and investigating the beam guiding effects. In the experiment, the acceleration can be controlled by changing the position and duration of the injection (Albert & Thomas Reference Albert and Thomas2016; Albert et al. Reference Albert, Couprie, Debus, Downer, Faure, Flacco, Gizzi, Grismayer, Huebl and Joshi2021). The duration of the accelerating Gaussian laser pulse of τ = 10 fs (the spatial duration equal to $c\tau = 3\;\mathrm{\mu }\textrm{m}$ ) was chosen to fit the width of the plasma structures created by the guiding Bessel–Gauss beam (figure 3). The Gaussian beam radius of w 0 = 7 μm was matched to the radius of the first ring of wb = 7.5 μm for the B1G beam, and wb = 11 μm for the B2G beam. The laser strength parameter of a 0b = 1.5 was used based on the Wake-T simulation results (figures 1–4). The duration of the guiding Bessel–Gauss beam of τb = 25 fs and the initial concentration of electrons in plasma ${n_0} = 3 \times {10^{18}}\;\textrm{c}{\textrm{m}^{ - 3}}$
 were selected based on the maximal charge density in the plasma ring excited by the BG beam (figure 4). The maximum acceleration distance in plasma was z = 3 mm, and the divergence of the electron bunch θE was defined as an average of θEx,y = arctan(ux,y/uz) in the x and y directions, where ux, uy and uz are normalised electron momenta in the directions of x, y and z.
The results of the FBPIC simulation for the Gaussian (G), Gaussian combined with B1G (G + B1G) and Gaussian combined with B2G (G + B2G) configurations are shown in figure 7. The highest energy of accelerated electrons with a moderate energy spread and electron-beam divergence were obtained using a Gaussian beam with the laser strength parameter of a 0 = 5.0, guided by the B2G beam with a 0b = 1.5 (G + B2G configuration). For that laser strength parameter, the maximum energy of accelerated electrons at z = 3 mm reached 332 MeV (figure 7a). A saturation in the energy ramp at the 2.3 mm acceleration distance was observed. The energy spread for this configuration was in the range of 20–30 % (figure 7b) and the minimum divergence was 27 mrad. (figure 7c). The energy spread stabilised after 0.5 mm of acceleration and divergence was improved with the distance.
Dependence of the (a) energy of accelerated electrons, (b) energy spread σEn, (c) divergence θE and (d) accelerating pulse amplitude a max on the acceleration distance for Gaussian (G), Gaussian and B1G (G + B1G), and Gaussian and B2G (G + B2G), and laser beams. Parameters of the accelerating Gaussian beam, a 0 = 5.0 (for G and G + B2G); a 0 = 1.5 (for G + B1G); τ = 10 fs; w 0 = 7 μm; and BG beam, a 0b = 1.5; τb = 25 fs. The waist of B1G is w 0b = 7.5 μm and the waist of B2G is w 0b = 11 μm.

Application only of the Gaussian beam with the same strength parameter a 0 = 5.0 was more efficient in LWFA only at short acceleration distances of approximately 0.6 mm, permitting to achieve the electron energy of only 127 MeV, 2.6 times lower than in the G + B2G configuration. However, the substantial divergence of the focused Gaussian beam after the waist led to a reduction of intensity (a 0). The guided Gaussian beam in the G + B2G configuration preserved its strength parameter over a longer distance of approximately 2 mm (figure 7d).
Guiding the Gaussian beam by the first-order Bessel-Gauss beam (G + B1G) was inefficient because of the interference of the axial longitudinal electric field of the Gaussian and B1G beam (figure 7a–c).
For all values of the parameter a 0 presented in figure 7, the efficient acceleration takes place up to a distance of z ~ 2–3 mm. For longer distances, the energy growth slows down significantly or stops growing. Because of the nonlinear phase modulation of the accelerating pulse (nonlinear chirp), the laser beam splits into several beamlets and the amplitude of the central accelerating peak is reduced significantly.
In figures 8–11 and table 1, the results of the FBPIC LWFA simulation and characteristics of the accelerated 1 pC Gaussian electron bunch at the distance of 2 mm, using the Gaussian beam and the Gaussian beam guided by the B2G beam, are shown. The laser strength parameters and pulse durations of the beams are also presented in table 1.
Characteristics of the accelerated 1 pC electron bunch using Gaussian and Bessel–Gauss B2G beams in plasma with a concentration of 3 × 1018 cm−3 at the distance of 2 mm.

The intensity of the Gaussian beam and corresponding plasma wake (GV m−1) fall down rapidly with the propagation distance due to strong diffraction of the Gaussian beam and a short Rayleigh length for a tight, focused Gaussian beam (figure 8a–c). The waist radius of the laser beam increases from 7 μm to 50 μm for a 0 = 1.9 and to 38 μm for a 0 = 5.0 (figure 9a,c). The diffraction is opposed by nonlinear self-guiding intensive laser beams. With increasing the intensity of the Gaussian beam from a 0 = 1.9 to a 0 = 5.0, the self-guiding becomes dominant.
Dependence of the longitudinal plasma wake electric field Ez (solid line) and the electric field of laser beam envelope (dotted line) for acceleration distances z = 0.25 mm, 0.5 mm, 1 mm, 2 mm of the Gaussian beam with the laser strength parameter (a) a 0 = 1.9, (b) a 0 = 3.0, (c) a 0 = 5.0 and (d) the Gaussian beam with a 0 = 5.0 guided by the B2G beam with a 0 = 1.5 (G + B2G).

Distribution of plasma concentration (colour map) and longitudinal plasma wake electric field Ez (line) formed along a beam axis by the Gaussian beam with the laser strength parameter (a,b) a 0 = 1.9 and (c,d) a 0 = 5.0. Isolines and yellow oscillating lines represent the location and intensity of the electrical field of the laser pulse. The violet cloud is the electron bunch injected behind the laser pulse.
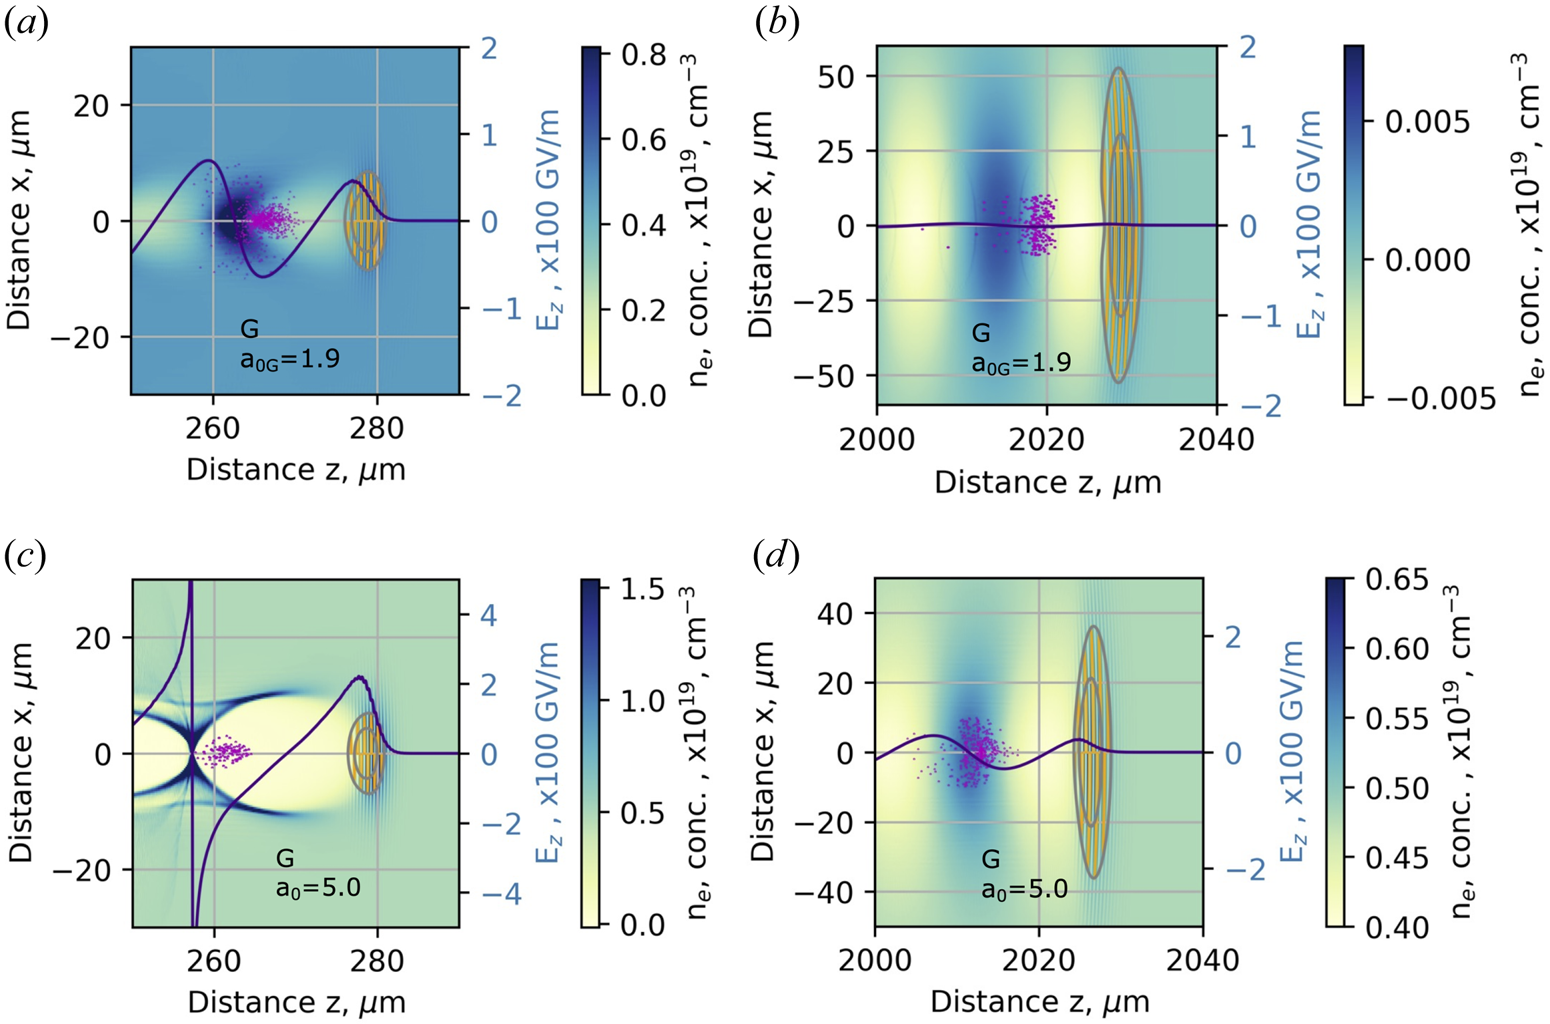
The initial value of the laser strength parameter a 0 affects the strength of the longitudinal electrical field Ez, responsible for the acceleration of electrons by the wake. By increasing the acceleration distance from 0.25 mm to 0.5 mm for a 0 = 1.9, the electric field of the laser beam envelope drops from 5.0 TV m−1 to 3.0 TV m−1 and to 0.9 TV m−1 at a distance of 2 mm. The longitudinal electric field of the plasma wake drops from 63 GV m−1 to 25 GV m−1 and to 1 GV m−1 at distances of 0.25 mm, 0.5 mm and 2 mm, respectively (figures 8a and 9a,b). The weighted mean energy of the accelerated electron bunch reaches 28 ± 7 MeV and the divergence θE = 41 mrad (table 1).
At the distances from 0.25 mm to 0.5 mm for a 0 = 3.0, the electric field of the laser beam envelope drops from 8.5 TV m−1 to 5.5 TV m−1 and to 1.5 TV m−1 at 2 mm (figure 8b). The longitudinal electric field of the plasma wake drops from 140 GV m−1 to 70 GV m−1 and to 1.5 GV m−1 at the distances of 0.25 mm, 0.5 mm and 2 mm, respectively. The electrons are accelerated up to 53 ± 13 MeV and the divergence θE = 37 mrad (table 1).
The wake is shifted back relative to the accelerating laser pulse in the case of a more intense laser pulse, indicating the increase in plasma bubble size. The radius of the plasma bubble increases proportionally to ${({a_0})^{1/2}}$ allowing a higher acceleration distance of electrons. At the distances from 0.25 mm to 0.5 mm for a 0 = 5.0, the electric field of the laser beam envelope drops from 17 TV m−1 to 11 TV m−1 and to 3 TV m−1 at 2 mm (figures 8c and 9c,d). The longitudinal electric field of the plasma wake drops from 800 GV m−1 to 180 GV m−1 and to 25 GV m−1 at distances of 0.25 mm, 0.5 mm and 2 mm, respectively. At the initial acceleration distance from 0.25 mm to 0.5 mm of the nonlinear expansion of the bubble, the minimum of the longitudinal electric field shifts 2.1 times further from the accelerating beam position increasing the dephasing distance of accelerated electrons relative to the a 0 = 1.9 case. The electrons are accelerated up to 125 ± 23 MeV, and the divergence θE = 33 mrad (figure 11a and table 1).
For the G + B2G configuration, relative to the case in figure 8(c), the plasma wake preserves a high accelerating field Ez at the 2.0 mm distance (figure 8d). That is clear evidence of the positive guiding effect of the Gaussian beam by the plasma ring produced by the BG beam. The longitudinal electric field of the plasma wake in the central part of the B2G beam is low, of the order of 10 GV m−1, and is formed by the guided Gaussian beam. The electric field of the Gaussian beam envelope remains almost constant at a distance from 0.25 mm to 0.5 mm in the range of 15 TV m−1 and drops to 9 TV m−1 at 2 mm (figures 8d and 10a,b). The longitudinal electric field of the plasma wake is at the level of 230–270 GV m−1 at a distance from 0.25 mm to 0.5 mm and drops to 160 GV m−1 at 2 mm. Compared to the Gaussian beam with a 0 = 5.0, the absolute values of the laser intensity and longitudinal electric field of the laser beam at the distance of 0.25 mm are almost the same. However, the electric fields of the laser beam and plasma wake at 2 mm are factors of 3.0 and 6.4 higher, respectively. The electrons are accelerated at a higher energy of 283 ± 83 MeV by a factor of 2.3 with the divergence θE = 19 mrad (figure 11b and table 1).
(a,b) Distribution of plasma concentration (colour map) and dependence of longitudinal plasma wake electric field Ez (line) formed behind the Gaussian beam with a 0 = 5.0 guided by the B2G beam with a 0 = 1.5. Isolines with yellow oscillating lines represent the location and intensity of the electrical field of the laser pulses. The violet cloud is the electron bunch injected behind the laser pulse.

Energy and divergence θy of electrons accelerated by (a) the Gaussian beam with a 0 = 5.0 and (b) the Gaussian beam with the laser strength parameter a 0 = 5.0, guided by the B2G beam with a 0 = 1.5 at the acceleration distance of 2 mm.

A Gaussian pulse located behind the B2G pulse within a ring of high electron concentration (waveguide) (figure 10a,b) produces a wake with a strong longitudinal electrical field (line) able to accelerate an electron bunch (violet cloud) injected in front of the wake. In addition to electron acceleration, we see a concentration of the bunch closer to the beam propagation axis, which means a reduction in electron bunch divergence. High-energy electron bunches with a moderate energy spread and low divergence could be produced by combining the guiding the Gaussian accelerating pulse with the doughnut-shaped second-order Bessel–Gauss pulse.
5. Conclusions
The Gaussian beam at the acceleration distance of 2 mm in the plasma concentration of ${n_0} = 3 \times {10^{18}}\;\textrm{c}{\textrm{m}^{ - 3}}$ diffracts substantially, and the waist radius of the laser beam increases from 7 μm to 50 μm for a 0 = 1.9 and to 38 μm for a 0 = 5.0. The guiding of the Gaussian beam with a 0 = 5.0 by the B2G beam with a 0 = 1.5 increases the propagation distance. The electric field of the guided laser beam at the propagation distance of 2 mm is a factor of 3.0 higher relative to the Gaussian beam with a 0 = 5.0. The weighted average energy of electrons is a factor of 2.3 higher, and the divergence of electron bunch θE is a factor of 1.7 lower compared to the case of the Gaussian beam of the same intensity. At the acceleration distance of 2 mm, the maximum electron energy reaches 283 ± 83 MeV with the divergence θE = 19 mrad. Selected acceleration configurations are promising to implement towards VHEE applications. The proposed laser beam guiding technique helps to increase the energy of accelerated electrons enabling the dose deposition at deep-seated tumours.
Acknowledgements
Editor Victor Malka thanks the referees for their advice in evaluating this article.
Declaration of interest
The authors report no conflict of interest.
Funding
The research leading to these results was funded by the Research Council of Lithuania under grant agreement No. S-MIP-21-3.
Author's contributions
V. Girdauskas performed the physical analysis, defined the methodology, carried out the Wake-T and FBPIC simulation, and wrote the original draft. V. Tomkus carried out the physical analysis and FBPIC simulation, and wrote the original draft. M. Abedi-Varaki worked on the physical analysis and FBPIC simulation, and wrote the original draft. G. Raciukaitis defined the methodology, supervised the research, conceived and defined the aims of the investigation, reviewed and edited the manuscript. All authors reviewed the obtained results and commented on the paper.
Ethics approval
This paper has not been submitted for publication elsewhere. We further certify that proper citations to the previously reported work have been given, and no data/tables/figures have been quoted verbatim from other publications without giving due acknowledgement and without the permission of the author(s).
Data availability
The authors confirm that all of the data and codes used in this study are available from the corresponding author upon reasonable request.


 Open access