





Introduction
The emergence of small, unmanned aircraft systems (UAS) with improved autopilot capabilities has opened new avenues to deploy miniaturized microwave radar instruments for surface and subsurface mapping, including that of layered dielectric media such as snow, firn, and ice [Reference Grathwohl, Stelzig, Kanz, Fenske, Benedikter, Knill, Ullmann, Hajnsek, Moreira, Krieger, Vossiek and Waldschmidt1]. Snow masses are a critical natural resource for water storage and a relevant component of the Earth system. Data retrieved with radar-equipped UAS complement the information acquired with radars onboard crewed aircraft as well as satellite platforms. Although small UAS offer lower endurance compared to their manned counterparts, they are less expensive to operate and can fly lower and slower, which may be exploited to reduce the radar’s illuminating footprint (thereby providing finer spatial coverage) and potentially achieve higher sensitivity by extending the integration time.
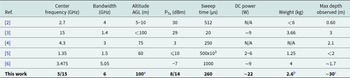
Recent demonstrations of UAS-borne down-looking ultra-wideband microwave systems documented in the open literature attest their utility to retrieve snow thickness information [Reference Stelzig, Benedikter, Kleinlein, Ni. Haberger, Lomakin, Braun, Krieger and Vossiek2–Reference Jenssen, Eckerstofer and Jacobsen6]. As shown in Table 1, these systems can support multi-GHz bandwidths with transmit power levels of less than 1 W while flying altitudes ranging from a few meters to up to ∼100 m and achieving penetration depths of up to a few meters into the snowpack. Although these systems are primarily intended to measure snow thickness, microwave radar systems may also be suitable for crop monitoring or tree-height measurements as shown in papers [Reference Piermattei, Hollaus, Milenković, Pfeifer, Quast, Chen, Hakala, Karjalainen, Hyyppä and Wagner7–Reference Gomez-Garcia, Rodriguez-Morales, Welch and Welch9].
Summary of recently developed UAS-borne downward-looking microwave radar systems for snow measurements

a Theoretically, it could support up to ∼480 m based on measured chirp frequency linearity.
b Includes LiPo battery as power source and 3D printed antennas.
c Using the 2–8 GHz band.
To further advance our snow measurement capabilities, we recently developed a compact, frequency modulated continuous-wave (FM-CW) microwave radar demonstrator intended for nadir-looking operation onboard a C-3 class UAS. The primary advantages of this system include its low cost, compactness, low power consumption, and reconfigurability to operate over either the 12–18 GHz band or the 2–8 GHz band [Reference Occhiogrosso, Taylor, Mendel, Leuschen, Rodriguez-Morales and Low-Cost10]. We implemented most of the radar test bed’s radio frequency (RF) frontend with a series of inexpensive modules fabricated on FR408-HR laminate substrate [Reference Occhiogrosso11]. We tested the system in the laboratory by exercising the two above bands and then in Antarctica for measurements of snow pileup by employing the 2–8 GHz band on a sled-based setup. The radar electronics used in the ground system weighed 2.8 kg, including the RF frontend, digital backend, and antennas, and consumed ∼46 W of DC power. We subsequently integrated the radar demonstrator into an Aurelia X6 Pro UAS, which has flight range of 15 km and a payload limit of 5 kg and conducted a series of local test flights at nominal altitudes between 50 and 75 m above ground level (AGL). In its UAS-borne configuration, this experimental instrument weighed 2.6 kg (including RF frontend, digital backend, 3D printed antennas, and LiPo battery) and its electronics consumed ∼22 W of DC power.
In paper [Reference Occhiogrosso, Taylor, Mendel, Leuschen, Rodriguez-Morales and Low-Cost10], we provided a high-level overview of the system and presented laboratory test results for the waveform generator showing an rms chirp nonlinearity of ∼13 ppm, which can theoretically support altitudes up to 480 m AGL. We also presented some initial results from the sled-based setup in Antarctica as well as local airborne tests onboard the Aurelia X6 Pro. Here, we expand [Reference Occhiogrosso, Taylor, Mendel, Leuschen, Rodriguez-Morales and Low-Cost10] by providing supplementary implementation details on the RF/microwave frontend, antennas, and their integration onto the UAS and by presenting data collected under the 12–18 GHz modality. Lastly, and to further validate the performance of the radar demonstrator, we also present a field dataset collected over the Northeast Greenland Ice Sheet, showing that the radar test bed successfully mapped seasonal snow accumulation to an estimated depth of up to at least ∼30 m in the “dry snow” zone near 75°38ʹ N, 36°00ʹ W.
The remaining of the paper is organized as follows. The “System development and laboratory testing” section offers design details and laboratory testing results of the various radar sub-components, beyond what was presented in paper [Reference Occhiogrosso, Taylor, Mendel, Leuschen, Rodriguez-Morales and Low-Cost10]. The “Platform integration” section describes the integration onto the two test platforms used in this work. The “Field tests” section provides several examples of radar images obtained from field data, along with discussions. Lastly, we summarize the paper in the “Conclusions” section.
System development and laboratory testing
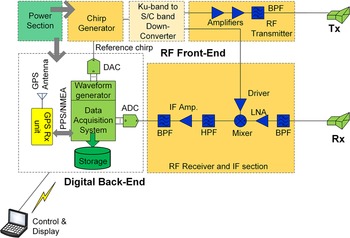
As discussed in paper [Reference Occhiogrosso, Taylor, Mendel, Leuschen, Rodriguez-Morales and Low-Cost10], the radar demonstrator follows an FM-CW architecture. Its main constituent blocks are the RF frontend, a digital backend, a power section, and a set of antennas (Fig. 1).
Simplified block diagram of the RF frontend and radar demonstrator [Reference Occhiogrosso, Taylor, Mendel, Leuschen, Rodriguez-Morales and Low-Cost10]. (Copyright European Microwave Association, EuMA).

RF frontend
The RF frontend is composed of a microwave chirp generator, an RF transmitter, and an RF/IF (intermediate frequency) receiver. The total power consumption of this section is ∼16 W.
Microwave chirp generator
The microwave linear chirp generator in the radar test bed uses a type-2 phase-locked loop (PLL) architecture as in reference [Reference Gomez-Garcia12], except that we integrated multiple surface-mount components into a single module rather than using discrete connectorized components and evaluation boards. The circuit employs a wideband voltage-controlled oscillator (VCO) chip followed by a frequency pre-scaler with a factor of 56, and a phase-detector, which compares the phase of the frequency-scaled output signal with a digitally generated reference in the 214.28–321.42 MHz range. The output of the phase detector feeds a second-order loop filter whose output drives the voltage control port of the VCO to produce a microwave signal in the 12–18 GHz range, which is thus phase-locked to the digital reference. We incorporated amplification, gain equalization, and filtering on the same module to condition the chirp signal to a level up greater than 0 dBm while keeping harmonics low. We implemented our chirp generator circuit using a multilayer stack up from a commercial manufacturer based on FR408-HR substrate [13, Reference Aroor and Henderson14], with a top signal layer thickness of 6.7 mils and dielectric constant of 3.69. This resulted in a very compact solution compatible with UAS operation with frequency linearity performance nearly as good as to that of paper [Reference Rodriguez-Morales, Li, Alvestegui, Shang, Arnold, Leuschen, Larsen, Shepherd, Hvidegaard and Forsberg15].
To validate the performance of this module, we conducted the following tests. First, we measured the output signal using a spectrum analyzer for two different cases: (i) when the input reference consisted of a sequence of discrete tones in the 214.28−321.42 MHz range; (ii) when the input signal was a linear sweep with a 0.1 Tukey envelope, a duration of 260 µs, and a pulse repetition interval of 300 µs. The former was done to measure the output power level and establish lock under static conditions. The latter was done to verify operation under sub-millisecond sweeping conditions, as required for a fast-moving platform. Results from these tests are shown in Fig. 2. In Fig. 2(a), the individually recorded outputs for the set of discrete reference tones are indicated with different colors. From this plot, we observe an output power level of 12.4 and 3.4 dBm for the start and stop tones at 12 and 18 GHz, respectively; and spur levels lower than −38 dBc. As for the swept reference test case, the measured output power profile is shown in Fig. 2(b) and plotted alongside the response obtained from EM/circuit co-simulations of the RF path (after normalizing to the lowest measured power level). The co-simulations were performed using Keysight Momentum and Advanced Design System (ADS) and include the S-parameters provided by the manufacturer for the various two-port components as well as the nominal output power of the VCO. We note that our simulations showed a generally good agreement in terms of the expected frequency response but presented an offset in terms of absolute power levels; and predicted a lower output in the lower part of the operating band. Based on multiple circuit boards fabricated and measured, we attribute the differences to variations in the actual VCO output power with respect to the typical values taken from the datasheet and used in our circuit model.
Measured signal at the output of the chirp generator for discrete reference tones (a) and swept reference signal (b). The dotted blue line corresponds to the EM/circuit co-simulation results after normalization. Frequency nonlinearity profile derived from the captured pulsed output waveform after applying a moving averaging (c).
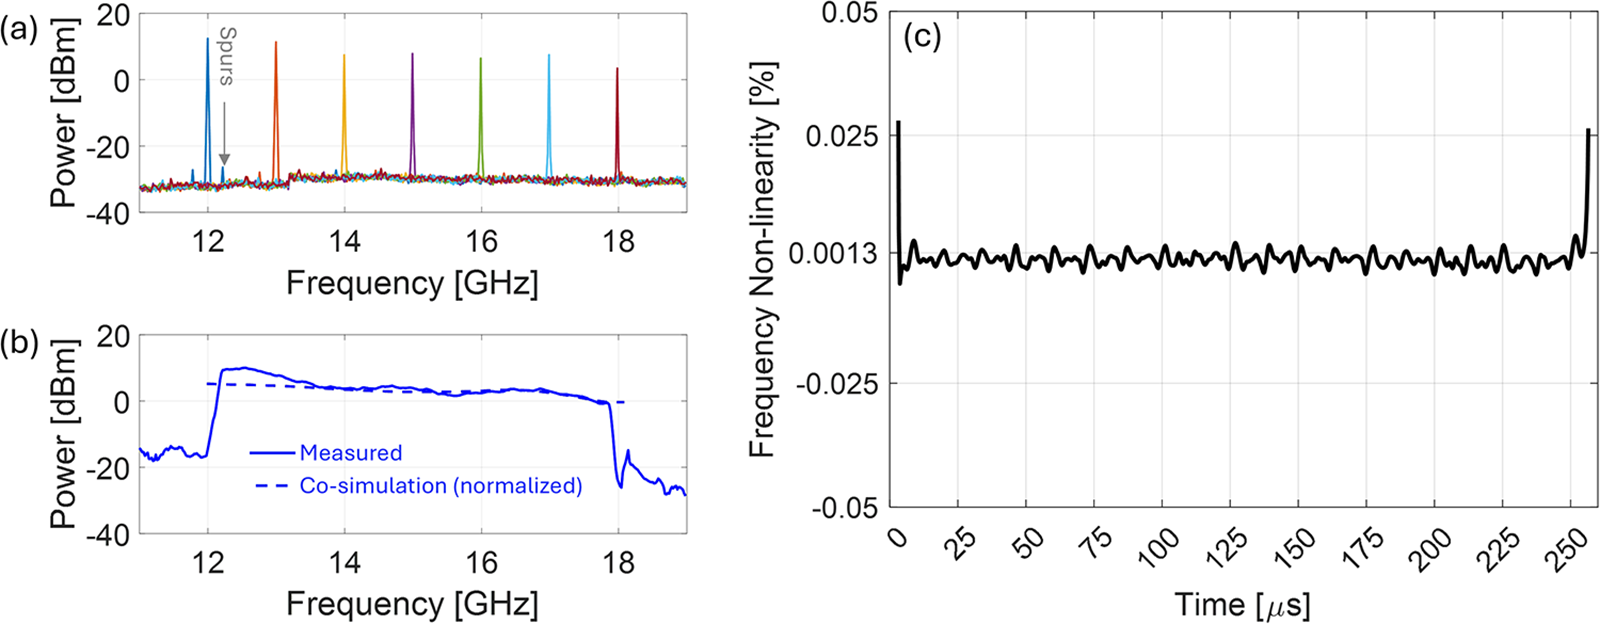
Next, we captured the chirp generator’s output signal under swept conditions using a 50 GSa/s digitizing scope and obtained the nonlinearity profile using the technique described in paper [Reference Rodriguez-Morales, Leuschen, Carabajal, Paden, Wolf, Garrison and McDaniel16]. The frequency nonlinearity profile across the duration of the pulse is plotted in Fig. 2(c), which exhibits an rms value of 0.0013% or 13 ppm considering a moving average from 3.3 to 255 µs. The rapid increase at the start and end of the sweep is expected and is caused by the decreasing amplitude of the reference signal and the increased group delay in the built-in microwave filter response at the band edges.
RF transmitter
To reduce the power variation as a function of frequency for the 12–18 GHz chirp generator output, we used a limiting amplifier followed by a highly selective band-pass filter (to reduce harmonic content above 24 GHz). We used the output of the limiter amplifier directly as the transmit signal for this band.
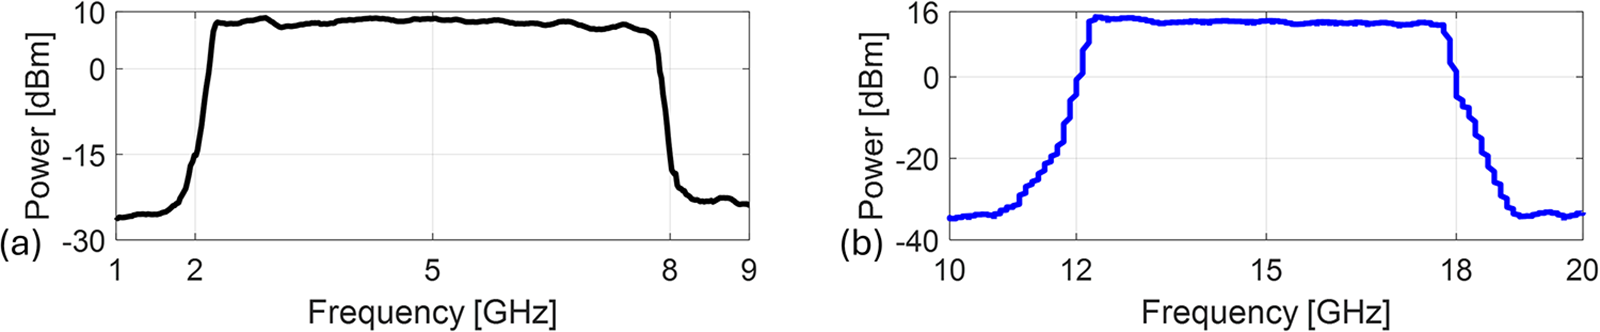
For operation in the 2–8 GHz range, the 12–18 GHz chirp is mixed with a 10 GHz oscillator locked to a 100-MHz fixed reference signal (Ku-band to S/C band down converter block in Fig. 1). We determined that this configuration produces a negligible system phase noise degradation if the stability of the fixed reference is significantly higher than that of the base oscillator in the radar’s digital system. The output of the down converter is further amplified and band-pass filtered. The resulting 2–8 GHz signal is used as the transmit signal for this band. The maximum power at the output of the transmitter is ∼8 dBm for the 2–8 GHz band and ∼14 dBm for the 12–18 GHz band (Fig. 3).
Measured transmitter power output versus frequency for the 2–8 GHz (a) and 12–18 GHz (b) modalities.

RF/IF receiver
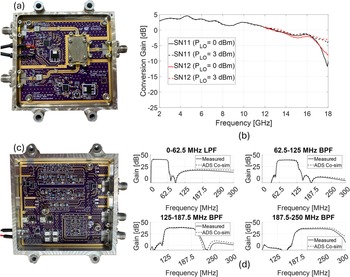
The RF receiver modules are used for de-chirping of the received signal. They are based on the design described in papers [Reference Occhiogrosso11, Reference Rodriguez-Morales, Li, Gomez-Garcia, Shang, Arnold, Leuschen, Larsen, Shepherd, Hvidegaard and Forsberg18], which operates in the 2–18 GHz range and can be used for that full band or any sub-band within that range. We mix the receive signal with a replica of the transmit signal and the resulting IF output is high-pass filtered, further amplified and band-pass filtered before it is captured by the digital backend. The IF module for the airborne configuration supports up to four distinct bands with 62.5 MHz of bandwidth. With a pulse duration of 260 µs and bandwidth of 6 GHz, each band can support discrete altitude windows of ∼400 m AGL. For operation on the UAS, we used an absorptive high-pass filter with a cutoff frequency of ∼5 MHz, which sets the lowest altitude limit to 32.5 m above the ground. We fixed the switchable bank to the first 62.5-MHz low-pass filter. For operation in the sled-based setup, the IF section was simplified to only include a broadband amplifier with a lower cutoff frequency (∼200 kHz) and a 50-MHz low-pass filter. Figure 4 shows photographs of the RF/IF receiver section and gain performance measured with a network analyzer for various test conditions and comparisons with EM/circuit co-simulations performed with Keysight ADS for the IF section. The conversion gain of the RF receiver was measured using an offset frequency mode for a fixed IF frequency of 50 MHz.
(a) Photograph of the RF receiver module and (b) measured conversion gain response for two different LO levels (0 and 3 dBm, respectively) and two distinct receive modules designated SN11 and SN12; (c) Photograph of the IF module and (d) measured/simulated gain responses for each of its four selectable bands.

Digital backend
As discussed in paper [Reference Occhiogrosso, Taylor, Mendel, Leuschen, Rodriguez-Morales and Low-Cost10], we used two different digital backends to implement our radar test bed. Both versions can generate the 214.28–321.42 MHz reference signal for the microwave chirp generator, and support synchronous data capture of the receiver IF output with onboard coherent averaging capabilities to reduce data recording rates (typically 300 MB/min). For the sled-based system in which power consumption was not as restricted, we used a commercially off-the-shelf (COTS) software defined radio unit equipped with a 2 Giga samples per second arbitrary waveform generator and a 200 Mega samples per second ADC. This configuration supports a sweep time of 180 µs, weighs ∼0.5 kg, and requires 30 W of DC power. This version of the digital backend is controlled by a console or graphical user interface running on a separate host computer. Data are recorded onto a solid-state drive on the host machine. For the UAS-borne configuration, we used a tailored solution based on the Red Pitaya SDRLAB 122.88-16 [19] with custom firmware controlling a COTS direct digital synthesizer chip. It supports a pulse duration of 260 µs, consumes ∼6 W DC, and weighs ∼0.2 kg without including a GNSS receiver for time tagging the data and 900 MHz communication links for remote control. This solution runs a stripped-down version of Linux and supports control commands via a console interface. Data are recorded onto an onboard micro-SD card.
Antennas
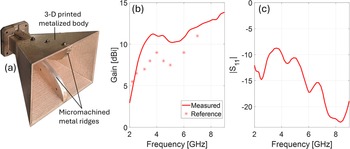
For the sled-based setup, we used a set of COTS horn antennas (Q-par-Steatite QWH-SL-2-18-S-SG-R), which weigh 370 g per element. For the UAS-based 2–8 GHz setup, we first fabricated a set of metalized 3D printed antennas based on the design in paper [Reference Majumdar, Baer, Chakraborty, Esselle and Heimlich17]. Our initial configuration was fabricated on polyethylene terephthalate glycol and metalized with MG Chemicals 843AR silver-coated-copper conductive spray paint. Although this approach furnished a light-weight solution (76.5 g per antenna), it presented challenges related to the reliability of the electrical contact between the center pin of the coaxial feed connector and the lower antenna ridge, particularly under vibration conditions. To address this drawback, we fabricated a revision with the ridges micromachined from a solid aluminum piece and then used the spray paint to make the electrical connection between the ridges and the metalized, additively manufactured horn. This resulted in a more rugged feed structure while preserving light weight characteristics (117.6 g per antenna). We measured the gain and input return loss of these antennas. The return loss was better than 8.5 dB across the 2–9 GHz range. The gain was ∼10 dBi or higher from 3 to 9 GHz and it dropped down to ∼3 dB at 2 GHz. Figure 5 shows a photo of one of the manufactured antennas alongside its measured characteristics. For comparison, we included the gain reported for the metalized plastic antenna in paper [Reference Majumdar, Baer, Chakraborty, Esselle and Heimlich17] showing that our metal ridge design improvement is not only more robust for this application but also exhibits generally higher gain (as much as 3 dB higher at ∼4 GHz). We note, however, that the antenna performance is impacted by the coverage and uniformity of the spray paint metallization, especially where the 3D printed part meets the metal pieces. For the UAS-based 12–18 GHz setup, we used a set of COTS horns (Pasternack PE9854-20), each with a nominal gain of 20 dBi and a weight of 185 g.
(a) Photograph of one of the fabricated 3D printed antennas with metalized body and micromachined metal ridges. (b) Measured gain response with reference values from paper [Reference Majumdar, Baer, Chakraborty, Esselle and Heimlich17] for the original metalized 3D printed design; and (c) measured reflection characteristics.

DC-power section
This section conditions the power from the primary source (e.g. 22 V LiPo battery for the UAS or 24 VDC power supply for the sled) and provides the various voltage rails needed for the operation of the radar test bed. To this end, we used a combination of COTS switching and linear regulators either on discrete small boards (sled-based setup) or integrated into three compact modules with overall efficiency of ∼68% (UAS-borne demonstrator).
System-level laboratory testing
After we tested all the radar modules individually, we evaluated the performance of the demonstrator at the system level by using a synthetic target composed of attenuators, cables, and an electro-optical transceiver connected to a fiber optic spool with 1.75 µs time delay [Reference Occhiogrosso, Taylor, Mendel, Leuschen, Rodriguez-Morales and Low-Cost10]. This allowed us to assess the system’s vertical resolution, loop sensitivity, and range sidelobe level in a controlled environment. The initial impulse responses measured for both bands with reduced transmit power are documented in paper [Reference Occhiogrosso, Taylor, Mendel, Leuschen, Rodriguez-Morales and Low-Cost10]. From these, we inferred a cm-scale range resolution within 1.5% of the theoretical 3.75 cm for the 12–18 GHz band and within 12% for the 2–8 GHz band. For the maximum transmit power levels supported in the final test bed configuration, we estimated a loop sensitivity of ∼149 dB for the 2–8 GHz mode and ∼154 dB for the 12–18 GHz setup.
Platform integration
Ground-based setup
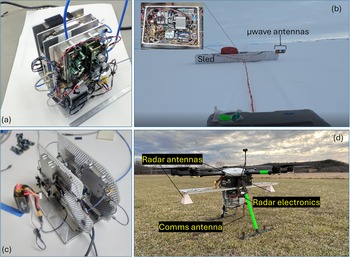
For the ground-based setup, the radar electronics were installed inside an existing radar chassis for a very high frequency (VHF) radar sounder for ice thickness measurements employed as a part of a different project [Reference Kaundinya, Taylor, Sarkar, Occhiogrosso, Mai, Hoffman, Christianson, Paden, Paden and Rodriguez-Morales20]. The antennas for the microwave radar were attached looking downward to a sled holding polarimetric VHF antennas, which was in turn towed by a snowmobile. We conducted test of opportunity measurements in Antarctica during the 2022/2023 and 2023/2024 Austral summer seasons. A photo of the radar electronics and sled setup are shown in Fig. 6(a) and 6(b), respectively.
Photographs of the radar electronics (a) and field setup (b) for the sled-based measurements. Photographs of the radar electronics (c) and UAS setup (d) for the airborne tests.

UAS-borne setup
We integrated the antennas and radar electronics (Fig. 6(c)) onto the Aurelia X6 Pro UAS as shown in Fig. 6(d). The antennas were attached on a light-weight mount made of thin, pocketed aluminum, which provided a separation of ∼1 m to maximize transmit/receive isolation. For the initial tests, we included 3 dB coaxial attenuators at the input port of each of the antennas to reduce reflections. For this configuration, the digital backend includes a 900 MHz communications link to send control commands and feedback to/from the digital backend and a GNSS receiver.
Field tests
We conducted various tests to confirm the performance of the radar test bed in various field operating scenarios. This section presents additional data samples and discussions from these tests.
Surface-based tests in Antarctica
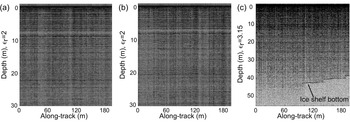
As discussed in paper [Reference Occhiogrosso, Taylor, Mendel, Leuschen, Rodriguez-Morales and Low-Cost10], the radar demonstrator collected data using the sled setup with the snowmobile moving at a speed between 4 and 8 m/s. Here, we provide additional data samples from these trials, as shown in Fig. 7. The data processing generally consists of the steps outlined in papers [Reference Panzer, Gomez-Garcia, Leuschen, Paden, Rodriguez-Morales, Patel, Markus, Holt and Gogineni21, Reference Li, Rodriguez-Morales, Leuschen, Paden and Arnold22], which include coherent noise reduction, fast Fourier transform applied to each time-domain record after Hanning windowing, and different forms of averaging. From these echograms we observed that the radar mapped snow/firn layers to a depth of ∼30 m over multiple ∼190-m sections using the 2–8 GHz band. We assumed a dielectric constant (εr) of 2.0 for calculating the depth in snow (Fig. 7(a) and 7(b)). At the end of the survey line, the radar also mapped the bottom of the ice shelf, which we estimate at a depth between 40 and 45 m considering a dielectric constant of ice of 3.15 (Fig. 7(c)).
Sample radar images obtained from sled-based tests on the Ross Ice Shelf in Antarctica.

Airborne tests onboard UAS (Kansas)
We conducted two initial rounds of flight tests at the Clinton Lake R/C Field in Lawrence, Kansas, with the radar operating in the 2–8 GHz range. For the first round, we operated with a transmit power of less than −5 dBm at nominal altitudes of 55 and 75 m AGL, respectively. The purpose of these tests was to verify the functionality of the complete setup at altitude. The signal-to-noise ratio (SNR) obtained for the strongest surface returns from grass-covered ground with reduced transmit power was ∼30–35 dB. Further, we observed a good correlation between the surface profiles shown in the echograms of Fig. 8(a) and 8(c) and the relative vehicle altitudes for each flight as obtained from its GNSS receiver log. The latter are shown in Fig. 8(b) and 8(d), respectively. “Coherent noise” from residual coupling between the transmitter and receiver was observed in these preliminary radar images and appears as horizontal stripes for ranges between 50 and 60 m. These artifacts in Fig. 8(a) become less prominent in Fig. 8(c) because the UAS flew higher. We subsequently suppressed the effects of this residual noise through digital filtering techniques, as will be shown below.
Sample results from the first round of local test flights for a nominal altitude of 50 m AGL: echogram (a) and UAS altitude from GNSS records (b); and altitude of 75 m AGL: echogram (c) and UAS altitude from GNSS records (d).

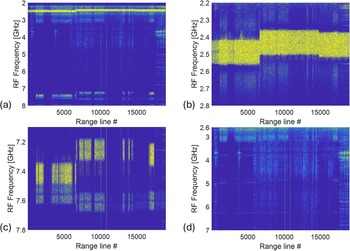
Next, we completed a second set of flight tests after increasing the transmit power to ∼4 dBm and the position update rate of the onboard GNSS receiver to 5 times per second instead of 1 Hz. The first flight plan of the set consisted of a series of linear ascents followed by short hovering periods over a large aluminum plate (dimensions 1.2 m × 1.2 m × 3 mm). We used the data from this flight to identify potential RF interference (RFI) sources, expected from operation in an urban environment. We thus identified two moderately strong interferers at ∼2.4 and 7.4 GHz, respectively. We tracked the former to the UAS communications link and nearby Wi-Fi transmissions while the latter was attributed to a local emitter in the test area. Figure 9 shows different spectrograms obtained from the received signal for full bandwidth, zoomed views to highlight the signatures of the strongest interferers with frequency hopping, and residual RFI from the urban operating environment after limiting the signal to the 2.6–7 GHz range. The latter results in a minimal degradation in radar sensitivity while still providing ultra-wide bandwidth and thus fine vertical resolution, as required for snow measurements.
Spectrograms of the received radar signal for various conditions: (a) full 2–8 GHz bandwidth; (b) zoomed view ∼2.4 GHz where the strongest RFI was identified; (c) zoomed view ∼7.5 GHz with the second strongest RFI; (d) signal sub-banded to 2.6–7 GHz.

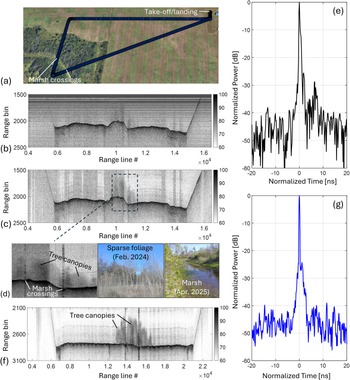
The second path within the second round of flights was designed to repeat the data collection over the metal plate and then fly over a treed area to assess the performance of the radar test bed on areas besides grass-covered ground (Fig. 10(a)). We produced the radar image in Fig. 10(c) after mitigating the coherent noise artifacts shown in Fig. 10(b) by subtracting the mean from 250 adjacent traces to each record. Through this basic noise removal process, the artifacts were sufficiently reduced to detect the top of tree canopies with very sparse leaves due to the end of the winter season (leaf density in the survey area varies seasonally, reaching its peak during the summer months). The flight path included two crossings over a marsh area, which appears as bright spots with a distinct far-range sidelobe pattern in the left inset of Fig. 10(d). A representative A-scope from one of these bright scatterers is shown in Fig. 10(e). In the spring of the following year, we repeated the same flight path with the radar configured for operation in the 12–18 GHz band. The corresponding echogram is presented in Fig. 10(f), which shows a more distinct response from the tree crowns. This is due to a combination of factors, including the higher antenna gain and transmit power available in that configuration, the higher leaf density observed in the springtime versus the winter, leaf water content, and differences in scattering patterns as a function of frequency [Reference Ulaby and Long23].
Trajectory (in the counterclockwise direction) for flight tests over grass-covered ground and trees/shrubs (a); 2.6–7 GHz radar echogram before (b); and after basic coherent noise removal (c). The left inset of (d) shows a zoomed view of the results obtained over the wooded area with sparse foliage (winter of 2024) which included two crossings over a marsh. The middle and right insets show photographs of the actual scene as seen from the ground; (e) is a radar return collected while crossing the marsh area. (f) 12–18 GHz radar echogram collected over the same area in the spring of 2025 with (g) showing the corresponding normalized response obtained over the marsh.

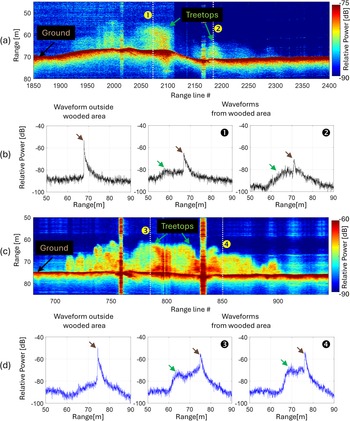
Figure 11 shows a close-up of the echograms highlighting the region near the wooded area (after incoherent averaging and contrast adjustment) and various waveforms collected outside of and within the treed region. The differences in waveform signatures in different areas and as a function of radar operating frequency are apparent. Moreover, the two waveforms in the right insets of Fig. 11(b) and 11(d) have profiles comparable to those reported in previous studies conducted with microwave radar over forested areas [Reference Piermattei, Hollaus, Milenković, Pfeifer, Quast, Chen, Hakala, Karjalainen, Hyyppä and Wagner7, Reference Li, Larsen, Rodriguez-Morales, Arnold, Leuschen, Paden, Shang and Gomez-Garcia8].
Zoomed view of the 2.6–7 GHz echogram over the woodland without vehicle’s altitude correction (a) and representative waveforms (b). Zoomed view of the 12–18 GHz echogram over the woodland without vehicle’s altitude correction (c) and representative waveforms (d). For (b) and (d), the left insets correspond to surface returns over grass-covered ground outside the forested section. The mid and right insets correspond to waveforms collected over the treed area at the locations marked as (1), (2) in the 2.6–7 GHz echogram and as (3), (4) in the 12–18 GHz image. The green arrows point to the response from the tree canopies. The brown arrows point to the return from the ground. Range is in meters assuming free space propagation.

Airborne tests onboard UAS (Greenland)
After completing local tests in Kansas, we successfully flight-tested the radar test bed onboard an Aurelia X6 Pro UAS near the East Greenland Ice-core Project (EastGRIP) drill site on the Northeast Greenland Ice Sheet. The instrument operated in the 2–8 GHz band with ∼4 dBm of power at the output of the transmitter and ∼0 dBm at the 3D printed antenna feed. Figure 12 shows some highlights from a flight at a nominal altitude of ∼100 m AGL over a 100 m transect. The radar detected the snow surface with ∼30 dB SNR before any additional integrations. Further, the radar demonstrator sounded distinct seasonal snow/firn layers to a depth of ∼30 m below the surface with a dielectric constant of 2.1 [Reference Mojtabavi, Wilhelms, Cook, Davies, Sinnl, Jensen, Mathias, Dorthe, Anders, Vinther, Kipfstuhl, Karlsson, Faria, Gkinis, Kjær, Erhardt, Berben, Nisancioglu, Koldtoft and Rasmussen24]. After adjusting the contrast of the echogram in Fig. 12(c) and 12(d) shows the deepest discernible layer returns more clearly. These results confirm satisfactory operation of the radar test bed to map seasonal accumulation layers from a small UAS.
Photograph showing one of the coauthors operating the Aurelia X-6 pro UAS equipped with the 2–8 GHz compact radar demonstrator (a); radar image showing a full frame with successful radar data acquisition (b); radar echogram highlighting snow layers near the surface with A-scope on the right inset (c); and contrast-enhanced echogram showing the deepest layers at a depth of 30 m.

Conclusions
We developed a low-power, low-cost microwave frontend and radar demonstrator for down-looking measurements of snow thickness from a small UAS. We built the microwave chirp generator, RF/IF receivers and most of the transmitter section based on discrete printed circuit boards fabricated on FR-408HR laminate substrate. We tested each of the radar constituents and then conducted system level tests in the laboratory for both the 2–8 and 12–18 GHz bands. Next, we deployed the radar demonstrator to Antarctica during two consecutive field seasons for test of opportunity using the 2–8 GHz band on a sled-based setup. The radar test bed successfully mapped snow layers to a depth close to ∼30 m and sounded the ice-shelf bottom in some areas to a depth close to 40 m. Next, we integrated the low-cost microwave frontend, a custom miniature digital backend, DC power circuitry and a set of 3D printed antennas onto an Aurelia X6 pro UAS and collected radar data over grass-covered ground and a wooded area with sparse foliage. We were able to verify the functionality of the system at altitudes up to 75 m and measured signatures from the tree canopies and the ground by exercising the 2–8 and 12–18 GHz bands. Lastly, we employed the same radar-equipped UAS on the Greenland Ice Sheet and measured seasonal accumulation from 100 m AGL altitude to a depth of ∼30 m using the 2–8 GHz modality.
Acknowledgement
NSC-614-7302 dated June 2025 Unclassified Unlimited Release. Notice: This manuscript has been authored by Honeywell Federal Manufacturing & Technologies, LLC under Contract No. DE-NA-0002839 with the U.S. Department of Energy/National Nuclear Security Administration. The United States Government retains and the publisher, by accepting the article for publication, acknowledges that the United States Government retains a nonexclusive, paid-up, irrevocable, worldwide license to publish or reproduce the published form of this manuscript, or allow others to do so, for United States Government purposes. This work was also funded in part by the National Science Foundation (NSF), and in part by the Center for Remote Sensing and Integrated Systems (CReSIS). L. Taylor was supported by the KU Madison and Lila Self Graduate Fellowship Program. We sincerely thank Prof. K Christianson, University of Washington, for facilitating access to the field test sites in Greenland and Antarctica; and CReSIS personnel for local X6 flight support, echogram generation from the Ross Ice Shelf data, and general fabrication assistance.
Competing interests
The authors declare none.

Fernando Rodriguez-Morales received the B.S. degree in electronics engineering from the Universidad Autónoma Metropolitana, Mexico City, Mexico, in 1999, and the M.S. and Ph.D. degrees in electrical and computer engineering from the University of Massachusetts, Amherst, MA, USA, in 2003 and 2007, respectively. His graduate research focused on low-noise receiver technologies for passive remote sensing at microwave, millimeter-wave, and submillimeter wave frequencies. Since 2007, he has been with The University of Kansas, Lawrence, KS, USA, where he is currently a Senior Scientist with the Center for Remote Sensing and Integrated Systems and holds a courtesy faculty appointment with the Department of Electrical Engineering and Computer Science. His technical research interests include RF circuit design, extending the capabilities of ultrawideband radar sensors, as well as packaging, miniaturization, and hardening of advanced high-frequency sensors and systems.

Carlton Leuschen received the B.S (with highest distinction), M.S., and Ph.D. (with honors) degrees from the Radar Systems and Remote Sensing Laboratory, University of Kansas (KU), Lawrence, KS, USA, in 1995, 1997, and 2001, respectively. He is currently a Professor with the Department of Electrical Engineering and Computer Science and the Director of the Center for Remote Sensing of Integrated Systems (CReSIS), KU. Prior to joining KU in 2006, he was a Senior Professional Staff Member with the Space Department, Applied Physics Laboratory, Johns Hopkins University, Laurel, MD, USA. He has served as a Participating Scientist for the Mars Advanced Radar for Subsurface and Ionosphere Sounding instrument aboard the European Space Agency Mars Express Mission and the Mars Shallow Radar Sounder instrument aboard the National Aeronautics and Space Administration (NASA) Mars Reconnaissance Orbiter. His research interests include radar technologies for airborne measurements of ice sheets and planetary sounding applications.

Lee Taylor received the B.S. degree in electrical engineering from The University of Kansas, Lawrence, KS, USA, in 2021. While completing his undergraduate program, he played a key role in a student engineering group for the nanosatellite KUbeSat-1 (launched into orbit in 2024), participated in a wide array of research projects with the Center for Remote Sensing and Integrated Systems (CReSIS), and held positions in the industrial sector as an engineering intern. He is currently pursuing a Ph.D. degree in electrical engineering with CReSIS, focusing on radar systems and signal processing. Mr. Taylor is a recipient of the Madison and Lila Self Graduate Fellowship and a participant of the Radar Consortium. His current research interests include SAR imaging employing low-size, weight, and power (SWaP) radar systems, as well as system design considerations for miniaturizing wide-bandwidth FMCW systems.

Vincent Occhiogrosso received the B.S. degree and the M.S. degree in electrical engineering from The University of Kansas, Lawrence, KS USA, in 2020 and 2023, respectively. He was both an undergraduate and graduate research assistant with the Center for Remote Sensing and Integrated Systems (CReSIS) at The University of Kansas and a participant of the Radar Consortium. At CReSIS, he supported a wide range of projects related to RF/microwave technology, antennas, and radar system design. Mr. Occhiogrosso is currently an RF Analog Hardware Design Engineer at Qualcomm in San Diego, CA, USA.

James Mendel received the B.S. degree in electrical engineering from The University of Kansas, Lawrence, KS, USA, in 2023. As an undergraduate student he held various internship positions in the commercial engineering sector. Mr. Mendel was also a research assistant with the Center for Remote Sensing and Integrated Systems (CReSIS) and took part in the Radar Consortium. At CReSIS, he was involved in the design of various subsystems for radar, including DC and RF circuits and 3D printed waveguide microwave filters and antennas. Mr. Mendel and his team were the recipients of the 2023 Rummer Award from the Department of Electrical Engineering and Computer Science at The University of Kansas. He is currently a R&D Hardware Engineer at Medtronic in Boulder, CO, USA.

J. Ambrose Wolf received the Dipl.-Phys. (M.S. equivalent) degree in physics from the University of Münster, Münster and the Forschungszentrum Jülich, Jülich, Germany, in 1989, and the Doctor Rerum Naturalium (Ph.D. equivalent) degree in physics from the University of Köln, Köln and the Forschungszentrum Jülich, Jülich, Germany, in 1992. His master’s and Ph.D. theses focused on thin magnetic films and multilayers. He was a Post-Doctoral Researcher with the University of Basel, Basel, Switzerland, and with the Naval Research Laboratory, Washington, DC, USA. He was also an Assistant Professor with the Department of Physics, University of Missouri, Columbia, MO, USA, and an Assistant and Tenured Associate Professor with the Department of Physics, Augsburg College, Minneapolis, MN, USA. In 2004, he joined Honeywell FM&T, Kansas City, MO, USA, where he is currently the Technology Consortium and External Research and Development Leader and supports science, research, and development of far future and horizon technologies.



 Open access

